
Revisiting Food Deserts in North Carolina, USA, Using a Cloud-Based
Real-Time Quality Assurance/Quality Control (QA/QC) Tool
Timothy Mulrooney
a
and Isabel Gutierrez
b
Department of Environmental, Earth and Geospatial Sciences, North Carolina Central University,
Durham, North Carolina, U.S.A.
Keywords: Food Environment, Geographic Information Systems, Quality Assurance, Quality Control, Spatial Data
Quality.
Abstract: In the study of the food environment, little research has explored the spatial data quality of store locations
which impacts the spatial representation of the food environment. In this paper, we created a cloud-based
tool that can inspect, edit and create new supermarkets in real-time which changes the complexion of the food
environment. Comparisons were made between data supplied between a CAB (Commercially Available
Business) Database and those corrected after field verification. Results showed differences between the food
environment using the data provided and the actual food environment after QA/QC, with a general
underestimation of those who are truly food needy due to errors of temporal accuracy, misattribution and
geocoding in the original data provided.
1 INTRODUCTION
An underlying theme of underrepresented and
marginalized communities across the United States is
differential access to community amenities. In
particular, healthy food is one of these amenities to
which these communities have poorer access.
Organizations such as the United States Department
of Agriculture (USDA) has utilized the term food
desert to highlight regions within low-income
communities located far from fresh and healthy
sources of food in the form of supermarkets and
supercenters. These Low Income/Low Access
(LILA) regions can visualized through the USDA
Food Access Atlas (https://www.ers.usda.gov/data-
products/food-access-research-atlas/go-to-the-atlas/)
at the census tract level. Furthermore, data which
compose these maps include more than 140 attributes
across 72,000 census tracts that can be downloaded,
analyzed and mapped within the confines of a GIS
(Geographic Information System).
The USDA helps determine access by its
physical proximity to supermarkets using geographic
measurements. The data on which this proximity is
measured changes on a regular basis due to the
a
https://orcid.org/0000-0001-9333-9641
b
https://orcid.org/0000-0001-6413-5463
closing and opening of new stores, and is further
exacerbated by the fidelity of those data on which
measurements are based. An understudied tenet of
food environment research is an overall assessment
and evaluation of the spatial data quality, in this case
the supermarkets store data used to measure this food
access. This assessment has been easier with custom
phone applications that can access data stored in the
cloud to inspect, verify, edit and re-attribute the
spatial data used to represent supermarkets and the
larger food environment in general. These errors of
omission and commission can have a distinct impact
on these regions highlighted as Low Access by the
USDA Food Access Atlas and those regions that are
truly low access using the most current data. In this
study, supermarkets for a 5-county region in North
Carolina, United States, are brought into a custom
field application that can explore various accuracies
(horizontal, temporal, attribute) of existing data to
answer the question of to what extent do real-time
QA/QC techniques impact the spatial and
statistical representation of the food environment.
After a comprehensive QA/QC is run on the data
using this phone application, newly-analyzed Low
Access (LA) and then LILA regions using these
Mulrooney, T. and Gutierrez, I.
Revisiting Food Deserts in North Carolina, USA, Using a Cloud-Based Real-Time Quality Assurance/Quality Control (QA/QC) Tool.
DOI: 10.5220/0011713500003473
In Proceedings of the 9th International Conference on Geographical Information Systems Theory, Applications and Management (GISTAM 2023), pages 115-122
ISBN: 978-989-758-649-1; ISSN: 2184-500X
Copyright
c
2023 by SCITEPRESS – Science and Technology Publications, Lda. Under CC license (CC BY-NC-ND 4.0)
115
corrected data are compared to LA and LILA data
utilized using the USDA Food Access Atlas. Using
statistical and geostatistical tools, the level of
agreement and disagreement between USDA Food
Access maps and maps using corrected data will be
measured to explore if, where and how these
differences exist across the study area.
2 LITERATURE REVIEW
Spatial data quality is the result of frameworks
designed to ensure newly created data are correct
(Quality Assurance) while identifying existing data
that are incorrect (Quality Control). Although the
QA/QC of spatial data within a GIS is required as per
Federal Geographic Data Committee (FGDC)
standards and various organizations have processes in
place to ensure the various accuracies are adhered to
that best fit their needs, resources and limitations, it
has not been at the forefront of GIS research when
compared to other facets of Geographic Information
Science. GIS data, subsequent analysis and products
of this analysis such as decisions and maps are only
as good as the data on which it is based. Newcomer
and Szajgin (1984) and later Heuvelink (1998)
showed inaccuracies in original GIS data exacerbated
data quality throughout the life of a GIS project,
culminating in unreliable analysis and maps.
QA/QC procedures have been applied to digital
data related to the food environment. Liese et al.
(2010) and Auchincloss et al. (2012) explored the
quality of purchased retail location data, referred to as
Commercially Available Business (CAB) data.
These CAB data serve as a baseline for data
QA/QCed in the field in this project. Other studies by
Mendez et al. (2016), Rummo et al. (2015), Han et al.
(2012) and Hosler and Dharssi (2010) were
performed for Pittsburgh Durham, Chicago, Albany
and respectively. All cited some degree of difference
between CAB data versus field-based and automated
methods. Sharkey and Horel (2009) verified the
addresses of food sources provided from independent
sources such as Internet telephone directories,
telephone directories and the Texas Department of
Agriculture. They found 18.9% of food sources
provided via this public data could not be verified.
Furthermore, they found 35.7% of food sources
within their study area were only identified through
ground-truthing, representing errors of omission. In
another study by Lake et al. (2012), field verification
was performed on 21 different food source categories
(Restaurant, Pub/Bar, etc.) across different
permutations of socio-economic status (SES) and
population density (urban, rural, mixed). For the rural
low SES, more than one third (36%) of food sources
provided could not be found in the field (i.e., error of
commission). Not only is access and availability
compromised in marginalized areas, but the quality of
data as well. In North Carolina, Vilme et al. (2020)
complemented CAB data developed by
ReferenceUSA (the predecessor to DataAxle) with in
situ verification through Google or the facility’s web
site. They further utilized the Jackson Heath Study
Retail Store classification to derive favorable,
unfavorable and unknown categories from 15
different classifications. These categories will be
important in this study as census tracts will be
denoted as LA vs. not LA or LILA vs. not LILA based
on proximity measures provided by the USDA and
then recreated using QA/QCed data.
3 STUDY AREA
As part of a larger research project into large-scale
data quality issues across North Carolina’s food
environment, a 5-county study area in central North
Carolina was created across the counties of
Alamance, Chatham, Orange, Person and Yancey
Counties. This study area was selected due to its 1)
proximity to the author’s host institution so field
QA/QC could be performed 2) an area that has a
manageable number of supermarkets that could be
handled within the scope of this project and 3) the
combination of rural to suburban and urban regions in
Table 1: Summary of Study Area Using USDA Food Access Atlas Data.
Urban Non-Urban Study Area
# Census Tracts 46 44 90
Total Po
p
ulation 204,064 207,556 411,620
% Minorit
y
(
Non-White
)
31.7 21.5 26.7
Median Famil
y
Income $79,003 $79,905 $79,449
Poverty Rate 19.4 11.5 15.5
% Kids (Under age 17) 21.6 22.1 21.9
% Seniors (Over age 65) 13.1 14.7 13.9
% Grou
p
Quarters 6.3 1.53 3.96
GISTAM 2023 - 9th International Conference on Geographical Information Systems Theory, Applications and Management
116
the area. This includes the cities of Burlington (2020
pop. 57,303) and Chapel Hill (61,960). Utilizing 2010
census data via the USDA Food Access Atlas, the
study area’s 90 census tracts contain a 2010
population of 411,620. Tracts range in size of .26 sq.
miles (.67 sq. km) in Chapel Hill to 160.82 square
miles (416.51 sq. km) in rural Chatham County.
Populations range from 1,450 to 8,760 per census
tract. Within these data provided via the Food Access
Atlas is a flag (1 = yes, 0 = no) to denote if a census
tract is urban, as well as well as information about
income, food availability, and related socio-economic
factors such as age, race, incomes and ethnicity in a
spreadsheet format across more than 140 attributes.
Table 1 highlights the composition for the study area.
4 DATA AND METHODS
Data from the USDA Food Access Atlas were
downloaded, brought into a GIS and mapped for the
study area. Also included in the aforementioned
socio-economic-demographic variables (Table 1) are
metrics related to those census tracts that are Low
Access (LA) and Low Income/Low Access (LIIA).
According to the USDA (https://www.ers.
usda.gov/data-products/food-access-research-
atlas/documentation/), LA is defined as “a tract with
at least 500 people, or 33 percent of the population,
living more than 1 mile (urban areas) or 10 miles
(rural areas) from the nearest supermarket.” LILA are
defined to be census tracts that satisfy both Low
Access (LA) and Low Income (LI), which represent
tracts where the “annual family income at or below
200 percent of the Federal poverty threshold for
family size.”
Table 2: Information about study area using USDA Food
Access Data.
Urban Rural Total
# LA Tracts 29 6 35
# LILA Tracts 14 4 18
Po
p
ulation LA 130,870 26,642 157,512
Po
p
ulation LILA 66,262 18,372 84,634
4.1 Development of QA/QC Tool
Data related to supermarkets were utilized by point
data provided by DataAxle. These data were queried
using their NAICS (North American Industry
Classification Standard) code which classifies
business establishments by their primary economic
activity. According to the database, there are 104
stores classified as supermarkets within the study
area. These data were exported to the cloud that could
be accessed using desktop applications such as ArGIS
Pro, online applications such as ArcGIS Online as
well as online and smartphone applications such as
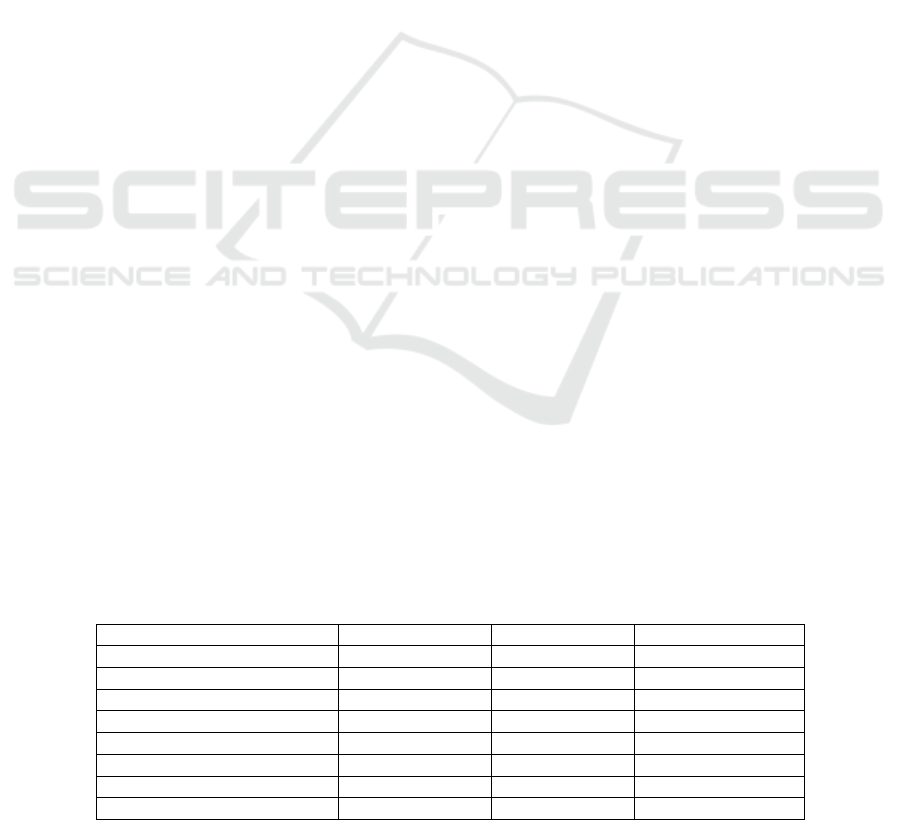
Esri Field Maps. These field maps have advantages
over applications such as Survey123 which create
data from scratch in that data can be added to the
existing database or edited from data brought in by
the data creator. Furthermore, additional fields can
be added to data where Survey123 does not allow for
those on-the-fly changes after features have been
created. This application has simple drop-down
menus to answer questions related to temporal,
attribute and positional accuracy of the data in
question. It also allows images of the site to be
captured and attached to data records.
Figure 1: Esri Field Maps Application.
A Standard Operating Procedure (SOP)
document was developed to maintain consistency in
data collection. Data QA/QC took place over the
Spring of 2022 using a combination of actual field
visits complemented with virtual field visits using
GoogleMaps and NCOneMap data where updated
imagery were available using the latest imagery
available through the North Carolina Department of
Transportation imagery service (https://
services.nconemap.gov/secure/rest/services).
4.2 Creation of Low Access Tracts
After QA/QC, 84 supermarkets were identified within
in the study area. From these 84 supermarkets, GIS
calculations were performed on the data using the
same methodology as the USDA Food Access
calculations. The methodology used was 1) the study
area is divided into ½ kilometer square grids and then
2) the distance to the nearest supermarket is measured
from the center of the grid to the center of the grid
with the nearest supermarket. The distances were
then grouped at the census tract level which contains
estimates on population. This was done using the
Revisiting Food Deserts in North Carolina, USA, Using a Cloud-Based Real-Time Quality Assurance/Quality Control (QA/QC) Tool
117
Create Fishnet function to create 37,816 grids within
the study area. The Near function was used to
calculate the distance between grid centroids and the
center of the grid within the nearest supermarket.
Lastly, the Spatial Join function was used to group
grid centroids with the calculated distance within
each census tract. Urban tracts whose average
distance was more than 1 mile was calculated as LA
while rural tracts whose distance was more than 10
miles was denoted as LA. Those tracts that are now
denoted as LA were compared to the existing LI
Tracts from the USDA tract-level data to delineate
new LILA tracts.
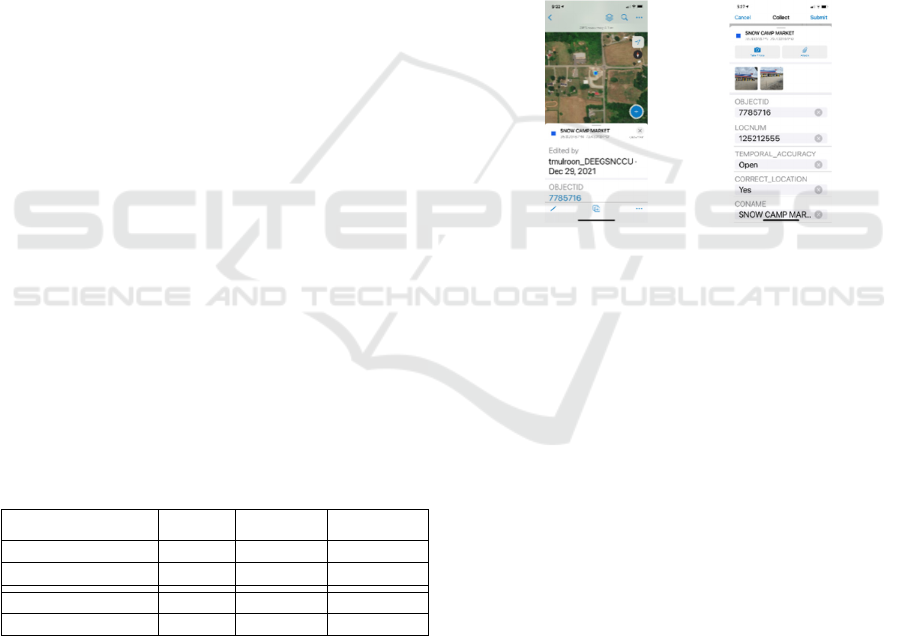
4.3 Comparison of USDA Map and
Newly Created Low Access Map
LA census tracts according to the USDA (Figure 2)
and then using the new calculations after QA/QC
(Figure 3) were created. Maps of LILA tracts
according to the USDA Food Access Atlas and their
QA/QCed counterparts were also created.
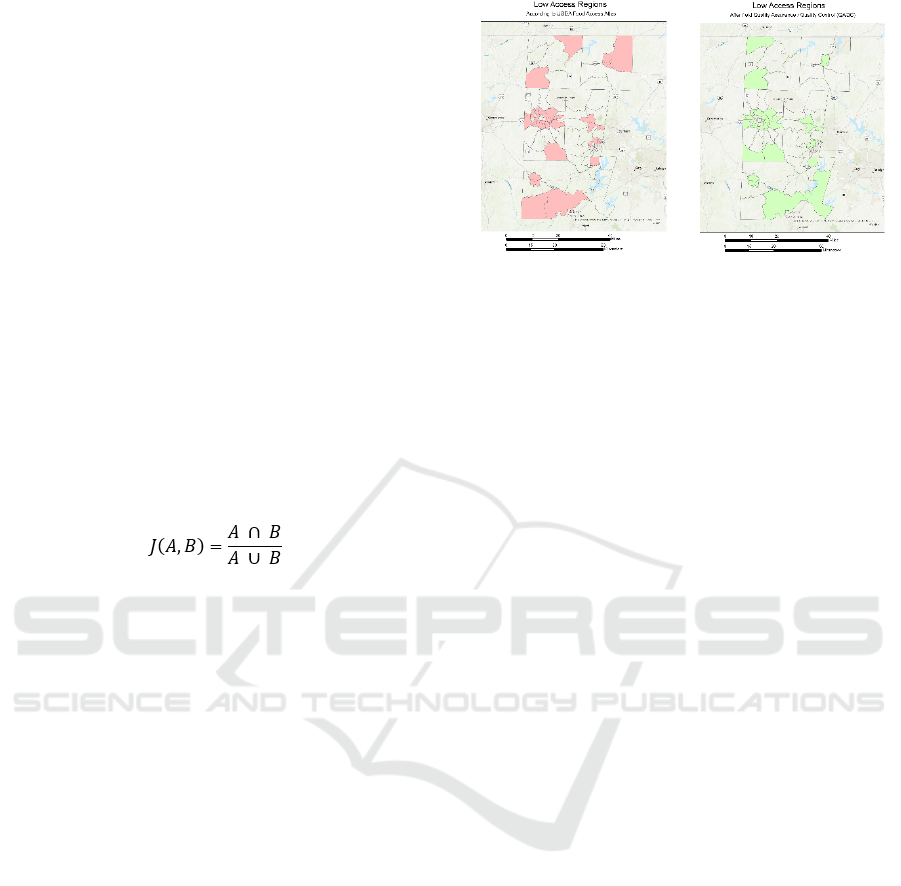
When compared visually, they have tremendous
aesthetic value, but little computational value. In
response, the Jaccard Index or Jaccard Similarity
Index is a statistic for gauging the similarity and
diversity of sample sets. The Jaccard Index has been
traditionally used in object detection in digital images
and even raster GIS data. In this research, this metric
is useful since LA and LILA are Boolean values (1 or
0) instead of continuous numeric values where
regression or other statistical measures could be used.
It measures the intersection (values that are common
between two different methods) when compared to
the union (all values between different methods) for
all 90 census tracts within the study area. The Jaccard
Index ranges between 0 (complete dissimilarity) to 1
(complete similarity). Another test for similarity that
can be computed within the confines of a GIS is
McNemar’s test, which creates a χ
2
statistic and
accompanying p-value for statistical significance on
paired nominal data, in this case true (1) and false (0)
values created for Low Access and LILA between the
before and after QA/QC datasets. It expands upon the
Jaccard Index by breaking down the indiviudal
complements (tracts that do not intersect) from the
Jaccard Index calculation and uses a contingency
table to determine where two attributes/maps for the
same group of enumeration units disagree with each
other with statistical significance
.
F
igure 2: Low Access
Tracts as per USDA Food
A
ccess Atlas.
Figure 3: Low Acces Tract
s
after QA/QC.
Practically applied, the visualization of these
changes can be articulated through a drive-time map
created using data from before QA/QC and after
QA/QC. While it is difficult to determine which
points were used in the determination of the USDA’s
Food Access database, the before and after
supermarket stores taken from DataAxle data were
utilized using the Network Analyst tool’s function of
Service Area to create a polygon representing a 10-
minute drive-time from supermarkets and then
compared based on census block group and block
level data taken from the census. Not only can these
drive-time maps be visualized, but the impacted
populations calculated while summarizing the types
of errors taken.
5 RESULTS
Table 3 highlights a summary of both the number of
census tracts and population considered to be LA and
LILA from before QA/QC (Using USDA Food
Access Atlas) and after QA/QC using data checked in
the field. While the number of census tracts impacted
remain almost the same, the reconfiguration of these
census tracts highlights a 2.71% decrease in LA
populations between USDA Food Access values and
those calculated after QA/QC. Furthermore, the
population denoted as LILA according to the USDA
Food Access Atlas is 11.84% more than LILA
counterparts after QA/QC. Overall, given the
decreased number of supermarkets found in the field
after QA/QC (84) versus the original number of
supermarkets (104), there is a general overestimation
of food needy (both Low Access and LILA) regions
(except for LILA urban) using the USDA Food
Access when compared to data after QA/QC at this
scale.
GISTAM 2023 - 9th International Conference on Geographical Information Systems Theory, Applications and Management
118
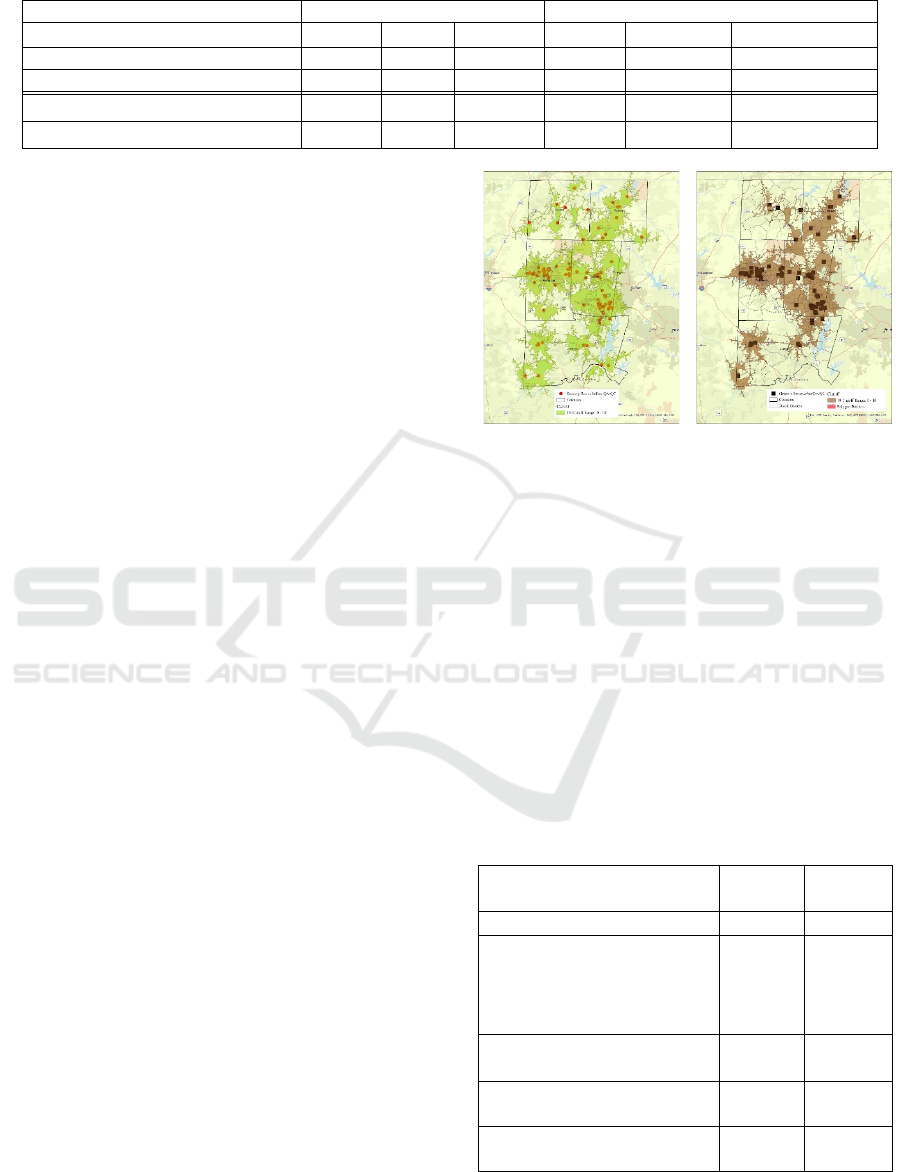
Table 3: Summary of Results from Before and After QA/QC.
Before QA/QC After QA/QC
Urban
R
ural Total Urban
R
ural Total
# Low Access Tracts 29 6 35 29 6 35
# LILA Tracts 14 4 18 15 1 16
Po
p
ulation of Low Access Tracts 107,336 37,360 144,696 132,136 24,920 157,056
Po
p
ulation of LILA Tracts 67,331 18,581 85,912 70,484 5,547 76,031
5.1 Jaccard Index
As applied to the USDA LA tracts against the newly-
created LA tracts using the methods described above
results in a Jaccard Index of .867. In the 12 cases of
disagreement between the two sets, six were the result
of previous LA regions that were no longer Low
Access after QA/QC. The other six were denoted as
Low Access after QA/QC after not being identified as
Low Access in the original USDA data. Calculating
the Jaccard Index for LILA results in a value of .933.
In cases of disagreement, two census tracts not
identified as LILA in USDA data were denoted as
LILA after QA/QC while four census tracts lost their
status of LILA after QA/QC.
5.2 McNemar’s Test
McNemar’s test highlighted 12 disagreements from
before QA/QC. Two separate McNemar’ tests were
run on the Low Access and LILA variables. Tests of
statistical significance calculate a χ
2
statistics as the
probability of the each outcome occuring independent
of each other through its discordants. With a χ
2
statistic value of .083 and p-value of .772, there is not
enough evidence to support a difference in marginal
probabilities for LA between the original data and
QA/QCed data. For LILA, the χ
2
statistic value is
.167 resulting in a p-value of .683. As a result, there
is not enough evidence to show significant
differences in the number and probability of LA and
LILA regions within the study area before and after
QA/QC.
5.3 Drive Time Map
Drive-time maps visualize the practical challenges of
accessing healthy food and providing an overall
complexion of the food environment understandable
to all level of users. Using Esri’s Network Analyst
tool, a 10-minute drive time was calculated around
the 104 stores (Figure 4) that existed in the original
database and then the 84 stores resulting after QA/QC
as shown in Figure 5.
To increase granularity, block group level data
F
igure 4: 10-minute drive
t
ime to supermarkets of data
b
efore QA/QC.
Figure 5: 10-minute driv
e
time to supermarkets of dat
a
after QA/QC.
were agglomerated from the 267 block groups and
11,138 blocks composing the 90 census tracts within
the study area. Using the Select by Location and
Statistics tools, information is highlighted about the
populations within 1 mile, 5 miles and the 10-minute
drivetime from supermarkets before and after
QA/QC. As highlighted in the results in Table 4, the
population calculated to be within a 5-mile distance
of supermarkets using non-QA/QCed data is
approximately 7.0% more than its QA/QCed
counterparts. The difference for a 10-minute drive
time map (Figure 5) represents a 7.22%
Table 4: Summary of various buffers and drive-times before
and after QA/QC of supermarkets.
Before
QA/QC
After
QA/QC
# of su
p
ermarkets 104 84
Population within 1 mile of
supermarket*
219,944 195,380
Population within 5 miles of
supermarket*
372,051 347,713
Population outside 5 miles of
supermarket*
39,697 64,035
Population within 10-minute
drive of su
p
ermarket*
384,373 358,481
Population outside 10-minute
drive of supermarket*
27,375 53,267
* Based on block level data
Revisiting Food Deserts in North Carolina, USA, Using a Cloud-Based Real-Time Quality Assurance/Quality Control (QA/QC) Tool
119

overestimation of non-QA/QCed data versus its
QA/QCed counterparts. As a result, more than 26,000
people within the study are who are estimated to be
living within a 10-minute drive of a supermarket
using one set of data who do not live within this
threshold using field-checked data. CAB data grossly
overestimates food-secure populations and
underestimates the number of people living in food-
needy regions by almost half (27,375 vs. 53,267)
based on supermarket data that exists in the field.
6 DISCUSSION
While this study is meant to estimate the food
environment and simulate those methods from the
USDA Food Access Atlas to create comparative
statistics through the lens of supermarkets,
supermarkets do not represent the entire food
environment. While food can be found in such
disparate places such as restaurants, laundromats and
home improvement stores, stores such as Dollar
General, not represented in supermarkets stores, are
gaining a foothold in areas overlooked by major
supermarkets and grocery stores. Many of these
Dollar Generals stores provide staples such as
vegetables, fruits, milks and eggs that are indicative
of supermarkets and grocery stores and a healthy food
environment.
Between 2009 and 2021, just the number of
Dollar General stores have more than doubled (17 to
37) in the study area and 12 out of the 35 census tracts
denoted as LILA within study area contain a Dollar
General. Future food environment studies should
include stores such as Dollar General which provide
alternatives to supermarkets and smaller grocery
stores that are also affordable.
F
igure 6: Healthy and fresh food offerings in Dolla
r
General store within study area.
Besides the McNemar’s Test, this research
highlighted differences in the represented and real
food environments using maps and descriptive
statistics. More robust statistics with statistical
significance such as those using a two-tail t-test
exploring differences in socio-economics across
LILA regions using CAB data versus ground-truthed
data (for example, exploring median household
income in LA regions from the USDA Food Access
Atlas via Figure 2 versus the median household
income in Low Incomes from data extracted from this
research via Figure 3) may better reinforce the need
for ground-truthed data. Other research (Real and
Vargas 1996) has explored the conversion of the
Jaccard Index to p-values. However, these topics are
a subject for future research.
Data were analyzed at the census tract level
because data provided by the USDA Food Access
Atlas is provided at that scale. While these tract-level
LI and LILA designators can be applied to the census
block groups that lie within them, LI and LILA be
calculated using the USDA methodology from
QA/QCed data, accumulating statistics or making
comparisons using socio-economic information at the
block group level can be problematic because of the
reliability of data. Socio-economic data are collected
through the American Community Survey (ACS).
Within ACS data, three classes of reliability exist:
High, Medium and Low. In general, reliability of data
collected at the census tract level is much better than
counterparts at the block group level.
Included in these data is a flag (1 = yes, 0 = no)
to denote if a census tract is urban. This flag can be
problematic because census tracts that are not urban
should not be automatically considered rural although
they are applied this way in this research. There is a
continuum of urban to rural and many agree that there
is no single definition of rural that best encapsulates
the concept of rural across various applications, needs
and scales (Nelson et al., 2021; Coburn et al., 2007).
There are up to nine different definitions of the term
rural used by the U.S. federal agencies. With the
variety of quantitative definitions, the important
questions arise on the consistency of the major
operational definitions of rural and the practical
implications of the differences in identifying rural
populations based on alternative, commonly used
quantitative criteria for rurality highlighted in this
research. One recent study by the research team
(Mulrooney et al. 2023) showed the application of the
term rural utilizing the USDA RUCA (Rural-Urban
Commuting Area) best aligns with other definitions
of rural, and future applications of these data should
somehow incorporate this application with existing
Food Desert Atlas data.
7 CONCLUSIONS
Deterministic data models can model the food
environment given well-understood rules, parameters
and data. In this study, low access (LA), low income
GISTAM 2023 - 9th International Conference on Geographical Information Systems Theory, Applications and Management
120

(LI), low income and low access (LILA) can be
extracted from existing data via the USDA Food
Access Atlas based on access to supermarkets as part
of a larger study on food deserts. However, little
work has been studied to understand the accuracy of
supermarket data on which this low access is based
and how this accuracy is manifested in changed or
compromised food environments based on input data
assumed to be correct and data which have been field
checked. The assessment of these data has been
easier with custom phone applications that can access
data stored in the cloud to inspect, verify, edit and re-
attribute the spatial data used to represent
supermarkets and the larger food environment in
general. In this study, we utilized real-time QA/QC
procedures merging hand-held phone applications
and cloud data to 1) explore errors of omission and
commission for Commercially Available Business
(CAB) Databases and their counterparts QA/QCed in
the real world 2) measure the differences in the CAB
database and data after QA/QC and 3) explore the
spatial differences in the food environment as a result
of the differences in these two sets of data.
In this study, supermarket data extracted from
DataAxle were checked in the field to explore errors
of omission and commission. Based on the QA/QCed
data, new Low Access (Figure 6) and LILA maps
were created based on the methodology to create
these data at the census tract level and compared to
the original USDA Food Access Atlas (Table 3). At
the census tract scale, results highlight a general
overestimation of food needy populations when
compared to data calculated using supermarkets
currently in the field, but even greater
overestimations of rural food needy populations
(18,581 estimated using USDA Food Access Atlas vs.
5,547 using QA/QCed data). Jaccard Indices for both
Low Income (.867) and LILA (.933) also indicate
general agreement between the two sets of data, as
well as the McNemar’s Test which highlight there is
not enough evidence to show significant differences
in the number and probability of Low Access and
LILA regions within the study area before and after
QA/QC.
Probably most accentuated were drive-time maps
and accompanying tables comparing the CAB data
versus QA/QCed counterparts through the mapped
food environment. Most obvious in these maps are
differences in southern Alamance and Caswell
Counties, as well as southeastern Chatham County,
which indicated compromised food environments
after QA/QC. DataAxle data had indicated these rural
regions did in fact contain supermarkets and grocery
stores while QA/QC unearthed the contrary.
In summary, this research has higlighted the
following:
• Phone applications such as Esri Field Maps or
Survey123 are relatively easy to create and allow
for real-time attribution/reattribution and
creation of cloud-based data that can be analyzed
in the field and can easily be integrated into
applications such as utility mapping and
inspections.
• QA/QC procedures found 20 less supermarkets
in the study area after QA/QC (84) compared to
the data provided in the CAB (104). Reasons for
these differences included 1) the business was
not a supermarket 2) the point in the CAB was
actually a residential address 3) the food source
in the CAB was permanently closed and 4) the
point did not exist in the CAB database,
highlighting an error or omission.
• The one error of omission occurred in Chatham
County in the town of Pittsboro. However, it was
located close to other grocery stores and did not
impact the overall food environment.
• While the food environments before and QA/QC
generally agreed with each other statistically,
there appeared to be an overestimation of food
accessible populations (i.e., an underestimation
of food needy populations) using CAB data
compared to its QA/QCed counterparts.
• Major differences in the food environment were
found in rural areas in southern Alamance and
Caswell Counties, as well as southeastern
Chatham County due to supermarkets that were
found not to exist after QA/QC.
With the interoperability and relative ease of
powerful desktop applications and cloud-based data
that can be updated in real-time, on-the-fly food
environment maps can be created using the latest and
most updated data from the field. These maps can
guide policy and facilitate decisions regarding those
who are represented as food needy through
applications such as the USDA Food Access Atlas
versus those who truly food needy based on real-time
data extracted through the applications and analysis
as part of this research.
ACKNOWLEDGEMENTS
The project was supported by the Agricultural and
Food Research Initiative Competitive Program of the
USDA National Institute of Food and Agriculture
(NIFA), grant number 2021-67021-34152. This
material is also supported by the National Science
Foundation under Grants No. 1824949 and No.
Revisiting Food Deserts in North Carolina, USA, Using a Cloud-Based Real-Time Quality Assurance/Quality Control (QA/QC) Tool
121

2226312. Any opinions, findings, and conclusions or
recommendations expressed in this material are those
of the author(s) and do not necessarily reflect the
views of the NSF and USDA.
REFERENCES
Auchincloss, A., Moore, K., Moore, L. and Diez-Roux, A.
(2012). Improving retrospective characterization of the
food environment for a larger region in the United State
during a historic time period. Health and Place, 18(6),
1341 – 1347.
Coburn, A. F., MacKinney, A. C., McBride, T. D., Mueller,
K. J., Slifkin, R. T., Wakefield, M. K. (2007). Choosing
rural definitions: Implications for health policy. Rural
Policy Research Institute Health Panel (Issue Brief #2).
Felgueiras, Carlos Alberto et al. (2017). Modeling and
visualization of uncertainties of categorical spatial data
using geostatistics, 3D planar projections and color
fusion techniques. Proceedings of GEOINFO 2017,
152 – 162.
Han, E., Powell, L., Zenk, S., Rimkus, L, Ohri-Vachaspati,
P. and Chaloupka, F. (2012) Classification bias in
commercial business lists for retail food stores in the
U.S. International Journal of Behavioral Nutrition and
Physical Activity, 46, https://doi.org/10.1186/1479-
5868-9-46.
Hosler, A. and Dharssi, A. (2010). Identifying retail food
stores to evaluate the food environment. American
Journal of Preventive Medicine, 39(1), 41 – 44.
Heuvelink, G.B.M. (1998). Error propagation in
environmental modeling with GIS. New York, NY:
Taylor and Francis.
Lake A.A., Burgoine T., Stamp E. and Grieve, R. (2012).
The foodscape: classification and field validation of
secondary data sources across urban/rural and socio-
economic classifications in England. International
Journal of Behavioral Nutrition and Physical Activity,
9(1), 37.
Liese, A., Clabianchi, N., Lamichhane, A, Barnes, T.
Hibbert, J., Porter, D., Nichols, M. and Lawson, A.
(2010). Validation of 3 food outlet databases:
completeness and geospatial accuracy in rural and
urban food environments. American Journal of
Epidemiology, 172(11), 1324 – 1333.
Mendez, D., Kim, K., Hardaway, C. and Fabio, A. (2016).
Neighborhood racial and socioeconomic disparities in
the food and alcohol environment: Are there difference
by commercial data sources? Journal of Racial and
Ethnic Health Disparities, 3, 108 – 116.
Mulrooney, T., Liang, K., Kurkalova, L., McGinn, C. and
Okoli, C. (2023). Quantitatively Defining and
Mapping Rural: A Case Study of North Carolina.
Journal of Rural Studies, 97, 47 – 56.
Nelson, K.S., Nguyen, T.D., Brownstein, N.A., Garcia, D.,
Walker, H.C., Watson, J.T. and Xin, A. (2021).
Definitions, measures, and uses of rurality: A
systematic review of the empirical and quantitative
literature. Journal of Rural Studies, 82, 351-365.
Newcomer, J.A. and Szajgin, J. (1984). Accumulation of
thematic map errors in digital overlay analysis. The
American Cartographer, 11(1), 58 – 62.
Real, R. and Vargas, J.M. (1996). The Probabilistic Basis
of Jaccard’s Index of Similarity. Systematic Biology,
45, 380-385.
Rummo, P., Albrecht, S., & Gordon-Larsen, P. (2015).
Field validation of food outlet databases: the Latino
food environment in North Carolina, USA. Public
Health Nutrition, 18(6), 977 – 982.
Sharkey, J.R., Horel, S., Han, D. and Huber, D. (2009)
Association between neighborhood need and spatial
access to food stores and fast food restaurants in
neighborhoods of Colonias. International Journal of
Health Geography, 8(9), 1 - 17.
Vilme, H., Paul, C.J., Duke, N.N., Campbell, S.D., Sauls,
D., Muirur, C., Skinn, A.C., Boswort, H., Dokurugu,
Y.M, and Fay, J.P.(2020). Using geographic
information systems to characterize food environments
around historically black colleges and universities:
Implications for nutrition interventions. Journal of
American College Health, 70(3), 818-823.
GISTAM 2023 - 9th International Conference on Geographical Information Systems Theory, Applications and Management
122
