
Traffic Data Analysis from Social Media
Aiden Bezzina and Luana Chetcuti Zammit
a
Department of Systems and Control Engineering, University of Malta, Malta
Keywords:
Big Data Analytics, Traffic Management Reporting System, Traffic-Based Information System, Social Media
Analysis.
Abstract:
Social networking sites serve a very important role in our daily lives, providing us with a platform where
thoughts can be easily shared and expressed. As a result, these networking sites generate endless amount of
information about extensive range of topics. Nowadays, through software development, analysing the content
of social media is made possible through Application Program Interfaces (APIs). One particular application of
content analysis of social networking sites is traffic. Traffic events can be determined from these sites. Thus,
social networking sites have the potential to be utilised as a very cost-effective social sensor, whereby social
media posts serve as the sensor information. Advancements in the field of machine learning have provided
ways and techniques in which social media posts can be exploited/harvested to detect small-scale events,
particularly traffic events in a timely manner. This work aims to develop a traffic-based information system
that relies on analysing the content of social media data. Social media content is classified as either ‘traffic-
related’ or ‘non-traffic-related’. ‘Traffic-related’ events are further classified into various ‘traffic-related’ sub-
categories, such as: ‘accidents’, ‘incidents’, ‘traffic jams’, and ‘construction/road works’. The date, time, and
the geographical information of each associated traffic event are also determined. To reach these aims, several
algorithms are developed: i) An adaptive data acquisition algorithm is developed to make it possible to gather
events from social media; ii) Several supervised binary classification algorithms are developed to analyse the
content of social media and classify the results as either ‘traffic-related’ events or ‘non-traffic-related’ events;
iii) A topic classification algorithm is developed to further analyse the ‘traffic-related’ events and classify them
into the sub-categories previously mentioned; iv) A geoparser algorithm is further developed to obtain the date,
time and the geographical information of the traffic event. A fully functional, real-time, automated system is
developed by interconnecting all the algorithms together. This developed system produces very promising
results when applied to Twitter data as a source of information. The results show that social networking sites
have the potential to serve as a very efficient method to detect not only small-scale events, such as traffic
events, but can also be scaled up to detect large-scale events.
1 INTRODUCTION
Traffic congestion is a significant problem in many
cities around the world. Generally, traffic congestion
can be subdivided into two different types of conges-
tion, namely: recurrent congestion and non-recurrent
congestion (Gu et al., 2016). Recurrent congestion is
a type of congestion that occurs on a repetitive day-to-
day basis resulting in recurrent flow patterns, whereas
non-recurrent congestion is typically induced by an
abnormal or an unexpected event, such as road works
and incidents (Gu et al., 2016). Consequently, detect-
ing these types of abnormal events in both a timely
and efficient manner provides commuters the possi-
a
https://orcid.org/0000-0001-8759-2210
bility to plan their route accordingly, thus mitigat-
ing any future traffic congestion (Gu et al., 2016).
Two techniques are typically found in literature to de-
tect abnormal traffic events, namely: traditional traf-
fic event detection techniques and online traffic event
detection techniques. Traditional traffic event detec-
tion techniques usually encompass some form of data
acquisition through a physical medium, such as sen-
sors, which is then typically analysed to infer or de-
rive conclusions (Gu et al., 2016). In contrast, online
traffic event detection techniques acquire data from
social networking sites, such as Twitter or Facebook.
Traditional methods, tend to be restricted by sensor
coverage due to sparsely placed sensors. This in turn
tends to make such approaches quite inefficient when
it comes to traffic event detection due to the natural
144
Bezzina, A. and Chetcuti Zammit, L.
Traffic Data Analysis from Social Media.
DOI: 10.5220/0011716600003479
In Proceedings of the 9th International Conference on Vehicle Technology and Intelligent Transpor t Systems (VEHITS 2023), pages 144-151
ISBN: 978-989-758-652-1; ISSN: 2184-495X
Copyright
c
2023 by SCITEPRESS – Science and Technology Publications, Lda. Under CC license (CC BY-NC-ND 4.0)

randomness in the location and time of such events
(Gu et al., 2016). Moreover, social networking sites
tend to have a very large user base, allowing users
to share both images and videos, thus daily generat-
ing endless amount of data, making the online traf-
fic event detection a very cost-effective and efficient
technique relative to traditional methods (Gu et al.,
2016). Various works in literature make use of so-
cial media messages to detect traffic events such as
the work of Gu et al. (2016), Schulz et al. (2013)
and Li et al. (2012). Gu et al. (2016) developed a
classifier based on a Semi-Na
¨
ıve Bayes (SNB) model,
to filter out ‘non-traffic-related’ tweets. Furthermore,
‘traffic-related’ tweets are analysed and further classi-
fied into ‘traffic-related’ sub-categories using a super-
vised Latent Dirichlet Allocation (sLDA) algorithm.
Schulz et al. (2013), developed classifiers to be able
to detect small-scale car accidents reported on Twit-
ter. Some of the classifiers which were developed to
detect traffic events, are based on the Na
¨
ıve Bayes Bi-
nary (NBB) model and the Support Vector Machine
(SVM). Li et al. (2012) proposed TEDAS, a system
capable of retrieving, pre-processing, classifying, and
geoparsing ‘traffic-related’ tweets to extract both the
nature of the traffic events and their associated geo-
graphic information. This system is based on a set of
rules to analyse the tweets. Similar to the works of Gu
et al. (2016); Schulz et al. (2013); Li et al. (2012), the
aim in this work is to develop a traffic-based informa-
tion system that relies on analysing the content of so-
cial media data from Twitter. An adaptive data acqui-
sition is developed differently from the other works
where a rule ‘r’ is chosen if it is found within a spe-
cific percentage of all newly and previous classified
traffic-related tweets. Furthermore, preprocessing is
carried out as shown in Table 1. Table 1 summarizes
the differences between this work and the works of
Gu et al. (2016); Schulz et al. (2013); Li et al. (2012).
Tweets are classified as either ‘traffic-related’ or
‘non-traffic-related’. Unlike the works of Gu et al.
(2016); Schulz et al. (2013); Li et al. (2012), where
only one or two classifiers were developed, in this
work, four supervised binary classification algorithms
are developed with the aim to analyse their perfor-
mance in the Results Section. Classifiers based on
the Multinomial Na
¨
ıve Bayes model (MNB), the SNB
model, the Multivariate Bernoulli Na
¨
ıve Bayes model
(MVBNB) and the SVM are developed. ‘Traffic-
related’ tweets are analysed and further classified
into ‘traffic-related’ sub-categories using a sLDA
algorithm. The sub-categories are namely: ‘ac-
cidents’, ‘incidents’, ‘traffic jams’, and ‘construc-
tion/road works’. The performance of the classifiers
of Gu et al. (2016); Schulz et al. (2013); Li et al.
(2012) are compared to the classifiers developed in
this work as detailed in Section 3. The date, time,
and the geographical information of each associated
traffic event are also determined. Hence the proposed
traffic-based information system is described in Sec-
tion 2 of the paper. Section 3 shows the results of the
proposed system, followed by conclusions and possi-
ble future works as described in Section 4.
2 METHODOLOGY
The stages involved in the developed system as shown
in Figure 1 are described in this Section. All stages
are implemented in R programming language, provid-
ing a vast number of tools for analysis and access to
many useful off-the-shelf packages (The R Founda-
tion, 2022).
Figure 1: Developed system stages.
2.1 Data Acquisition
An adaptive data acquisition approach is developed
to ensure the best quality and the maximum num-
ber of ‘traffic-related’ tweets are gathered (Gu et al.,
2016). All gathered tweets are in English. An adap-
tive ‘traffic-related’ keywords dictionary is formed to
filter the Twitter stream sessions. To extract tweets,
REST API is used (IBM Cloud Education, 2021). An
initial keyword dictionary is generated using a uni-
gram, DF (document frequency) based BOW (bag of
words) model. Based on a predefined threshold, DF-
based filtration is applied to extract the initial key-
words. To generate an adaptive data acquisition, new
‘traffic-related’ keywords are generated and appended
to the initial dictionary by repeating the same proce-
dure whilst using the streamed tweets that will now
be classified as ‘traffic-related’. As a result, the algo-
rithm is capable of expanding its initial dictionary to
adapt to the language of newly streamed tweets.
For ease of implementation, streaming sessions
are initiated through the rtweet R package. In partic-
ular, the stream tweets function provides an interface
with a large range of input arguments which makes
streaming tweets both very simplistic however, it is
limited to filtering tweets based upon only one type
of query, be it location, keywords, or user ids.
For further analysis, parsing is applied to convert
the streamed tweets, stored in a JSON file, into an R
object via the parse stream function found also in the
Traffic Data Analysis from Social Media
145

Table 1: Similarities and Differences with works by Gu et al. (2016); Schulz et al. (2013); Li et al. (2012).
This work Work by Gu et al.
(2016)
Work by Schulz
et al. (2013)
Work by Li et al.
(2012)
Data acquisi-
tion
Traffic-related key-
word and language
filtering
Keyword filtering Spatial, temporal
and language filter-
ing
Traffic-related key-
word filtering.
Adaptive data
acquisition
Yes. A rule ‘r’ is
chosen if it is found
within a specific
percentage of all
newly and previous
classified traffic-
related tweets.
Yes. Based on the
assumption that a
good rule generally
associates with
the tweets relating
to the subject at
hand. In this case,
every unigram and
bigram is extracted
as a candidate rule.
A rule ‘r’ is passed
if its confidence
passes a certain
threshold. Then,
a rule validator is
utilised in order
to examine the
usefulness of a new
rule.
No. Yes. A tokenizer
is first applied to
all ‘traffic-related’
tweets. Subse-
quently, a reducer
is applied to count
the total of positive
and negative labels
for each of the to-
ken combinations.
Those token com-
binations with the
maximum positive
counts are chosen
as new rules.
Preprocessing Removing Twitter
mentions, links,
emoticons, convert-
ing to lowercase,
removing tweet
associated words,
stop words, punc-
tuation, brackets,
resolving abbrevi-
ations, replacing
contractions, sym-
bols, removing
blank spaces, nu-
merical numbers.
No. Removing
retweets, @
mentions, stop
words, resolving
abbreviations,
application of the
Google Spellcheck-
ing API, replacing
temporal expres-
sions, replacing
spatial expressions,
application of the
Stanford lemma-
tization function,
application of the
Stanford POS
tagger in order to
extract only nouns
and proper nouns.
No.
Binary Classifi-
cation
Multinomial NB,
SNB, Bernoulli
NB, SVM
SNB MNB, Ripper rule
learner, SVM
TEDAS
Multi-class
classification
Supervised LDA
accompanied by a
multi-class SVM
Supervised LDA
accompanied by a
multi-class SNB
No. No.
Geotagging Utilising an NER
model.
Utilising the GPS
tag in a tweet, the
content of a tweet,
and predicting the
location based on
the user’s history,
friends etc.
Stanford NER
model.
Regular Expres-
sions geotagger,
and a fuzzy geotag-
ger.
VEHITS 2023 - 9th International Conference on Vehicle Technology and Intelligent Transport Systems
146
rtweet R package. Subsequently, any retweets or any
duplicate tweets that are gathered during the stream-
ing instance are deleted.
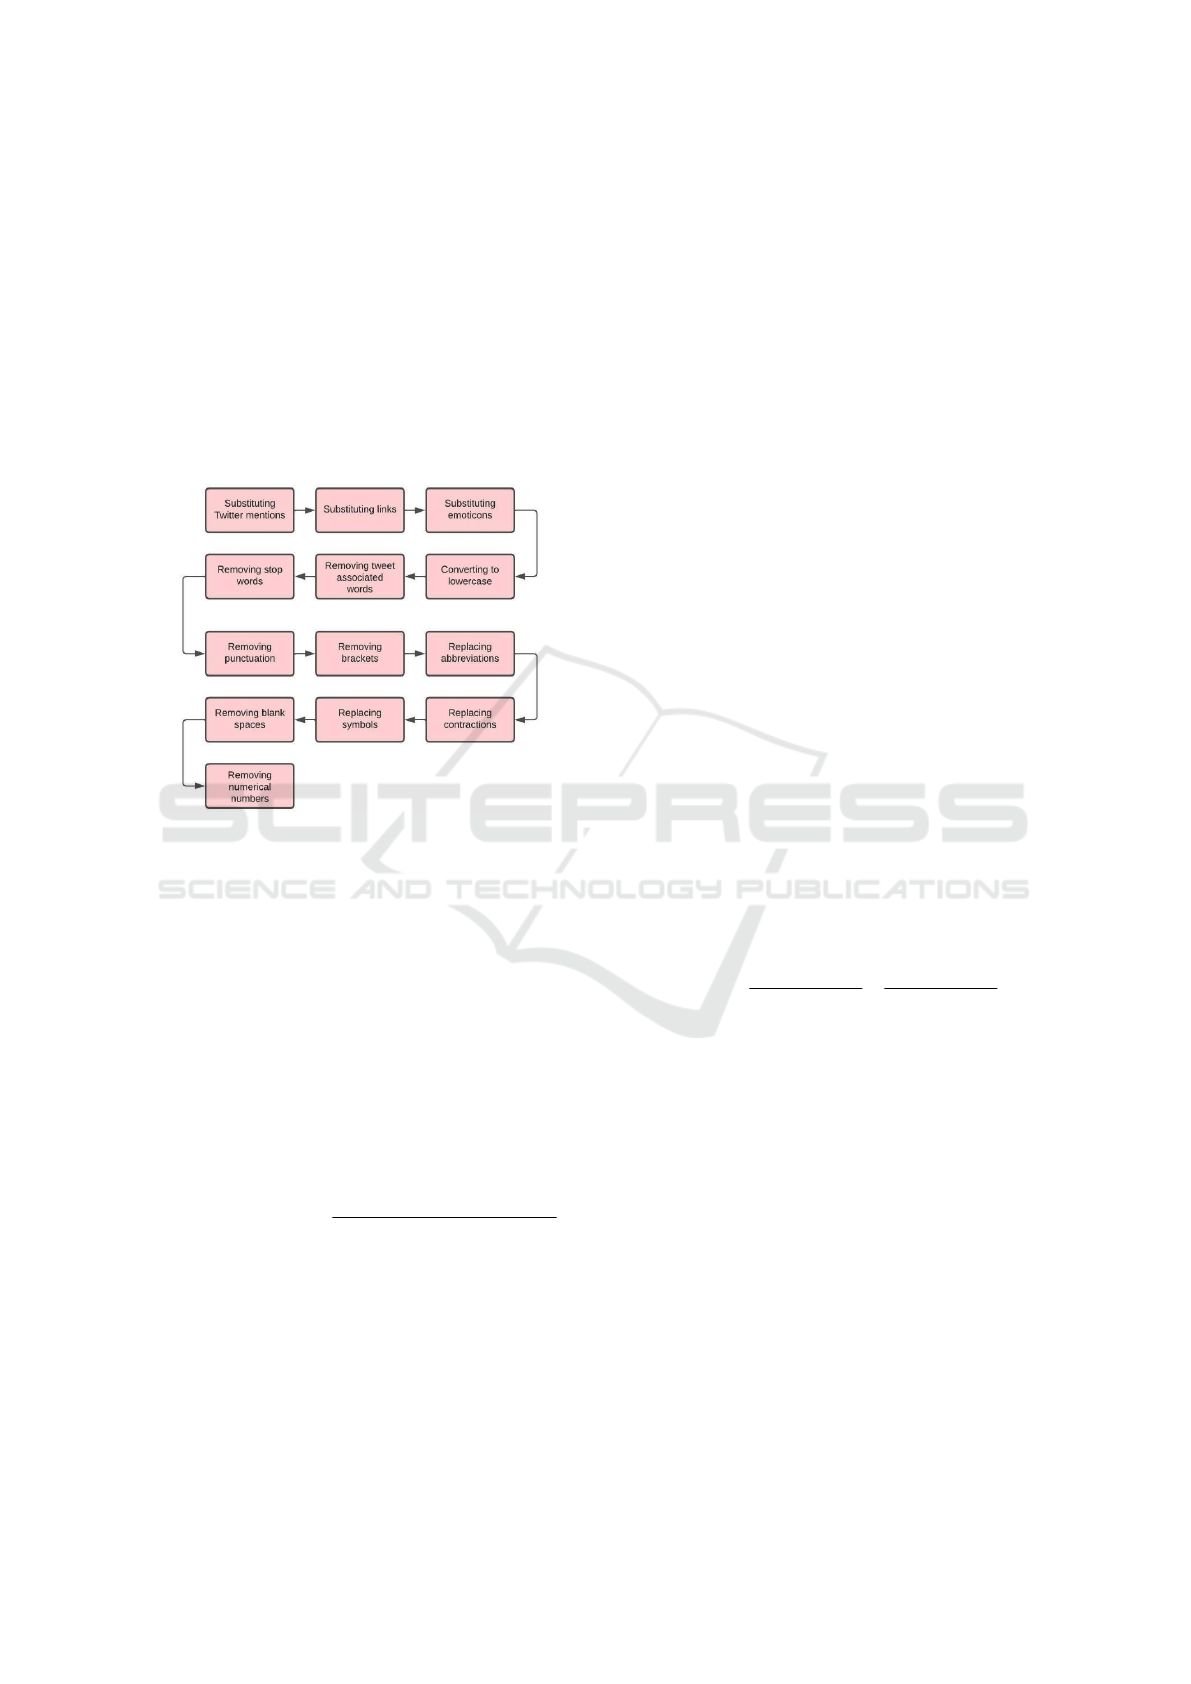
2.2 Pre-Processing
Pre-processing techniques are applied to transform
the streamed tweets into a format that eases classifica-
tion by removing redundant information, such as stop
words using the package defined in (Hornik, 2021)
and as detailed in Table 1. Figure 2 shows the pre-
processing steps carried out in this work.
Figure 2: Pre-processing stages.
2.3 Classification
The initial step of classification comprises of classi-
fying tweets as either ‘traffic-related’ or ‘non-traffic-
related’. Four binary text classifiers are developed,
namely: the MNB model, the SNB model, the
MVBNB model and the SVM. The optimal classifier
from these four is chosen.
2.3.1 NB Classifiers
The main core of all NB classifiers is Bayes’ theorem,
which is given by Equation (1)
P(class| f eatures) =
P( f eatures|class) · P(class)
P( f eatures)
(1)
where P(class| f eatures) is the posterior probabil-
ity distribution which is the the probability of a spe-
cific instance belonging to a particular class given
its observed features, P( f eatures|class) is the con-
ditional probability which is the probability of ob-
serving a set of features within a particular class and
P(class) is the prior probability which is the prob-
ability of a particular class within a given dataset,
hence depicting the likelihood of encountering a spe-
cific class.
In practice, for ease of implementation NB classi-
fiers consider two assumptions, namely:
• Independent and identically distributed: Random
variables must be unrelated to one another whilst
also being derived from a similar probability dis-
tribution (Raschka, 2014).
• Conditional independence of features: All fea-
tures in a dataset are mutually exclusive (Raschka,
2014). This assumption is what gives NB classi-
fiers their ‘na
¨
ıve’ property. As a result, the like-
lihoods or class-conditional probabilities of a par-
ticular feature set can instantly be calculated from
the given dataset with ease as shown in Equation
(2)
P( f eatures|class) =
∏
j
P( f
j
|class) (2)
where f represents the feature set given by
{ f
1
, f
2
, f
3
, ..., f
j
}
In reality, this assumption is more often than not
violated. Nonetheless, NB classifiers still tend to per-
form extremely well under this assumption (Raschka,
2014; Askari et al., 2020; Rish, 2001). However,
strong violations of this assumption and nonlinear
classification tasks tend to lead NB classifiers to per-
form very poorly (Raschka, 2014).
Considering a binary classification task, the deci-
sion rule for NB classifiers can be defined as:
class =
(
A
∏
j
P( f
j
|class
A
)·P(class
A
)
P( f eatures)
≥
∏
j
P( f
j
|class
B
)·P(class
B
)
P( f eatures)
B else
(3)
In practice, the evidence term can be neglected
since it is merely being used as a scaling factor
(Raschka, 2014). Therefore, the final decision rule
can be defined as:
class =
(
A
∏
j
P( f
j
|class
A
) · P(class
A
) ≥
∏
j
P( f
j
|class
B
) · P(class
B
)
B else
(4)
In practice, NB classifiers tend to suffer from the
problem of zero probabilities. This problem arises
whenever a specific feature ‘ f
1
’ is not available within
a particular class, thus leading to its class-conditional
probability being equal to zero. One solution is
called Additive smoothing, which is a technique that
is commonly utilised to smooth categorical data. With
Traffic Data Analysis from Social Media
147

the introduction of Additive smoothing, the class-
conditional probability for a specific feature ‘ f
1
’ can
be defined as:
P( f
1
|class) =
N
f
1
+ α
N
f
1
+ αd
(5)
where α is an additive smoothing parameter and
d gives the dimensionality of the feature set within
the class. By setting the value of the smoothing pa-
rameter bigger than zero it is guaranteed that the zero
probability problem is avoided. Generally, Lidstone
smoothing (α < 1) and Laplace smoothing (α = 1)
are the two most common additive smoothing types
(Raschka, 2014).
2.3.2 MNB Classifier
The MNB classifier defines the distribution of each
feature P( f eatures|class) as a multinomial distribu-
tion making it ideal for data that can be easily trans-
formed into numerical counts (Russell and Norvig,
1995). In general, the MNB model is used to calculate
term frequency denoted as T F. The binary decision
rule of the MNB classifier can be defined as:
class =
(
A
∏
j
P(t
j
|class
A
) · P(class
A
) ≥
∏
j
P(t
j
|class
B
) · P(class
B
)
B else
(6)
where
P(t
j
|class
A
) =
T F
t
j
,A
+ α
T F
t,A
+ αd
(7)
T F
t
j
,A
represents the frequency of term ’t
j
’ within
class A, TF
t,A
represents the total count of all the term
frequencies within class A.
2.3.3 SNB Classifier
NB classifiers tend to frequently violate the assump-
tion of conditional independence of features. With
regards to text, it assumes that a specific word has
no bearing on the likelihood of observing additional
words in the same document or sentence (Raschka,
2014). As previously underlined, strong violations of
this assumption can lead NB classifiers to perform
very poorly in practice (Raschka, 2014). A coun-
termeasure to this issue is to extend NB classifiers
in such a manner that they are capable of detecting
dependencies between features (Kononenko, 1991).
The main idea behind the SNB classifier is to relax
the conditional independence of features assumption
whilst also retaining both the simplicity and efficiency
properties of NB classifiers (Zheng and Webb, 2017).
In other words, the SNB classifier seeks to find the
optimal balance between ‘non-na
¨
ıvety’ and the accu-
racy of approximations of the conditional probabili-
ties (Zheng and Webb, 2017).
2.3.4 MVBNB Classifier
In contrast to the MNB classifier, the features in the
MVBNB model are independent binary values that
represent the document frequency denoted by DF.
The Bernoulli Trials for a specific feature set can be
defined as:
P( f eature|class) =
∏
j
P( f
j
|class)
b
· (1 − P( f
j
|class)
b
)
(1−b)
(8)
where b is a boolean term expressing the oc-
currence or absence of the term from the vocabu-
lary. Consequently, the binary decision rule of the
MVBNB classifier can be defined as:
class =
(
A
∏
j
P(t
j
|class
A
) · P(class
A
) ≥
∏
j
P(t
j
|class
B
) · P(class
B
)
B else
(9)
where
P(t
j
|class
A
) =
DF
t
j
,A
+ α
DF
t,A
+ αd
(10)
DF
t
j
,A
represents the document frequency of term t
j
within class A and DF
t
,
A
represents the total count of
all the document frequencies within class A.
2.3.5 SVM Classifier
For a given classification task, the SVM utilises the
principle of a maximum margin classifier to discrim-
inate between the data (Senekane and Taele, 2016).
In general, the margin can be defined as the distance
between the generated decision boundary and the sup-
port vectors, represented by the data points which ex-
ist closest to the decision boundary (Senekane and
Taele, 2016). For a binary, linearly separable classi-
fication task, the decision boundary is a hyperplane
given by Equation (11) and classification is based
upon the perpendicular distance of the instance to be
classified from the generated decision boundary given
by Equation (12).
y = w
t
x + b (11)
class =
(
A w
t
x + b ≥ 0
B else
(12)
where w
t
is the weight vector, x represents the in-
stance to be classified and b is the bias or a constant.
VEHITS 2023 - 9th International Conference on Vehicle Technology and Intelligent Transport Systems
148

2.3.6 Topic Modeling
The second stage of the classification is that ‘traffic-
related’ tweets are managed into various ‘traffic-
related’ sub-categories. In this work, five sub-
categories are considered, namely: ‘accident-related
information’, ‘incident-related information’, ‘traffic-
related information’, ‘construction-related informa-
tion’, and ‘NA’, to encompass any tweets which do
not fall in any of the other sub-categories. A sLDA al-
gorithm is developed, utilising the documents-topics
distributions as the feature vectors, whereby each spe-
cific tweet is represented by a unique, normalised
topic distribution.
The main idea behind sLDA is that documents
are represented as a random distribution of a pre-
defined number of latent or hidden topics, whereby
each topic is characterised by a unique distribution
of words or terms observed within the corpus (Zrigui
et al., 2012). One assumption that sLDA considers is
that each unique document within the corpus can be
represented by BOW model, or equivalently a collec-
tion of words, thus neglecting both the specific order
and the grammatical role of the words in each docu-
ment. The sLDA defines the generative process as a
joint distribution as summarised in Equation (13).
P(µ
1:K
, θ
1:D
, Z
1:D
,W
1:D
) =
K
∏
i=1
P(µ
i
, β)
D
∏
d=1
P(θ
d
, α)
N
∏
n=1
P(Z
d,n
|θ
d
)P(W
d,n
|β
1:K
, Z
d,n
)
(13)
where
• α is the document topic density;
• β is the topic word density;
• k is the specific topic;
• K represents all topics;
• µ
k
represents the words distribution of topic k;
• d is the specific document;
• D represents all documents;
• θ
d
represents topics distribution for document d;
• Z
d,n
represents the topic assignment for the ‘n
′
th
term in document d;
• W
d,n
represents the ‘n
′th
term in document d;
• N represents all terms within a particular docu-
ment;
• P(µ
i
, β) represents a dirichlet distribution;
• P(Z
d,n
, θ
d
) represents a multinomial distribution;
• P(θ
d
, α) represents a dirichlet distribution and
• P(W
d,n
|β
1:K
, Z
d,n
) represents a multinomial distri-
bution.
In practice, maximising Equation (13) proves
to be very challenging, thus it is generally opted
to maximise Equation (13) through only the words
(W
d
, n). As a result, Gibbs sampling is utilised to
successively sample for the conditional distribution
P(W
d,n
|β
1:K
, Z
d,n
).
Furthermore, lemmatization is also applied to im-
prove the interpretability of each generated sLDA
topic, as highlighted in (Russell and Norvig, 1995).
The number of features depicting each tweet is very
small relative to the number of feature vectors, thus
potentially giving rise to a nonlinear classification
task. As a result, a SVM classifier is utilised as part of
the sLDA algorithm to learn both linear and nonlinear
classification tasks.
Other pre-processing techniques capable of re-
ducing the computational overhead of the supervised
LDA algorithm are utilised, as depicted in Figure 3.
Figure 3: sLDA Pre-processing stages.
A 10-fold cross-validation technique is applied to
the training data to both train and validate all the al-
gorithms. The individual validation scores are then
averaged amongst all folds to generate an overall val-
idation score. The final evaluation is then performed
on a separate hold-out set with their results shown in
Section 3.
In general, text documents tend to have most of
their theme information stored via nouns and verbs,
thus making other words irrelevant with regards to
topic classification. Consequently, POS tagging was
performed to be able to extract only the nouns and
verbs from each specific text document. For ease
of implementation, POS tagging was performed via
a pre-trained English model found in the UDPipe R
package. To avoid overfitting, whilst also removing
frequent words that contribute very little to topic in-
terpretability, nouns and verbs which had a DF of less
than five or were observed in more than 60% of the
dataset were filtered out.
To transform the LDA algorithm into a super-
vised algorithm, words that are capable of discrimi-
nating between different topics were initially seeded
towards specific topics instead of being given ran-
Traffic Data Analysis from Social Media
149

dom topic assignments. In this work, five topics
were considered, namely: ‘accident-related informa-
tion’, ‘incident-related information’, ‘traffic-related
information’, ‘construction-related information’, and
a hidden topic to encompass any text documents
which do not fall in any of the preceding topics. To
improve the convergence rate of the supervised LDA
algorithm, the algorithm is capable of generating ex-
tra seed words that are likely to be observed with the
initial seed words. In other words, the algorithm is
capable of determining which specific words are in-
terdependent with each initial seed.
2.4 Geoparsing
Tweets are restricted in length, thus tending to omit
information about both the time and date of their as-
sociated traffic event. Consequently, the REST API is
used to determine the time and date of each extracted
traffic event. Forward geocoding is applied to trans-
form the extracted locations to their associated lati-
tude and longitude coordinates. To help in the visu-
alisation of the traffic events, a web application is de-
veloped, whereby a worldwide map depicting all the
different types of geocoded traffic events is generated.
To determine both the time and date of each ex-
tracted traffic event the created at field, obtained dur-
ing the streaming process is used. The created at field
provides both the time and date when each streamed
tweet was posted. As a result, the determination of
the time of each extracted traffic event was based
on the assumption that the traffic events occurred at
roughly the same instance as when their associated
tweets were posted.
To extract the location of each traffic event, NER
is applied to label location entities. For ease of imple-
mentation, NER is applied through the location entity
function found in the entity R package. Following
location extraction, forward geocoding is applied to
transform the extracted locations to their associated
coordinates in terms of longitude and latitude. For-
ward geocoding is applied through the geocode func-
tion found in the tidygeocoder R package. On the
occurrence that either no location or more than one
location is extracted for a specific traffic event, or the
utilised geocoding service is not capable to transform
a specific location to its associated coordinates, the
location and its respective coordinates are assigned
‘NA’ respectively.
3 RESULTS
The four binary text classifiers were trained, vali-
dated, and tested on an annotated dataset (Dabiri,
2018) containing a total of 48,000 tweets with 50.03%
of the tweets being traffic related. A train-test split ra-
tio of 10 to 2 is applied to the dataset. Each of the
text classifiers were evaluated using a 10-fold cross-
validation technique, and a separate hold-out set was
then utilised to generate benchmark performance met-
rics. The generated performance metrics of all the
tuned classifiers were then compared and analysed to
determine the optimal classifier for the classification
task at hand.
Figure 4 shows the performance of the four binary
text classifiers, corresponding to an F1 score ranging
between 0.978 and 0.983. The performance of these
classifiers can be compared to those in the works of
Gu et al. (2016); Schulz et al. (2013); Li et al. (2012).
Gu et al. (2016) obtained an F1 score of 0.926 by the
SNB classifier. Schulz et al. (2013) obtained an F1
score ranging between 0.555 and 0.607 for the MNB,
Ripper rule learner and SVM. Gu et al. (2016) ob-
tained an F1 score of 0.80 for TEDAS. In all cases, the
performance of the four classifiers in this work out-
performed the results obtained in the former works.
Tukey’s Honestly-Significant Difference results
indicate that there exists a significant pairwise differ-
ences between the F1 scores of the tuned SVM clas-
sifier and the F1 scores of all other tuned classifiers
with 95% confidence level. Consequently, the tuned
SVM classifier was the optimum classifier.
Table 2 presents the performance of the sLDA al-
gorithm during training and testing stages with sepa-
rate hold-out sets. This resulted in average weighted
F1 score of 0.988, weighted over all hold-out-sets,
thus quantifying the promising classification results
for sLDA.
Figure 4: Performance Metrics of all four classifiers.
To ease the results visualisation whilst also pro-
viding the user some direct control of the system, a
web application was developed. The web applica-
VEHITS 2023 - 9th International Conference on Vehicle Technology and Intelligent Transport Systems
150

Table 2: Weighted F1 score for sLDA algorithm.
Training (10 fold average) 0.985
1st hold-out-set for Testing 0.988
2nd hold-out-set for Testing 0.985
3rd hold-out-set for Testing 0.987
4th hold-out-set for Testing 0.991
tion consisted of a simple GUI, whereby the user is
given direct control of both the streaming time and
the number of iterations to be executed by the system.
A worldwide map depicting all the geocoded traffic
events is generated, as shown in Figure 5, with blue
implying an accident; red implying an incident; green
implying traffic and black implying road works.
Figure 5: Generated worldwide map.
4 CONCLUSION
This work proposes a traffic-based information sys-
tem that relies on social media data. Tweets are clas-
sified as either ‘traffic-related’ or ‘non-traffic-related’
using four binary text classifiers: the MNB model, the
SNB model, the MVBNB model and the SVM. The
SVM classifier resulted in the optimum classifier with
an F1 Score of 0.983. ‘Traffic-related’ events are fur-
ther classified into various ‘traffic-related’ categories,
such as ‘accidents’, ‘traffic jams’, and ‘road works’
using a sLDA algortihm, resulting in a weighted F1
score of 0.988. A fully functional web application,
capable of automating the whole procedure is devel-
oped. Future work aims to address the number of top-
ics of the sLDA algorithm. The algorithm requires the
number of topics to be known a priori which is not al-
ways possible. More seed words can be defined for
each topic category such that each generated sLDA
topic can be easily discriminated from other topics. A
hierarchical Dirichlet process could also be utilised,
whereby the number of topics is learnt automatically
from the dataset. Social media tends to provide ac-
cess to an endless amount of information about a vast
range of topics and can be scaled up to detect large-
scale events such as the covid pandemic.
REFERENCES
Askari, A., d’Aspremont, A., and Ghaoui, L. E. (2020).
Naive Feature Selection: Sparsity in Naive Bayes.
ArXiv, abs/1905.09884.
Dabiri, S. (2018). Tweets with traffic-related labels for
developing a Twitter-based traffic information sys-
tem. Mendeley Data, V1, Available online at:
10.17632/c3xvj5snvv.1 [Last accessed 30/06/2022].
Gu, Y., Qian, Z., and Chen, F. (2016). From Twitter to de-
tector: Real-time traffic incident detection using social
media data. Transportation Research Part C: Emerg-
ing Technologies, 67, 321-342.
Hornik, K. (2021). Stopwords . Available online at:
https://rdrr.io/rforge/tm/man/stopwords.html [Last ac-
cessed 30/06/2022].
IBM Cloud Education (2021). rest-apis. Available online
at: https://www.ibm.com/cloud/learn/rest-apis [Last
accessed 30/06/2022].
Kononenko, I. (1991). Semi-Naive Bayesian Classifier.
Proceedings of the 5th European Conference on Eu-
ropean Working Session on Learning.
Li, R., Lei, K., Khadiwala, R., and Chang, K. (2012).
”TEDAS: A Twitter-based Event Detection and Anal-
ysis System”. IEEE 28th International Conference on
Data Engineering.
Raschka, S. (2014). Naive Bayes and Text Classification I -
Introduction and Theory corr, τ. abs/1410.5329, 2014.
CoRR, τ. abs/1410.5329.
Rish, I. (2001). An empirical study of the naive Bayes
classifier. Available online at: https://citeseerx.ist.psu.
edu/viewdoc/summary?doi=10.1.1.330.2788 [Last
accessed 30/06/2022].
Russell, S. and Norvig, P. (1995). Artificial intelligence.
Englewood Cliffs, N.J.: Prentice Hall.
Schulz, A., Ristoski, P., and Paulheim, H. (2013). ”I See
a Car Crash: Real-Time Detection of Small Scale In-
cidents in Microblogs” . The Semantic Web: ESWC
2013 Satellite Events, 22-33.
Senekane, M. and Taele, B. (2016). Prediction of Solar
Irradiation Using Quantum Support Vector Machine
Learning Algorithm. Smart Grid and Renewable En-
ergy, 07:12, 293-301.
The R Foundation (2022). R: The R Project for Statisti-
cal Computing. Available online at: https://www.r-
project.org/ [Last accessed 30/06/2022].
Zheng, F. and Webb, G. (2017). Semi-naive Bayesian
Learning. Encyclopedia of Machine Learning and
Data Mining, 1137-1142.
Zrigui, M., Ayadi, R., Mars, M., and Maraoui, M. (2012).
Arabic Text Classification Framework Based on La-
tent Dirichlet Allocation. Journal of Computing and
Information Technology, 20:2.
Traffic Data Analysis from Social Media
151
