
Spatio-Temporal Modelling of Relationship Between Organic Carbon
Content and Land Use Using Deep Learning Approach and Several
Co-Variables: Application to the Soils of the Beni Mellal in Morocco
Sébastien Gadal
1,3 a
, Mounir Oukhattar
1b
, Catherine Keller
2c
and Ismaguil Hanadé Houmma
1,4 d
1
Aix-Marseille University, CNRS, ESPACE UMR 7300, Univ. Nice Sophia Antipolis, Avignon University, France
2
Aix-Marseille Univ., CNRS, IRD, Coll de France, INRAE, CEREGE, Technopole de l’Environnement Arbois-Méditerranée,
BP80, 13 545 Aix-en-Provence, Cedex 4, France
3
Department of Ecology and Geography, Institute of Environment, North-Eastern Federal University,
Republic of Sakha Yakutia, Russia
4
Hassan II Institute of Agronomy and Veterinary, Department of Geodesy and Topography,
Geomatics Science and Engineering, Morocco
ismaguil.hanade-houmma@etu.univ-amu.fr
Keywords: SOCS, LULC Change, Remote Sensing, Soil Analysis, Spatial Distribution, Machine Learning Classification,
Deep Learning Modelling.
Abstract: In recent decades, population growth has led to rapid urbanisation associated with a land degradation process
that threatens soil organic carbon stocks (SOCS). This paper aims to model the interrelationships between
SOCS and land use/land cover (LULC). The approach was based on the use of environmental covariates
derived from Landsat-5 TM/8 OLI images, forty soil samples, Kriging spatial interpolation method and a
Multi-layer Perceptron (MLP) model for the geo-spatialisation of SOCS. The analysis shows a high positive
autocorrelations (R
2
>0.75) between vegetation indices and SOCS, particularly higher for SOCS derived from
spatial modelling with MLP. On the other hand, the relationship between LULC and SOCS from the three
approaches is very variable depending on the dynamics of LULC. The autocorrelations between SOCS and
LULC units are very weak in 1985 and 2000 but significant for the year 2018. This suggests that the land use
dynamics in the area are favourable to SOCS. In general, the results show that SOCS increased in the tree
crop, unused land and forest areas but decreased in the cropland. The SOCS varied in the following order:
forest cover>unused land>cropland>urban area>tree crops. This indicates that LULC, topography and
vegetation types had an impact on SOCS distribution characteristics.
1 INTRODUCTION
As the living foundation of agricultural and forestry
production, soil is a finite and non-renewable
resource on a human lifetime scale. It is subject to
several increasing pressures that lead to tensions
between land uses (Lal et al. 2007). Changes in
agricultural production methods, the reversal of
grasslands, the loss of arable or wooded land to
urbanisation, the increase in biomass extraction, etc.,
are all developments which, if not properly
considered, could affect the quality of soils, and
a
https://orcid.org/0000-0002-6472-9955
b
https://orcid.org/0000-0002-3214-9366
c
https://orcid.org/0000-0001-8455-2926
d
https://orcid.org/0000-0001-7838-6597
dissipate the carbon stocks they contain. Soil is a
complex system that plays a central role in
agricultural and forest ecosystems by regulating
various natural cycles such as those of greenhouse
gases. Through its agri-environmental functions, soil
is both a storage site and a sink for organic carbon and
is also a source of carbon dioxide (CO
2
) emissions to
the atmosphere, a high greenhouse gas, which has an
influence on climate change (Bernoux et al. 2001,
Hutchinson et al. 2007, Lal et al. 2007).
Soils are the largest terrestrial reservoirs of
organic carbon (Yang et al. 2016). They contain about
Gadal, S., Oukhattar, M., Keller, C. and Houmma, I.
Spatio-Temporal Modelling of Relationship Between Organic Carbon Content and Land Use Using Deep Learning Approach and Several Co-Variables: Application to the Soils of the Beni
Mellal in Morocco.
DOI: 10.5220/0011723000003473
In Proceedings of the 9th International Conference on Geographical Information Systems Theory, Applications and Management (GISTAM 2023), pages 15-26
ISBN: 978-989-758-649-1; ISSN: 2184-500X
Copyright
c
2023 by SCITEPRESS – Science and Technology Publications, Lda. Under CC license (CC BY-NC-ND 4.0)
15

twice as much carbon as the atmosphere and are
therefore a major compartment in the global carbon
cycle (Xiong et al. 2014). Any change, positive or
negative, in soil organic carbon stocks can represent
a sink or source of atmospheric CO
2
(Yang et al.
2018). These stocks can be strongly modified by
changes in practices or uses. They are also highly
dependent on climate. Changes in land use within the
agricultural sector (e.g., grassland turnover) and
between agricultural and non-agricultural uses
(afforestation, deforestation, urbanisation) impact
soil carbon stocks and aboveground biomass.
Urbanisation at the expense of generally agricultural
land or natural areas contributes to the net greenhouse
gas (GHG) emissions balance. Some previous studies
that examined the effect of LULC on SOCS found
that increasing urbanisation could lead to a loss of
SOC due to artificialisation making soils non-
permeable (Beesley 2012, Wei et al. 2014); while
others research found that some urban soils had
higher SOC contents than agricultural, grassland and
forest soils (Golubiewski 2006, Raciti et al. 2011).
Previous studies on the study area are few and have
focused particularly on climate change, ecosystem
degradation, water stress, and changes in LULC at
different times (Ait Ouhamchich et al. 2018, El
Jazouli et al. 2018, Barakat et al. 2019, Baki et al.
2021). However, no study has addressed the spatio-
temporal modelling of SOCS in relationship to LULC
change and environmental covariates. Such studies
are needed, given the extent of land use change in the
study area.
Remote sensing and spatial modelling based on
deep learning and machine learning are techniques
that have been more widely used in recent decades to
quantify the spatio-temporal distribution of
environmental variables such as LULC dynamics and
soil organic carbon stocks (Bae et al. 2015, Shifaw,
2018, Yang et al. 2018, Obeidat et al. 2019, Fathizad
et al. 2022). Many studies have deployed remote
sensing techniques and spatial modelling to
specifically assess LULC change and its potential
impacts on soil organic carbon sequestration (Yan et
al. 2015, Taghizadeh-Mehrjardi et al. 2017, Yang et
al. 2018). They were able to show the important role
of spatial remote sensing in modelling past and
current growth knowledge to predict the future
(Nurmiaty et al. 2014, Huong and Phuong, 2018).
Thus, some artificial intelligence models have been
used to try to predict LULC and SOCS
transformations and their potential environmental
effects. Baker (1989) and Muller and Middleton
(1994) have abbreviated the most used models to
assess LULC dynamics. Markov chain analysis and
Multi-layer Perceptron (MLP) are easy-to-use
artificial intelligence approaches to predict the spatial
characteristics of LULC and SOCS based on current
conditions (Sharjeel et al. 2016, Hazhir et al. 2018,
Emadi et al. 2020, Kılıc et al. 2022). Furthermore,
since these approaches offer the possibility to study
historical changes, we adopted them to estimate and
predict the rate of change of LULC types and the
spatial distribution of SOCS in our study area
between 1985 and 2050. Soil analyses were carried
out to characterise soil physical parameters, including
texture, density, and soil organic carbon content,
while remote sensing and spatial modelling were used
to estimate LULC changes and the spatial distribution
of SOCS.
In the USA, Pouyat et al (2006) compared the
variability of soil organic carbon stocks in six
different cities and found that urban soils had the
potential to sequester large amounts of atmospheric
CO
2
. Urban greenspaces contained higher SOC
stocks than native grasslands, agricultural areas or
forests in Colorado, USA (Golubiewski, 2006).
Hutyra et al (2011) reported that above-ground
carbon stocks in Seattle's urban forests were
comparable to those in the Amazon rainforest. Kaye,
McCulley and Burke (2005) measured aboveground
net primary productivity in urban lawns and found it
to be four to five times higher than in surrounding
farmland and grasslands. In addition, Mestdagh et al
(2005) found that the SOC stock of roads, waterways
and grassy railways in urban areas accounted for 15%
of the total SOC stock in a city. Soils under
impervious surfaces in urban areas provided another
often-overlooked source of SOC (Raciti et al. 2012,
Edmonds et al. 2014).
In 2008, Morocco adopted the "Green Morocco
Plan" as its agricultural and rural development
strategy, which aims to promote Moroccan
agriculture as a driver of economic and social
development, while seeking to remove some of the
many constraints on the sustainability of this
development (Ministry of Agriculture 2008). The
main objectives consist first in removing the
constraint of spatial disparities, which are still
significant and may even increase, due to unequal
access to the means of agrarian development. The
challenge of spatial planning and agricultural
territorialisation, through development adapted to the
conditions of each region by strengthening the assets
of the various rural territories and correcting their
weaknesses, can make it possible to respond. Among
these weaknesses is the vulnerability of the land,
which a policy of sustainable management and
conservation can help to overcome. Secondly, the
GISTAM 2023 - 9th International Conference on Geographical Information Systems Theory, Applications and Management
16
objectives of the 'Green Morocco Plan' aim to remove
the constraint of the complex land tenure status of
Moroccan lands, which is responsible for several
forms of degradation, especially in state-owned lands
and those with community status. This reform of the
land tenure system aims to empower local actors in
the conservation and rational management of natural
resources (Ministry of Agriculture 2008).
The objective of this study is to assess the effect
of LULC change on SOCS in the different classes
(tree crops, cropland, urban area, unused land, and
forest cover) while using LULC change monitoring
which is important, especially when it results in
inefficient and rapid urbanisation policy, unregulated,
often uncontrolled urbanisation, often associated with
threats to the SOCS. Rapid urbanisation, i.e., the
growth of cities and infrastructure, extends to the
surrounding land, which is usually natural areas, and
this is usually associated with land and soil
degradation. Land degradation is implicated in
several major environmental problems such as soil
erosion, landslides, biodiversity loss, increased
atmospheric CO
2
concentration, desertification, and
groundwater pollution (Townshend et al. 2012).
Therefore, studies on LULC changes and their
impacts on soil organic carbon stock are needed to
achieve environmental sustainability. Spatial and
temporal analysis of LULC trends and the
relationships between the factors that lead to these
variations would allow for better land use
management. The main stages of this study are (1)
mapping LULC in 1984, 2000 and 2018, (2)
predicting LULC in 2018, 2030 and 2050, (3) soil
sampling in the different LULC types to measure
SOCS and soil texture, (4) spatial distribution of
SOCS as a function of environmental covariates and
(5) spatial autocorrelations between SOCS and
environmental covariates.
2 MATERIALS AND METHODS
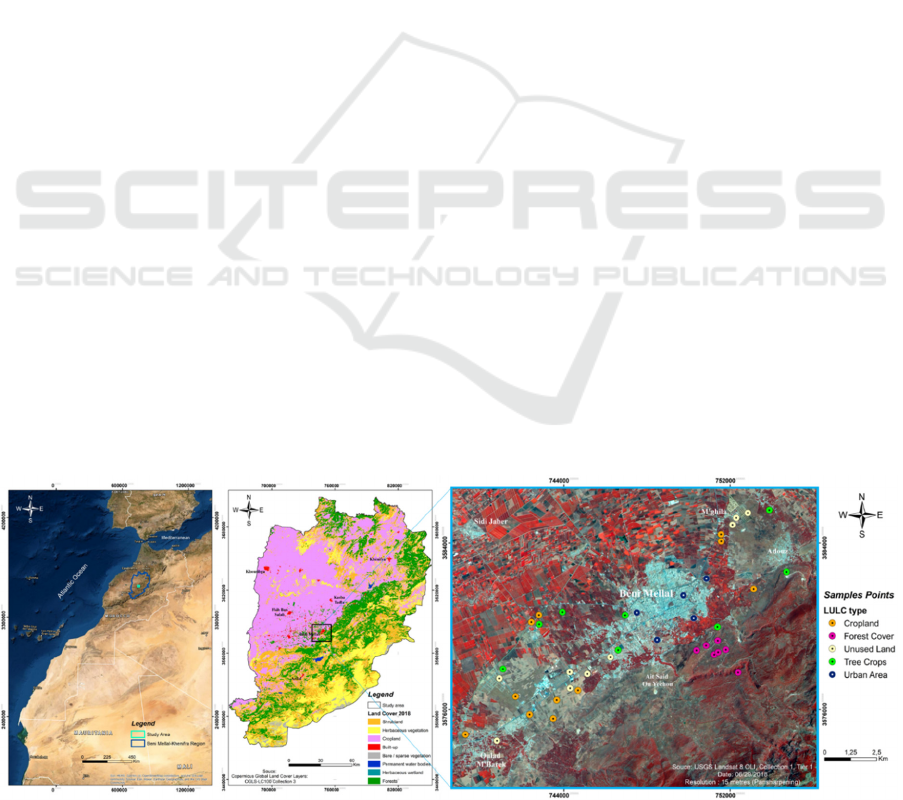
2.1 Study Area
The study area is in the Beni Mellal-Khenifra region
of Morocco. It covers an area of 252,5 km
2
and a
perimeter of 63,9 km
2
, located at the junction of the
High Atlas of Beni Mellal and Tadla plains (Figure
1). The altitude varies from 439 m in the northwest to
1709 m in the southeast of the study area.
Administratively, it covers the municipalities of Sidi
Jaber, Ouled M'barek, Adouz and Beni Mellal. The
region has significant water resources from the Atlas
Mountains. It also contains a large amount of fertile
land (Ennaji et al. 2018, Barakat et al. 2019), making
it a region with high agricultural production.
Agriculture and livestock are the main sectors of
economic activity and income. Olive and citrus are
the main tree crops in the region. The climate of the
Beni Mellal region is characteristic of a continental
climate, with an average annual rainfall in this region
of about 350-650 mm, of which almost 87% is
received from October to March. In summer, Beni
Mellal receives less rainfall than in winter. The
average annual temperature is 14,17°C, with an
average minimum temperature of 1,1°C observed in
January and an average maximum temperature of
30°C in July and August. The average annual
precipitation varies between 350-650 mm, of which
about 87% is received from October to March.
The soils in the study area belong, in order of
importance, to the following groups: Isohumous,
brown subtropical or chestnut soils are by far the most
widespread (Aghzar et al. 2002). They are found in
the Tadla plain and cover nearly 83% of the irrigated
area. These soils have a clayey or balanced texture
and are favourable to agricultural development under
irrigation. Brown calcimagnesic calcareous soils are
Figure 1: Location of the study area and soil sampling points.
Spatio-Temporal Modelling of Relationship Between Organic Carbon Content and Land Use Using Deep Learning Approach and Several
Co-Variables: Application to the Soils of the Beni Mellal in Morocco
17

shallow, very calcareous, and stony soils, but with a
balanced texture. They are found along the wadis.
These soils occupy 11% of the soil cover of the Tadla
perimeter. The validation points presented in Figure
1 are mainly used to validate the LULC maps, and at
the same time in each validation point, soil samples
were taken to determine the soil organic carbon stock
and texture of each LULC type.
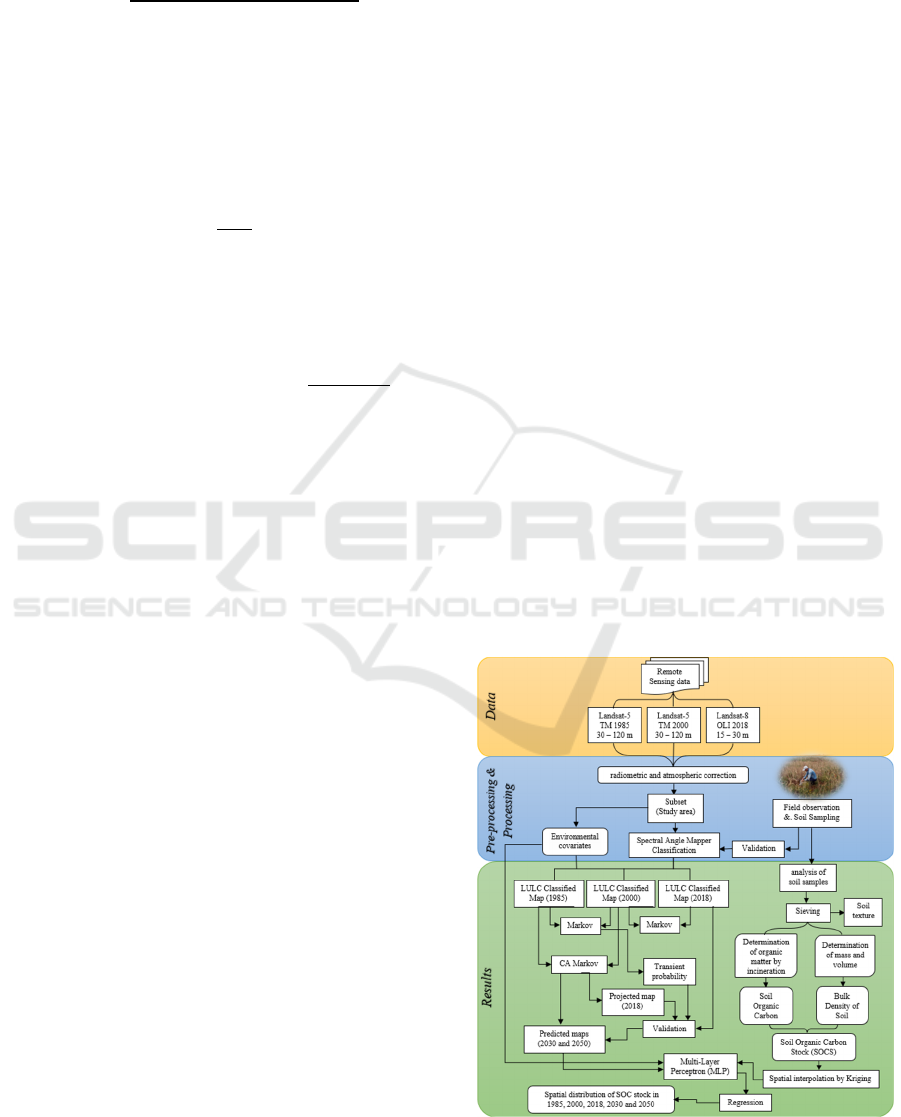
2.2 Data and Methods
2.2.1 Data, Pre-Processing and Validation
In this study, the LULC maps from 1985, 2000 and
2018 were mapped using Landsat 5 TM (Thematic
Mapper) and Landsat 8 OLI (Operational Land
Imager) satellite images (earthexplorer.usgs.gov).
The images have a ground resolution of 30 m, except
for the IR (infrared) thermal band (band 6) having a
resolution of 120 m for Landsat 5 TM images, and
the panchromatic band (band 8) having a resolution
of 15 m for Landsat 8 OLI images. All spatial data
were defined on the same coordinate system,
WGS_1984_UTM_Zone_29 N. All satellite images
were taken during the dry season (4 July 1985, 13
July 2000, and 29 June 2018) to minimise errors
caused by seasonal variations and seasonal effects of
crops. The digital terrain model (ASTER GDEM)
was taken on 23 September 2014 with a spatial
resolution of 30 m (earthexplorer.usgs.gov). The
selected temporal images were subjected to
radiometric calibration (RC) and dark object
subtraction (DOS) corrections. The raster images of
the study area were subdivided according to a
rectangular polygon created that covers the selected
study area. Then, each raster image was classified to
obtain the LULC maps. Field data and the Google
Earth platform were used to identify the LULC
classes, i.e., urban areas, forest cover, unused land,
cropland and tree crops. The supervised classification
method Spectral Angle Mapper (SAM) was used to
obtain a broad level of classification, to derive all
predefined LULC classes. The accuracy of the
generated maps (1985, 2000 and 2018) was achieved
for each land cover based on field observations and
using 2018 "natural" colour RGB composition
images from the WORLDVIEW-3 satellite with a
resolution of 30 cm by viewing on the Google Earth
platform. The Markov chain model was used to
validate the detected changes and predict future
LULC maps for 2018, 2030 and 2050. In the present
study, the Markov transition matrix was applied to
predict the 2018 LULC using the 1985 and 2000
LULC maps, and the 2000 and 2018 LULC maps
were used to determine the LULC transition matrix
for 2030 and 2050. For the model of validation, the
simulated CA-Markov 2018 LULC was compared to
the actual 2018 LULC map by image analysis.
2.2.2 Spectral Angle Mapper (SAM)
The SAM method is a supervised classification
approach based on the measurement of the angular
similarity between the spectrum of each pixel in the
image and reference spectra, called endmembers
(Hunter and Power, 2002). The latter can be
measured directly in the field using a
spectroradiometer, as well as extracted from the
image. The assignment of an image pixel to a given
class is based on the value of this angle "α" which
measures the similarity or difference between the
reference spectrum vector and its image counterpart
(Girouard et al. 2004). Thus, the pixel will be
assigned to the spectral class with which it has the
most similarity, i.e., the smaller the angle "α", the
greater the similarity between the spectrum of the
evaluated pixel and the reference (Kruse et al. 1993).
In our case, the prototype spectral signatures used to
run the SAM were extracted from the image. They
represent 5 severity classes (tree crops, cropland,
unused land, urban areas, and forest cover). In this
study, after visually testing and comparing the LULC
results of six supervised classification algorithms
(Support Vector Machine, Spectral Angle Mapper,
Parallelepiped, Minimum Distance, Maximum
Likelihood and Mahalanobis Distance), the SAM
algorithm gave the best supervised classification
result. The SAM algorithm was used to classify the
five dominant LULC classes in the study area.
2.2.3 Soil Sampling and Analysis
The soil sampling sites were located by their GPS
Coordinates and selected according to the LULC
classes using the generated LULC map of 2018
(Figure 1). A total of 40 sites (8 points in tree crops
class, 11 in cropland class, 9 in unused land class, 5
in urban areas and 7 in forest cover class) were
sampled on 26/04/2019 and 03/05/2019 at a depth of
(0- 15cm) in the absence of means to sample the
entire soil profile. Each soil sampling site consisted
of 3 intact soil cores using a metal cylinder 15cm high
and 9cm in diameter for subsequent calculation of
soil bulk density from the volume of the cylinder. All
samples were dried in an oven at a temperature of
40°C for 2 days to a constant weight. The dry soil was
sieved to 2 mm to separate pebbles >2 mm. Then the
volume of the pebbles was measured to calculate the
bulk density (BD). The fraction < 2mm was
GISTAM 2023 - 9th International Conference on Geographical Information Systems Theory, Applications and Management
18
recovered and then crushed with an agate mortar to
obtain a finer, homogeneous fraction that will be
analysed for organic carbon content and soil texture.
BD
(1)
Soil organic carbon (SOC) content was
determined using soil organic matter (SOM) which
was determined by the incineration method (loss on
ignition or loss on fire). Loss on ignition is a direct
measure of organic matter in the soil. The samples
are placed in a muffle furnace at 540 °C for 4 hours.
The loss by weight, after calcination, gives us the soil
organic matter (SOM).
SOC
.
(2)
Where SOC: Soil organic carbon in % and SOM: Soil
organic matter in %. After determining the soil
organic carbon content, soil bulk density and volume
of pebbles in the samples, we calculated the soil
organic carbon stock using the following equation:
SOCS SOC BD ST
(3)
Where SOC is the organic carbon content, BD is the
bulk density and ST is the sampled thickness (15 cm).
The SOC stocks for each LULC class in the study
area were summarised according to the following
equation:
Total SOCS SOC stock Si
(4)
Where Si is the area of the LULC type (in km
2
).
Soil texture was determined by particle size analysis,
which consists of separating the mineral part of the
soil into categories classified according to the size of
the mineral particles smaller than 2 mm and
determining the relative proportions of these
categories (sand, silt, clay), as a percentage of the
total mineral soil mass. Textural classes were
determined according to the USDA (United States
Department of Agriculture) classification scheme
(Garcia-Gaines,
and Frankenstein, 2015).
2.2.4 Spatial Distribution of Soil Organic
Carbon Stock
Satellite images obtained by Landsat 5 TM in 1985
and 2000, Landsat 8 OLI in 2018 were used to map
the LULC, calculate vegetation indices and other
remote sensing indices. After pre-processing the
satellite images (part 2.2.1 radiometric and
atmospheric corrections), a total of 4 vegetation
indices were calculated. These indices include
Normalized Difference Vegetation Index (NDVI),
Soil Adjusted Vegetation Index (SAVI), Ratio
Vegetation Index (RVI), Enhanced vegetation index
(EVI), Principal Component Analyses (PCA) and
Minimum Noise Fraction (MNF) of spectral bands.
As well as a digital elevation model (DEM) was used
as a topography variable in the study area. In this
study, a deep learning Multi-Layer Perceptron (MLP)
model was fitted using 2018 data. To estimate
historical and future changes in SOCS, the MLP
model was applied to remote sensing data collected
for the periods 1985, 2000 and 2018, as well as field
data. MLP is the most important and commonly used
artificial neural network (ANN) structure. It is a non-
parametric estimator that can be used for SOCS
regression (Taghizadeh-Mehrjardi et al. 2017). The
basic processing elements in MLP are highly
interconnected neurons. The neurons are organised in
layers: an input layer, one or more hidden layers and
an output layer. Data is fed into the network by the
input layer, which sends this information to the
hidden layers. The data is processed by the hidden
layers and the output layer. MLP derives its capability
from the non-linear processing in the hidden layers
(Emamgholizadeh et al. 2018). In this study, the MLP
model was developed to estimate SOCS by regression
to a depth of 15cm using environmental covariates
and measured SOCS data from the 40 sampled and
analysed sites. The environmental covariates and
colour compositions images (red-green-blue RGB
and near-infrared-green-blue NirGB) were integrated
into the MLP model as images of the independent
variables, while the SOCS measurements were
integrated as the dependent image after their spatial
interpolation by the Kriging method.
Figure 2: Flow chart of the working methodology.
Spatio-Temporal Modelling of Relationship Between Organic Carbon Content and Land Use Using Deep Learning Approach and Several
Co-Variables: Application to the Soils of the Beni Mellal in Morocco
19
3 RESULTS AND DISCUSSION
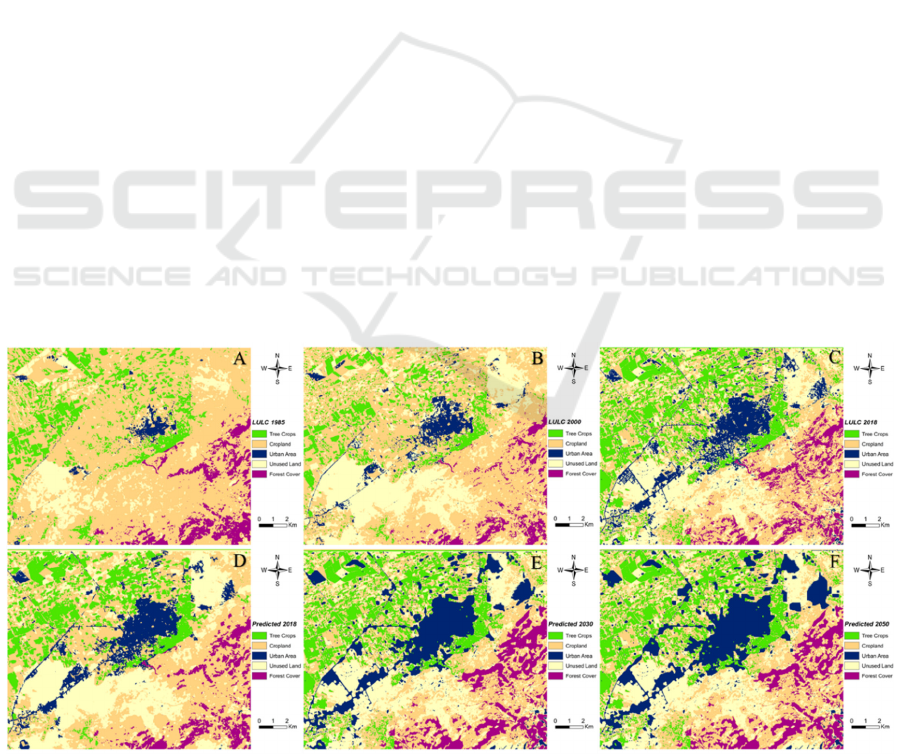
3.1 LULC Change Analysis
The LULC maps (1985, 2000, 2018) obtained by the
SAM supervised classification method of Landsat 5
TM and Landsat 8 OLI data are presented in Figure
3, along with their projections to 2018, 2030, and
2050 obtained by the CA-Markov geosimulation
model. These mapping results show current and
future changes in five dominant LULC classes in the
study area. These mapped LULC classes include five
LULC types: Unused Land (Ivory colour), Forest
Land (Purple colour), Urban Area (Midnight Blue
colour), Cropland (Beige colour), and Tree Crops
(Green colour).
Statistical analyses of the LULC maps (Table 1
and Figure 3) revealed that tree crops have increased
significantly in the study area. They have evolved
from 11,6% (29,3 km
2
) in 1985 to 18% (45,5 km
2
) in
2018 with a positive rate of change of 55,3%.
According to the projection in 2050, tree crops would
be 18,2% (46 km
2
) with a rate of change of 1,1%
between 2018 and 2050. This transition is linked to
the Moroccan Ministry of Agriculture's tree sector
support program (Green Morocco Plan), which aims
to remove the constraint of the complex land tenure
status of Moroccan lands, responsible for several
forms of degradation, particularly in state lands and
those with community status. This reform of the land
tenure system aims to empower local actors in the
conservation and rational management of natural
resources.
On the other hand, the statistics provided in Table
1 show both regressive and progressive changes in the
LULC natural units in the study area. We can see a
slight increase in forest cover from 6,4% (16,2 km
2
)
in 1985 to 6,8% (17,1 km
2
) in 2018. The cropland has
decreased remarkably, from 68,9% (173,7 km
2
) in
1985 to 37,6% (95 km
2
) in 2018. Based on this
regressive trend, cropland in the study area could
decrease to 33,9% (85,5 km
2
) in 2050 with a negative
rate of change of -10% between 2018 and 2050
according to CA-Markov based projections.
Comparing the area gains and losses between
cropland and each of the other LULC classes over this
period, the most significant conversion of cropland
was to urban areas and unused land. This main
conversion of cropland contributing to the decline of
fertile soils in the study area could be explained by
the rapid increase in urbanisation and drought. A true
conversion of cropland to urban areas around the city
of Beni Mellal was also observed between 1985 and
2018, which would be due to urban and suburban
growth and expansion. Urban areas increased from
1,8% (4,5 km
2
) in 1985 to 10,7% (27,1 km
2
) in 2018
with a positive change rate of 502,2%. Simulations
based on CA-Markov show that urban areas would
reach 16,3% (41,1 km
2
) with a rate of change of
51,7% between 2018 and 2050. This increase in urban
areas during the study period (1985-2018) is related
to the conversion of a portion of cropland into built-
up areas due to urban sprawl and expansion of
economic development activities. At the same time,
unused land increased from 11,3% (28,5 km
2
) in 1985
to 26,9% (67,8 km
2
) in 2018 with a positive rate of
Figure 3: Observed LULC maps for: (A) 1985, (B) 2000, (C) 2018 real (D) 2018 predicted, (E) 2030 predicted and (F) 2050
predicted.
GISTAM 2023 - 9th International Conference on Geographical Information Systems Theory, Applications and Management
20
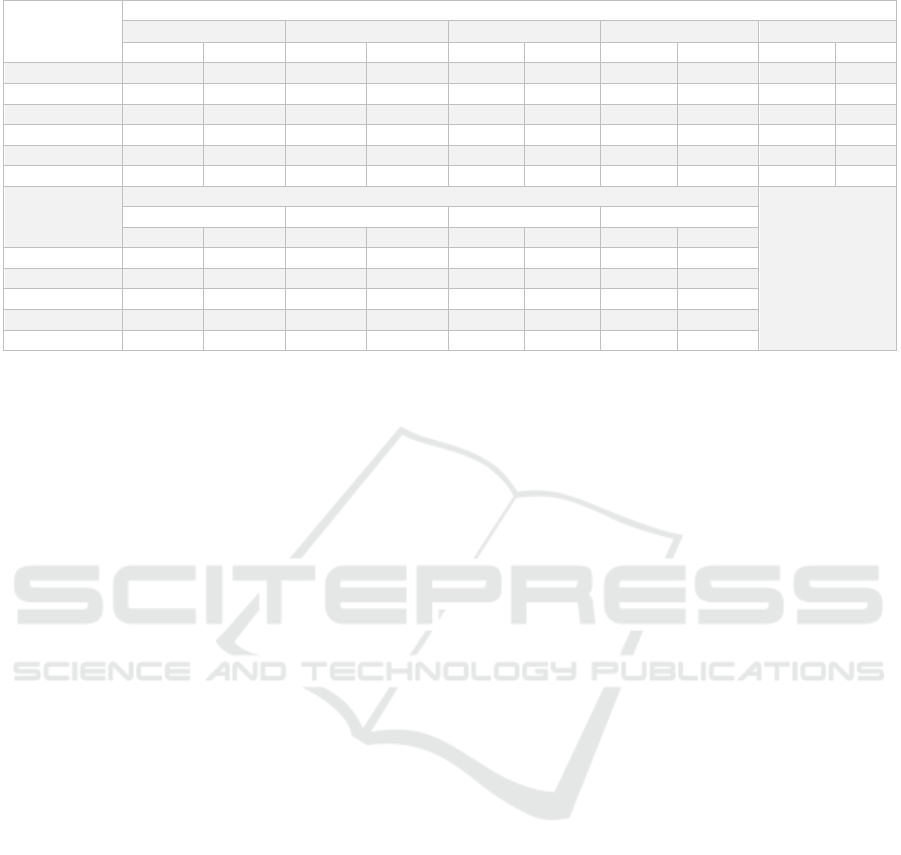
Table 1: Change area in different LULC categories between 1985 and 2050.
Type of Land
Use
Surface
1985 2000 2018 2030 2050
(km
2
) (%) (km
2
) (%) (km
2
) (%) (km
2
) (%) (km
2
) (%)
Tree Crops 29,3 11,6 23,2 9,2 45,5 18 46 18,2 46 18,2
Croplan
d
173,7 68,9 139,4 55,3 95 37,6 86,4 34,2 85,5 33,9
Urban Area 4,5 1,8 11,6 4,6 27,1 10,7 36,6 14,5 41,1 16,3
Unused Lan
d
28,5 11,3 67,5 26,8 67,8 26,9 61,7 24,4 59,2 23,5
Forest Cove
r
16,2 6,4 10,5 4,2 17,1 6,8 21,8 8,6 20,7 8,2
Total 252,2 100 252,2 100 252,5 100 252,5 100 252,5 100
Type of Land
Use
Change
1985-2000 1985-2018 2018-2030 2018-2050
(km
2
) (%) (km
2
) (%) (km
2
) (%) (km
2
) (%)
Tree Crops -6,1 -20,8 16,2 55,3 0,5 1,1 0,5 1,1
Croplan
d
-34,3 -19,7 -78,7 -45,3 -8,6 -9,1 -9,5 -10
Urban Area 7,1 157,8 22,6 502,2 9,5 35,1 14 51,7
Unused Lan
d
39 136,8 39,3 137,9 -6,1 -9 -8,6 -12,7
Forest Cove
r
-5,7 -35,2 0,9 5,6 4,7 27,5 3,6 21,1
change of 137,9%. This change would reach 23,5%
(59,2 km
2
) in 2050 with a rate of change of -12,7%.
The increase in unused land is linked to the
conversion of agricultural land to urbanised areas in
the future (public facilities, industrial areas, urban
areas, and rural areas) and could also be explained by
the droughts during the last decades.
3.2 Organic Carbon Stocks and Soil
Texture of LULC Types
Analytical data on SOC stocks and texture of soils
sampled in different LULC classes in the study area
are presented in figures 4 and 7. Summary statistics
in terms of min, max and mean for the analysed
parameters (SOC and SOCS) are provided in Figure
4.
Soil organic matter and soil organic carbon is rich
in forests and unused or infertile land because: (1)
Forests and unused soils are less disturbed than
agricultural soils. (2) Forests and unused soils evolve
slowly. Nevertheless, their fertility is limited and
strongly dependent on the natural flows of elements
and organic matter. (3) Forests and unused soils are
generally the poorest soils chemically or those with
physical properties most unfavourable to agriculture.
In contrast to agricultural soils, they are not worked
or are only lightly worked. This results in a high
accumulation of organic matter in the litter and
surface soil horizons.
Traditionally, SOC in forest ecosystems is
usually considered in the regional assessment. As
shown in this study (Figure 4), the organic carbon
content at a depth of 0-15 cm in forest soils (4,9% -
10,4%) was higher than that reported for urban soils
in the Tadla plain (3,4% - 7,2%), where the city of
Beni Mellal is located. This showed that forest soils
can store large amounts of organic carbon in the soil.
Soil organic carbon contents measured under
different types of LULC varied in the following
order: forest cover > unused land > urban areas >
cropland > tree crops. A variation in SOC is very
noticeable in urban soils mainly due to human
activities that often change the parameters of these
soils.
SOC stocks were calculated for each sample in
the study area using the organic matter, bulk density,
and pebble volume values in the sample. In Figure 4,
SOCS values in soils sampled at a depth of 15cm
covering the whole study area ranged from 4,7 to 11,7
kg/m
2
. The SOCS in the forest cover ranged from 8,1
to 11,7 kg/m
2
, with an average of 9,9 kg/m
2
. In
cropland, the SOCS varied between 5,8 and 10,1
kg/m
2
with an average of 7,9 kg/m
2
, while the SOCS
stocks in tree crops varied between 4,7 and 8,9 kg/m
2
and an average of 6,4 kg/m
2
. Unused land had SOC
stocks between 7,6 and 10,1 kg/m
2
with an average of
8,9 kg/m
2
. At the same time, urban areas had SOC
values between 5,8 and 9,2 kg/m
2
with an average
value of 7,4 kg/m
2
. From these results of the sampled
soils, we notice that the SOC stocks measured under
different types of LULC varied in the following
order: forest cover > unused land > cropland > urban
areas > tree corps.
3.2.1 SOCS of the Study Period
The SOC stocks for 1985, 2000, 2018, 2030 and 2050
were calculated for each LULC type in the study area
using the average SOCS values and the area of each
LULC type. In Table 2, the SOCS values have been
summed separately for each date and LULC type.
These SOCS have changed slightly in the forest cover
Spatio-Temporal Modelling of Relationship Between Organic Carbon Content and Land Use Using Deep Learning Approach and Several
Co-Variables: Application to the Soils of the Beni Mellal in Morocco
21
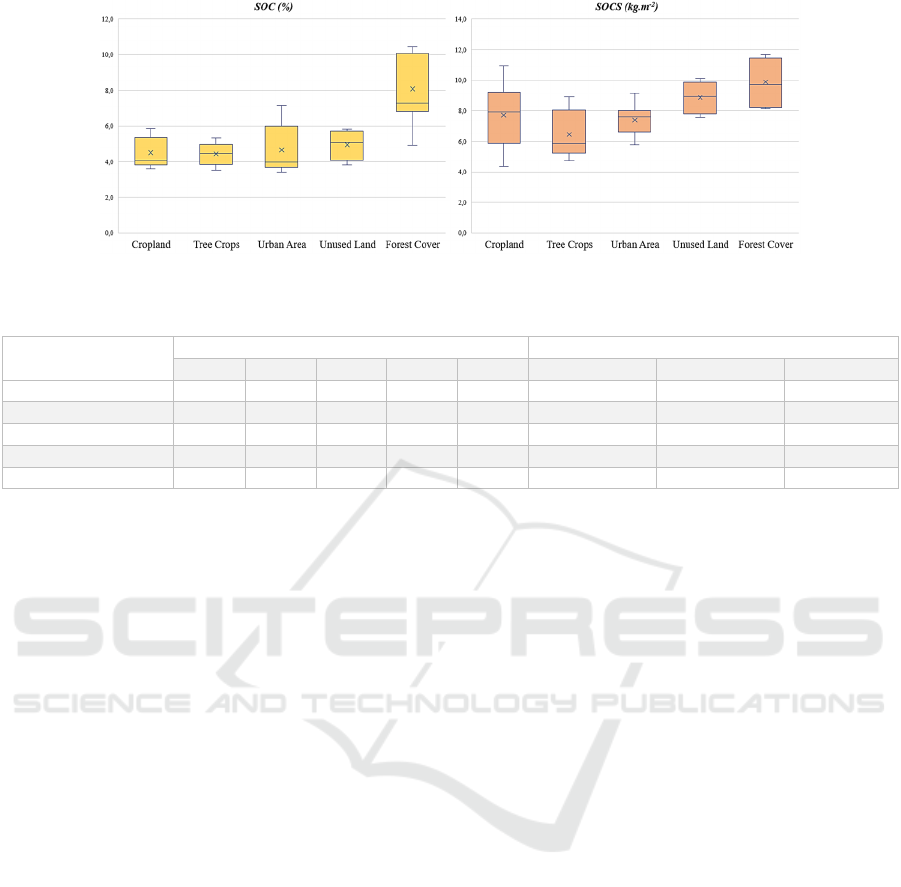
Figure 4: Variation in SOC and SOCS by LULC type.
Table 2: Change in SOCS by LULC type between the years 1985, 2000, 2018, 2030 and 2050.
Type of Land Use
SOCS (kg/m
2
) SOCS Change (kg/m
2
)
1985 2000 2018 2030 2050 1985-2018 2018-2030 2018-2050
Tree Crops 187,5 148,5 291,2 294,4 294,4 103,7 3,2 3,2
Cro
p
lan
d
1337,5 1073,4 731,5 665,3 658,4 -606 -66,2 -73,1
Urban Area 33,3 85,8 200,5 270,8 304,1 167,2 70,3 103,6
Unused Lan
d
253,7 600,8 603,4 549,1 526,9 349,7 -54,3 -76,5
Forest Cove
r
160,4 104 169,3 215,8 204,9 8,9 46,5 35,6
class from 160,4 kg/m
2
in 1985 to 169,3 kg/m
2
in
2018 with a positive rate of change of 8,9 kg/m
2
.
According to the projections in 2050, the SOCS
would expect 204,9 kg/m
2
. At the same time there is
a net increase in these stocks in the tree crops class
from 187,5 kg/m
2
in 1985 to 291,2 kg/m
2
in 2018,
with a rate of change of 103,7 kg/m
2
. In 2050, these
stocks are projected to be 294,4 kg/m
2
. This slight
increase in SOCS in the tree crop and forestry sectors
is mainly due to the planting of fruit trees in the plains
and afforestation in the forests that have been carried
out under the two strategies (the Green Morocco Plan
and the National Watershed Management Plan).
These two strategies are carried out mainly to combat
the degradation of natural resources (soil, water,
forests, etc.) and to combat erosion to increase
organic carbon stocks in the soil.
Similarly, we can notice a strong increase of
SOCS in unused land from 253,7 kg/m
2
in 1985 to
603,4 kg/m
2
with a rate of change of 349,7 kg/m
2
.
This increase could be explained by the increase of
unused land surfaces during this period due to the
drought. However, there is a strong decrease in the
SOCS of cropland from 1337,5 kg/m
2
in 1985 to
731,5 kg/m
2
in 2018 with a negative rate of change of
-606 kg/m
2
. Based on this regressive trend, cropland
SOCS could decrease to 658,4 kg/m
2
in 2050 with a
negative rate of change of -73,1 kg/m
2
. This decrease
is generally due to the extension of urbanisation, the
increase of informal settlements on the outskirts of
the city of Beni Mellal (Adouz, M'ghila, Ourbiaa...),
and to drought and water stress which convert the
surfaces of croplands to unused lands.
Moreover, in urban soils, SOCS has increased
from 33,3 kg/m
2
in 1985 to 200,5 kg/m
2
in 2018 with
a positive variation of 167,2 kg/m
2
. In 2050,
according to projections, these stocks in urban soils
would reach 304,1 kg/m
2
. According to Pouyat et al
in 2006, urban soils have the potential to sequester
large amounts of atmospheric CO
2
. Similarly,
Golubiewski in 2006 found that urban green spaces
contained higher stocks of SOC than native
grasslands, agricultural or forested areas in Colorado,
USA.
The results show that there is a significant
difference between the SOCS of different types of
LULC. LULC play a dominant role in influencing
SOC content and stock because surface soil
disturbance, litterfall and decomposition vary with
LULC, resulting in a difference in SOCS according to
land use. The SOCS of forest soils is very high
compared to other LULC due to the intense
topography and forest cover, which slows down soil
erosion and organic carbon decomposition, resulting
in forest soils having SOCS and SOC above their
potential capacity. However, the SOCS of tree crops
and cropland is very low compared to forest cover and
unused land due to intensive agricultural cultivation
(tillage), which accelerates soil erosion and
decomposition of soil organic carbon (Lal, 2005,
Laganière et al. 2010).
GISTAM 2023 - 9th International Conference on Geographical Information Systems Theory, Applications and Management
22
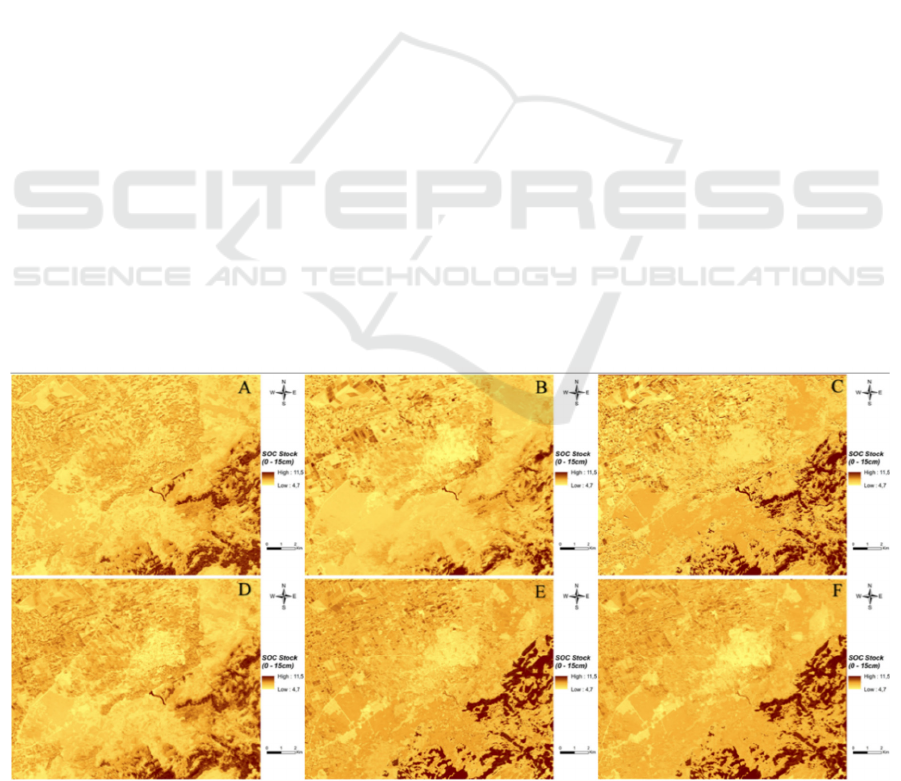
3.2.2 Soil Organic Carbon Trends for 1985,
2000, 2018, 2030 and 2050
To spatially distribute the content of SOC stocks
between 1985 and 2050, spatial regression maps of
these stocks from different environmental covariates
(DEM, NDVI, EVI, RVI, SAVI, LULC, MNF, PCA,
RGB, NirGB) were generated using a deep learning
approach with MLP (Figure 5). The maps were
plotted at the same scale and with geometric intervals
to facilitate comparisons. The results indicated that
SOC stocks showed high spatial variability in the
higher elevations of the study area. From the results
obtained concerning the stock of SOC, we deduce that
the important factors affecting this stock are the
topography of the place, the uses, and the types of
soil. In addition, the fact that photosynthesis allows
through biomass to store carbon in the soil, which we
see in Figure 5 concerning the forest where there is an
increase in the stock of SOC according to the years
1985, 2000, 2018 and 2050. Similarly, SOCS are
more sensitive to growth and increasing population
density (Lal and Augustin, 2011, Liu et al. 2016).
Urbanisation and buildings in the study area degrade
soils, cementing them and making them
impermeable, and thus they cannot absorb carbon
circulating in the biosphere. Thus, agricultural soils
and unused land transformed over time into built-up
areas could increase the loss of soil carbon sinks. This
indicates that land use has had an impact on the
distribution characteristics of SOC in the topsoil (0-
15 cm) of the study area (Figure 5).
The spatial distribution of SOCS (in 1985, 2000,
2018, 2030 and 2050) is shown in Figure 5 and shows
that high SOCS levels generally correspond to
forests. The spatial distribution of SOCS is almost
similar for each date across the different covariates
and LULC types. Overall, SOCS stocks in the south-
east are higher than those in the north-west, east, and
west of the study area, respectively. The results show
small pockets of SOCS highest in the central and
extreme south-eastern corner at a depth of 0-15 cm,
which corresponds to unused land in the Tadla plain
and forest cover in the mountains. The eastern and
western corners of the study site have the lowest
SOCS value as it is covered by urban areas, cropland,
and tree crops. This indicates that forests and
grasslands are more efficient in storing SOC than
other types of LULC. Most of the study area has
average SOCS values. The analysis suggests that,
mainly in the topsoil (0-15 cm depth), the spatial
distribution pattern of SOCS was highly variable due
to small-scale variations in supply, redistribution, and
stabilisation. The central part of the study area is
represented by a low SOCS.
The multi-date (1985, 2000 and 2018) spatial
autocorrelations of SOCS with environmental
covariates derived from satellite images are presented
in Figure 6. In this analysis, SOCS derived from
spatial interpolation techniques (IDW and Kriging)
and MLP were autocorrelated with spectral indices
(NDVI, EVI, RVI, SAVI), image transformation
indices (MNF, PCA), LULC units and spectral bands
(RGB and NirGB). The analysis shows very high
autocorrelations between the vegetation indices and
the SOCS. However, these autocorrelations are
particularly higher for the SOCS derived from spatial
modelling
with
MLP
than
the
SOCS
derived
from
Figure 5: Predicted soil organic carbon stocks (SOCS) (in kg/m
2
) maps for (A) 1985, (B) 2000, (C) 2018 real, (D) 2018
predicted, (E) 2030 and (F) 2050.
Spatio-Temporal Modelling of Relationship Between Organic Carbon Content and Land Use Using Deep Learning Approach and Several
Co-Variables: Application to the Soils of the Beni Mellal in Morocco
23
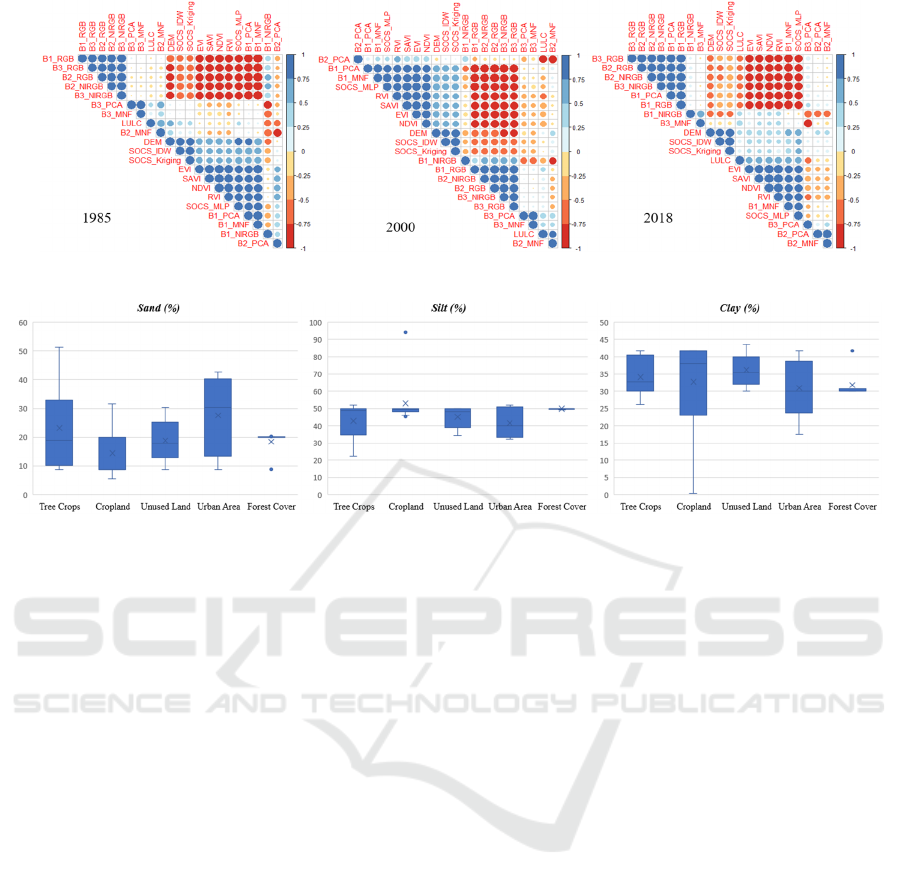
Figure 6: Spatial autocorrelations between SOCS and environmental covariates.
Figure 7: Variation in the percentage of Sand, Silt and Clay by LULC type.
spatial interpolation techniques. This suggests that
spatial modelling approaches to SOCS with deep
learning algorithms from environmental covariates
and in situ measurements are more accurate than uni-
variate spatial interpolation techniques based on field
samples. Similarly, significant, and positive spatial
autocorrelations were observed with the topographic
variable, but very high negative autocorrelations were
observed with the spectral bands and SOCS for all
three dates. In contrast, the relationship between
LULC units and SOCS from the three approaches is
particularly variable depending on the multi-date
dynamics of LULC. The autocorrelations between
SOCS and LULC units are very weak in 1985 and
2000 but significant for the year 2018. This suggests
that the land use dynamics in the area have favoured
SOCS.
3.2.3 Soil Texture
Texture indicates the relative abundance of different
particle sizes in the soil: sand, silt, or clay. Texture
determines how easily the soil can be worked, how
much water and air it contains, and how quickly water
can enter and move through the soil. Soil texture is
very stable over time and less affected by LULC. In
addition, soil aggregates are a factor responsible for
SOC stabilisation (micro-aggregates protect the SOC
in the long term and the renewal of macro-aggregates
is a crucial process that influences SOC stabilisation)
(Six et al. 2004). Therefore, the texture analysis of the
sampled soils was performed by adopting the USDA
classification (Garcia-Gaines,
and Frankenstein,
2015). The forty sites sampled for each type of LULC
have clay values ranging from 0,3% to 41,7%, sand
values ranging from 5,6% to 51,4%, and silt values
ranging from 22,5% to 94,1% (Figure 7). In the study
area, the textural class of the studied soils is clay
loam for the LULC classes of tree crops and urban
areas and Silt-clay loam for the classes of cropland,
unused land, and forest cover. The results of the
particle size analyses projected onto the USDA
triangular diagram showed that all LULC types have
a loamy soil texture which is a moderately fine
texture of fine sands and silts.
4 CONCLUSIONS
In this study, a multi-date geospatial approach to soil
organic carbon stocks in the Beni Mellal region of
Morocco and its relationship with LULC dynamics
and environmental covariates was developed by
applying two methods: a spatial interpolation method
on in situ measurements and a MLP model trained on
ten biophysical variables. For the three dates
considered (1985, 2000 and 2018), the results
obtained show highly significant spatial
autocorrelations
(R
2
>0,75) between the SOCS from
GISTAM 2023 - 9th International Conference on Geographical Information Systems Theory, Applications and Management
24

the multivariate modelling with the MLP better than
those obtained between the SOCS from the spatial
interpolation techniques (IDW and Kriging). On the
other hand, spatial autocorrelations between LULC
units and SOCS are highly variable across years. For
the earliest years (1985, 2000), very low
autocorrelations were found between the SOCS and
LULC units, but the most the recent year 2018 was
distinguished by significant positive correlation
values between the SOCS from the MLP modelling
and the LULC units. Indeed, land use change in the
study area between 1985 and 2018 was (11,6% to
18%), (68,9% to 37,6%), (1,8% to 10,7%), (11,3% to
26,9%) and (6,4% to 6,8%) for tree crops, cropland,
urban area, unused land, and forest cover
respectively. In general, urbanisation linked to
population growth has also had a significant impact
on LULC change and has tended to implicitly reduce
soil carbon sequestration. However, according to the
SOCS results, tree crops, unused land and forest
cover mainly tend to be more resistant to land
degradation. Furthermore, it should be noted that this
study was conducted at a very small spatial scale with
few samples. A large-scale comparative evaluation of
multivariate SOCS geospatial approaches based on
deep learning or machine learning and spatial
interpolation techniques is one of the perspectives for
future studies to refine the different conclusions from
this approach.
ACKNOWLEDGEMENTS
We would like to thank the Faculty of Science and
Technology of Beni Mellal, for having given us the
means (transport and soil analysis laboratory) to carry
out this work. We would also like to thank Professor
A. Barakat for his advice during the realisation of this
study.
REFERENCES
Ait Ouhamchich, K., Karaoui I., Arioua, A., Kasmi, A.,
Elhamdouni, D., Elfiraoui, E., Arioua, Z., Nazi, F.,
Nabih, N. (2018). Climate Change Trend Observations
in Morocco: Case Study of Beni Mellal-Khenifra and
Darâa-Tafilalt Regions. Journal of Geoscience and
Environment Protection 6: 34-50.
Aghzar, N., Berdai, H., Bellouti, A., Soud, B. (2002).
Ground water nitrate pollution in Tadla (Morocco).
Journal of Water Science, Rev. Sci. Eau 15(2): 459-492.
Baki, Y., Boutoial, K., Medaghri-Alaoui, A. (2021). The
impact of climate change on water inflow of the three
largest dams in the Beni Mellal-Khenifra region. E3S
Web of Conferences 314.
Barakat, A., Ouargaf, Z., Khellouk, R., El Jazouli, A.,
Touhami, F. (2019). Land Use/Land Cover Change and
Environmental Impact Assessment in Béni-Mellal
District (Morocco) Using Remote Sensing and GIS.
Earth Systems and Environment 3: 1-13.
Bae. J., Ryu, Y. (2015). Land use and land cover changes
explain spatial and temporal variations of the soil
organic carbon stocks in a constructed urban park.
Landscape and Urban Planning 136 (April): 57-67.
Beesley, L., (2012). Carbon storage and fuxes in existing
and newly created urban soils. Journal of
Environmental Management, 104: 158-165.
Bernoux, M., ConceiçÃo, M.d., Carvalho, S., Volkoff, B.,
Cerri, C.C. (2001). CO
2
emission from mineral soils
following land-cover change in Brazil. global change
biology 7(7): 779-787.
Emadi, M., Taghizadeh-Mehrjardi, R., Cherati, A., Danesh,
M., Mosavi, A., & Scholten, T. (2020). Predicting and
Mapping of Soil Organic Carbon Using Machine
Learning Algorithms in Northern Iran. Remote Sensing
12(14): 2234.
Emamgholizadeh, S., Esmaeilbeiki, F., Babak, M.,
zarehaghi, D., Maroufpoor, E., Rezaei, H. (2018).
Estimation of the organic carbon content by the pattern
recognition method. Communications in Soil Science and
Plant Analysis 49(17): 2143-2154.
Ennaji, W., Barakat, A., Karaoui, I., El Baghdadi, M., Arioua,
A.(2018). Remote sensing approach to assess salt-
affected soils in the north-east part of Tadla plain,
Morocco. Geology, Ecology, and Landscapes 2(1):22-28
El Jazouli, A., Barakat, A., Khellouk, R., Rais, J., El
Baghdadi, M. (2018). Remote sensing and GIS
techniques for prediction of land use land cover change
effects on soil erosion in the high basin of the Oum Er
Rbia River (Morocco). Remote Sensing Applications:
Society and Environment 13: 361-374.
Edmonds, J. L., O'Sullivan, O.S., Inger, R., Potter, J.,
McHugh, N., Gaston, K.J., Leake, J. R., Bond-
Lamberty, B. (2014). Urban Tree Effects on Soil
Organic Carbon. PLoS ONE 9(7): e101872.
Fathizad, H., Taghizadeh-Mehrjardi, R., Hakimzadeh
Ardakani, M.A., Zeraatpisheh, M., Heung, B.,
Scholten, T. (2022). Spatiotemporal Assessment of Soil
Organic Carbon Change Using Machine-Learning in
Arid Regions. Agronomy 12(3): 628.
Garcia-Gaines, A., Frankenstein, S. (2015). USCS and the
USDA Soil Classification System. US Army Corps of
Engineers, 46p.
Golubiewski, N. E. (2006). Urbanization Increases
Grassland Carbon Pools: Effects of Landscaping In
Colorado's Front Range. Ecological Applications 16(2):
555–571.
irouard, G., Bannari, A., El-Harti, A. and Desrochers, A.
(2004). Validated Spectral Angle Mapper Algorithm
for Geological Mapping: Comparative Study between
Quickbird and Landsat-TM, Geo-Imagery Bridging
Continents Istanbul, Turkey. Environmental Science,
Mathematics, Geology 12(23): 599–604.
Spatio-Temporal Modelling of Relationship Between Organic Carbon Content and Land Use Using Deep Learning Approach and Several
Co-Variables: Application to the Soils of the Beni Mellal in Morocco
25

Hazhir, K., Javad, J., Jabbar, K., Parisa, A. (2018).
Monitoring and prediction of land use/land cover
changes using CA-Markov model: a case study of
Ravansar County in Iran. Arabian Journal of
Geosciences 11(592): 1-9.
Huong, N.T.T., Phuong, N.T.T. (2018). Land use/land
cover change prediction in Dak Nong Province based
on remote sensing and Markov Chain Model and
Cellular Automata. Journal of Vietnamese Environment
9(3): 132-140.
Hutyra, L.R., Yoon, B., Alberti, M. (2011) Terrestrial
carbon stocks across a gradient of urbanization: a study
of the Seattle, WA region. Global Change Biology
17(2): 783-797.
Hutchinson, J.J., Campbell, C.A., Desjardins, R.L.
(2007). Some perspectives on carbon sequestration in
agriculture. Agricultural and Forest Meteorology
142(2-4): 0-302.
Hunter, E.L., Power, C.H. (2002). An assessment of two
classification methods for mapping Thames Estuary
intertidal habitats using CASI data. International
Journal of Remote Sensing 23(15): 2989–3008.
Kılıc ̧ M., Gu ̈ndoğan R., Gu ̈nal H., Cemek, B. (2022).
Accuracy Assessment of Kriging, artificial neural
network, and a hybrid approach integrating spatial and
terrain data in estimating and mapping of soil organic
carbon. PLoS ONE 17(5): e0268658.
Kaye, J.P., McCulley, R.I., Burke, I.C. (2005) Carbon
Fluxes, nitrogen cycling, and soil microbial
communities in adjacent urban, native, and agricultural
ecosystems. Global Change Biology 11(4): 575-587.
Kruse, F.A., Lefkoff, A.B., Boardman, J.W., Heidebrecht,
K.B., Shapiro, P.J. and Goetz, A.F.H. (1993) The
Spectral Image Processing System (SIPS)-Interactive
Visualization and Analysis of Imaging Spectrometer
Data. Remote Sensing of Environment 44(2-3):145-163.
Liu, Y., Li, S., Sun, X., Yu, X. (2016). Variations of forest
soil organic carbon and its influencing factors in east
China. Annals of Forest Science 73(2): 501–511.
Lal, R., Augustin, B. (2011). Carbon sequestration in urban
ecosystems. Springer, Dordrecht.
Laganière, J., Déni, A.A., David P. (2010). Carbon
accumulation in agricultural soils after afforestation: a
meta-analysis. global change biology 16(1): 439-453.
Lal, R. (2005). Soil carbon sequestration impacts on global
climate change and food security. Science 304: 1623-
1627.
Mestdagh, I., Sleutel. S., Lootens, P., Van Cleemput, O.,
Carlier, L. (2005). Soil organic carbon stocks in verges
and urban areas of Flanders, Belgium. Grass and
Forage Science 60(2): 151–156.
Ministry of Agriculture, Fisheries, Rural, Development,
Water and Forests (2008). Green Moroccan Plan.
Nurmiaty., Sumbangan, B., Samsu A. (2014). GIS-Based
Modelling of Land Use Dynamics Using Cellular
Automata and Markov Chain. Journal of Environment
and Earth Science 4(4): 2224-3216.
Obeidat, M., Awawdeh, M., Lababneh, A. (2019).
Assessment of land use/land cover change and its
environmental impacts using remote sensing and GIS
techniques, Yarmouk River Basin, north Jordan.
Arabian Journal of Geosciences 12(22): 685.
Pouyat, R.V., Yesilonis, I.D., Nowak D.J. (2006). Carbon
storage by urbain soils in the United States. Journal of
Environmental Quality 35(4): 1566-1575.
Raciti, S.M., Hutryra, L.R., Finzi, A.C. (2012). Depleted
soil carbon and nitrogen stocks under impervious
surfaces. Environment Pollution 164: 248-251.
Shifaw, E., Sha, J., Li, X., Jiali, S., Bao, Z. (2018). Remote
sensing and GIS-based analysis of urban dynamics and
modelling of its drivers, the case of Pingtan, China.
Environment, Development and Sustainability 22(3):
2159-2186.
Sharjeel, M., Zahir, A., Mateeul, H., Badar, M.G. (2016).
Monitoring and Predicting Land use/Landcover Change
Using an Integrated Markov Chain & Multilayer
Perceptron Models: A Case Study of Sahiwal Tehsil.
Journal of GeoSpace Science, 1(2): 43-59.
Six, J., Bossuyt, H., Degryze, S., Denef, K. (2004). A
history of research on the link between (micro)
aggregates, soil biota, and soil organic matter
dynamics. Soil and Tillage Research 79(1): 7–31.
Taghizadeh-Mehrjardi, R., Neupane, R., Sood, K., Kumar,
S. (2017). Artificial bee colony feature selection
algorithm combined with machine learning algorithms
to predict vertical and lateral distribution of soil organic
matter in South Dakota, USA. Carbon Management
8(3): 277-291.
Townshend, J.R., Masek, J.G., Huang, C, Vermote, E.F.,
Gao, F., Channan, S., Sexton, J.O., Feng, M.,
Narasimhan, R., Kim, D., Song, K., Song, D., Song, X.P,
Noojipady, P., Tan, B., Hansen, M.C., Li, M., Wolfe,
R.E. (2012). Global characterization and monitoring of
forest cover using Landsat data: opportunities and
challenges. International Journal of Digital Earth 5(5):
373–397.
Wei, Z.Q., Wu, S.H., Zhou, S.L., Li, J.T., Zhao, Q.G.
(2014). Soil organic carbon transformation and related
properties in urban soil under impervious surfaces.
Pedosphere, 24(1): 56–64.
Xiong, X., Sabine, G.D., Brenton, M., Wade, R., Willie,
G.H., Nicolas, B.C. (2014) Interaction effects of
climate and land use/land cover change on soil organic
carbon sequestration. Science of the Total Environment
493: 974–982.
Yang, S., Sheng, D., Adamowski, J., Gong, Y., Zhang, J.,
Cao, J. (2018). Effect of Land Use Change on Soil
Carbon Storage over the Last 40 Years in the Shi Yang
River Basin, China. Land 7(1): 11.
Yang, R.M., Zhang, G.L., Yang, F., Zhi, J.J., Yang, F., Liu,
F., Zhao, Y.G., Li, D.C. (2016). Precise estimation of soil
organic carbon stocks in the northeast Tibetan plateau.
Scientific Reports 6: 21842.
Yan, Y., Zhang, C., Hu, Y., Kuang, W. (2015). Urban Land-
Cover Change and Its Impact on the Ecosystem Carbon
Storage in a Dryland City. Remote Sensing 8(1): 6.
GISTAM 2023 - 9th International Conference on Geographical Information Systems Theory, Applications and Management
26
