
Bushfire Susceptibility Mapping Using Gene Expression
Programming and Machine Learning Methods: A Case Study of
Kangaroo Island, South Australia
Maryamsadat Hosseini
a
and Samsung Lim
b
School of Civil and Environmental Engineering, University of New South Wales, High Street, Sydney, Australia
Keywords: Bushfire, Susceptibility Map, Gene Expression Programming, Machine Learning, Kangaroo Island.
Abstract: Kangaroo Island, South Australia is one of the bushfire-prone areas. A catastrophic bushfire known as the
black summer hit Kangaroo Island in 2019/2020. We chose Kangaroo Island as a case study to generate
bushfire susceptibility maps using five different methods, namely gene expression programming (GEP),
random forest (RF), support vector machine (SVM), frequency ratio (FR) and logistic regression (LR). To
generate bushfire susceptibility maps, we used eight contributing factors including: digital elevation model,
slope, aspect, normalized difference vegetation index, distance to roads, distance to streams, precipitation,
and land cover. The proposed methods were evaluated by area under the curves (AUCs) of receiver operating
characteristic. RF performed best with an AUC of 0.93, followed by SVM and GEP with AUCs equal to 0.89
and 0.88, respectively, but LR and FR performed least among the five methods with AUCs 0.85 and 0.84,
respectively. The generated bushfire susceptibility maps show that western and central areas of Kangaroo
Island are highly vulnerable to bushfire.
1 INTRODUCTION
Bushfires are dangerous and destructive to both
human and nature, which affect the ecological
balance of the environment (Leuenberger et al., 2018;
Zhang et al., 2019). Generation of a nation-wide
bushfire susceptibility map is difficult (Valdez et al.,
2017) as there are many areas with unknown or
inaccurate spatial variability in bushfire susceptibility
mapping (Valdez et al., 2017). Consequently,
different methods have been used in different studies
(Valdez et al., 2017). Statistical methods such as
weights of evidence (WOF) and frequency ratio (FR)
have been applied in many studies to generate
bushfire susceptibility (Dorji and Ongsomwang,
2017; Hong et al., 2019, 2017; Valdez et al., 2017).
In contrast, several studies showed that machine
learning techniques could have a better performance
than statistical methods do in this field (Gholamnia et
al., 2020; Tehrany et al., 2019; Valdez et al., 2017).
However, statistical methods are easy to apply,
machine learning methods are independent from
a
https://orcid.org/0000-0002-2858-9705
b
https://orcid.org/0000-0001-9838-8960
expert’s opinion (Hosseini and Lim, 2022; Jaafari et
al., 2017). Gene expression programming (GEP),
introduced by Ferreira (2001), is a population-based
algorithm similar to a genetic algorithm (GA) and
genetic programming (GP) (Ferreira, 2001). GEP is
based on a fitness function and process developed to
find the best solution for the specific problem while
minimizing the error (Ferreira, 2001). Recently,
Hosseini and Lim (2021) applied GEP, logistic
regression (LR), FR and ensemble of these methods
for bushfire susceptibility mapping. They showed that
GEP ensembled with FR had the highest AUC in
Victoria, Australia. In addition, in another study
which applied in New South Wales, Australia
(Hosseini and Lim, 2022), GEP ensembled with FR
had the highest AUC among the different machine
learning techniques such as RF and SVM.
Therefore, the goal of this study is to investigate
the application of statistical methods such as FR and
different machine learning techniques including
random forest (RF), support vector machine (SVM)
and LR, in bushfire susceptibility mapping, as an
Hosseini, M. and Lim, S.
Bushfire Susceptibility Mapping Using Gene Expression Programming and Machine Learning Methods: A Case Study of Kangaroo Island, South Australia.
DOI: 10.5220/0011724700003473
In Proceedings of the 9th International Conference on Geographical Information Systems Theory, Applications and Management (GISTAM 2023), pages 123-127
ISBN: 978-989-758-649-1; ISSN: 2184-500X
Copyright
c
2023 by SCITEPRESS – Science and Technology Publications, Lda. Under CC license (CC BY-NC-ND 4.0)
123
extension of the abovementioned studies. Finally, we
compared the maps generated by different methods
with the result of GEP in Kangaroo Island.
2 MATERIALS AND METHODS
2.1 Study Area
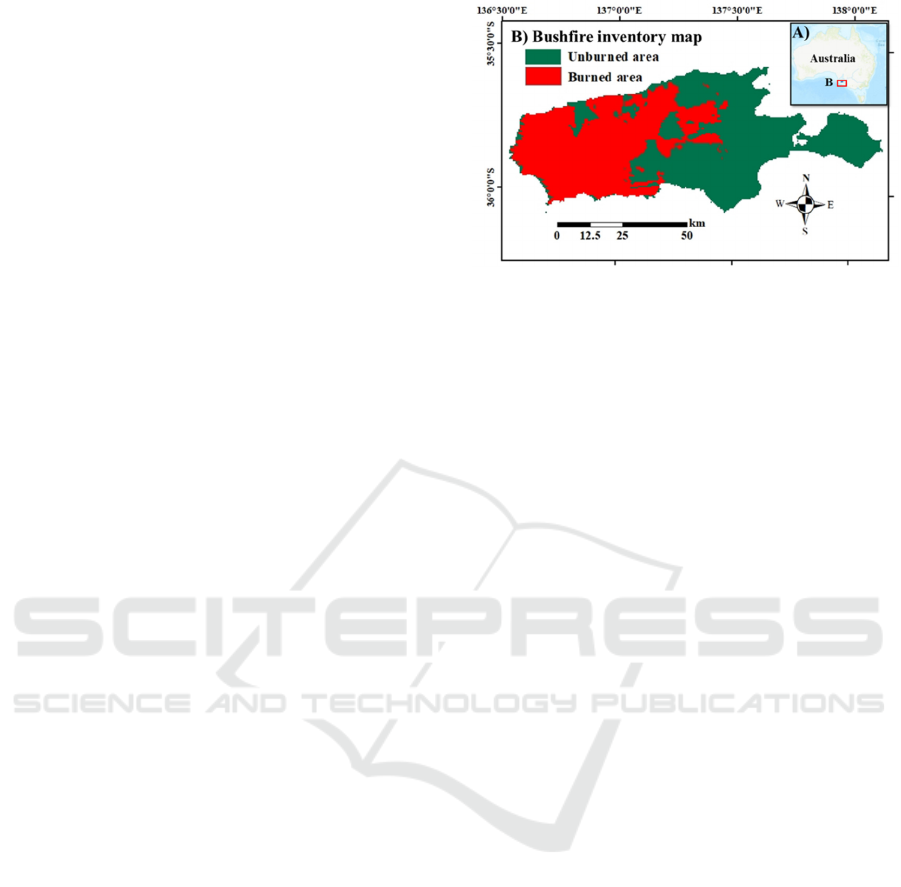
This study aims to generate bushfire susceptibility
maps in Kangaroo Island (Figure 1A). Kangaroo
Island with 3,890 km
2
area which is relatively flat,
surrounded by cold waters and has a 458-km
complicated coastline (Bourman, Murray-Wallace
and Harvey, 2016; Peace and Mills, 2012). Kangaroo
Island after Tasmania and Melville Island is the
largest Island in Australia which is located in South
Australia and is vulnerable area for regular bushfires
(Bonney et al., 2020; Bourman, Murray-Wallace and
Harvey, 2016). For example, 2,100 km
2
were burned
during the last bushfire known as the black summer
(2019-2020) in Kangaroo Island (Bonney et al.,
2020). The temperature in Kangaroo Island reached
on average to 24 ˚C in summer, and annual
precipitation on average is 567 mm since 1988, while
forests in the west and central parts of the Island have
the highest precipitation in the Island (Bonney et al.,
2020).
2.2 Data Collection
2.2.1 Bushfire Reference Map
Generating a bushfire reference map is the first stage
in bushfire susceptibility mapping (Hosseini and Lim,
2022). A bushfire reference map in Kangaroo Island
was generated using the MODIS burned-area
(MCD64). MCD64 with 500-m resolution is
available monthly from the website of University of
Maryland (MODIS Fire, 2020). In this study, we
collected the data for 10 years (2010 to 2020) in
November to February which is known as a fire
season in Australia (Figure 1B). The reference map
was randomly divided into two groups: 70% of the
data considered as the training set and 30% of the data
used for the testing set.
Figure 1: A) Australia map with location of Kangaroo
Island, B) Bushfire inventory map for 10 years (2010 to
2020) in Kangaroo Island.
2.2.2 Conditioning Factors
Several factors are influencing bushfires and may
change the behaviour of the bushfires. Therefore,
these factors also known as conditioning factors,
should be considered in bushfire modelling studies.
In this study, we considered topographic factors as an
important factor in bushfire occurrence including
digital elevation model, slope and aspect which
considered in similar studies (Bui, 2019; Gholamnia
et al., 2020; Tonini et al., 2020). There are many
research that took climate factors such as
precipitations and temperature into account
(Ghorbanzadeh et al., 2019; Jaafari and Pourghasemi,
2019; Razavi-Termeh, Sadeghi-Niaraki and Choi,
2020). Fuel load factors including normalized
difference vegetation index (NDVI) and land cover
also were proposed in different studies (Bui, 2019;
Hong, Jaafari and Zenner, 2019; Razavi-Termeh,
Sadeghi-Niaraki and Choi, 2020). Finally, other
factors such as distance to roads, distance to water
streams and topographic wetness index (Zhang,
Wang and Liu, 2019; Eskandari, Miesel and
Pourghasemi, 2020; Gholamnia et al., 2020) assumed
as conditioning factors in this study. However, we
eliminated two factors (temperature and topographic
wetness index) due to the high correlation of these
two variables with other variables.
2.3 GEP
GEP introduced by Ferreira (2001), similar to GA and
GP, is based on populations of individuals and
individuals had been selected by their fitness
(Ferreira, 2001). The main difference between these
three algorithms is in individuals’ characters which
create the populations (Ferreira, 2001). Individuals in
GA have fixed linear structure, while chromosomes
in GP are nonlinear structures with different sizes and
GISTAM 2023 - 9th International Conference on Geographical Information Systems Theory, Applications and Management
124

shapes (Ferreira, 2001). Individuals in GEP are linear
with a fixed length, but they can be expressed in
nonlinear structures with different sizes and shapes
(Ferreira, 2001). GA and GP have their own
limitations. Manipulation in GA is easy, but the
complexity in individuals is not available. However,
GP maintains the complexity of individuals, but the
reproduction is too challenging and difficult (Ferreira,
2001). Therefore, GEP (as a result of further
development of GP) is able to deal with a complex
phenomenon and solve the problem faster than GP
(Alkroosh and Nikraz, 2011).
The GEP, a freshly developed artificial
intelligence method, has demonstrated its
effectiveness in the engineering sector (Alkroosh and
Nikraz, 2011). GEP can generate the mathematical
formula for bushfire susceptibility which make
interpretation and explanation steps easy and simple
(Hosseini and Lim, 2022).
2.4 Machine Learning Techniques
In this study, we considered three different machine
learning techniques including LR, SVM and RF. LR
is a popular method in modelling the bushfires and
other types of natural hazards (Jaafari et al., 2019;
Zhang et al., 2016). LR has the ability to find the
spatial relationship between several independent
variables and dependent variable to find the event’s
pattern. LR also makes the results interpretation easy
and understandable (Jaafari et al., 2019; Zhang et al.,
2016). In the SVM model, a linear hyperplane
separates two different classes using statistical
learning theory and principle of risk minimization
(Jaafari and Pourghasemi, 2019). A separating
hyperplane converts the nonlinear problem to a linear
problem (Jaafari and Pourghasemi, 2019). In
addition, RF has improved classification accuracy
significantly by using an ensemble of trees while trees
are allowed to vote for the most popular label
(Breiman, 2001). While the number of trees in the
forest increased, the generalization error converges to
the small value for the forests (Breiman, 2001). In
machine learning methods, data are divided into two
groups including training data and testing data.
Firstly, the model starts to get trained by the training
data, and secondly, the model gets evaluated by using
the testing data.
3 RESULTS
We generated bushfire susceptibility maps using
different methods including GEP, RF, SVM, FR and
LR. Data have been divided randomly in two groups.
The models have been trained by using 70% of the
data and evaluated by using 30% of the data. The
natural break classification method was used to
classify bushfire susceptibility maps generated by the
GEP, RF, SVM, FR and LR. The generated maps were
categorized into five different classes including very
low, low, moderate, high and very high (Figure 2).
The bushfire susceptibility map generated by GEP
(Figure 2A), showed the central and western part of
Kangaroo Island had high to very high potential for
bushfire while the eastern part showed very low to
moderate potential for bushfire. The model generated
by GEP had AUC and accuracy equal to 0.88 and
80% respectively. We also generated a bushfire
susceptibility map using RF (Figure 2B). The
generated map by RF categorized the central and
western part of Kangaroo Island with very high
potential for bushfire while the eastern part had very
low potential for bushfire. The AUC and accuracy of
the model generated by RF was 0.93 and 85%,
respectively. The maps generated by SVM and RF
were similar to each other. The majority of the
western and central area of Kangaroo Island labelled
as very high and eastern area mainly determined as
very low and moderate potential for bushfire (Figure
2C). The SVM model had AUC equal to 0.89 and
accuracy equal to 82% in this study area. Finally, the
bushfire susceptibility maps generated by FR and LR
were similar. These two maps (Figure 2D and 2E)
represented the study area in variety of different
classes. The western part of study area covered with
very high and high potential for bushfire. The central
area covered by moderate potential, while eastern part
showed very low and moderate potential of bushfire.
The AUC of the model generated by FR was 0.84
while accuracy was 73% and the generated model by
LR had AUC and accuracy equal to 0.85 and 78%,
respectively. The model generated by LR was:
Z = -6.740 + 1.550 × A + 1.517 × E + 1.138
× L + 1.126 × N + 1.182 × P + 0.336 × DR
+ 0.307 × S - 0.582 × DS
(1
)
where A is aspect, E is digital elevation model, L is
landcover, N is NDVI, P is precipitation, DR is
distance to roads, S is slope and DS is distance to
streams.
Based on five different maps generated by
different methods (Figure 2), bushfire susceptibility
maps generated by RF was the most successful
method to classify burned and unburned areas
followed by SVM and GEP. Therefore, the maps
generated by LR and FR were the least accurate in
this study.
Bushfire Susceptibility Mapping Using Gene Expression Programming and Machine Learning Methods: A Case Study of Kangaroo Island,
South Australia
125
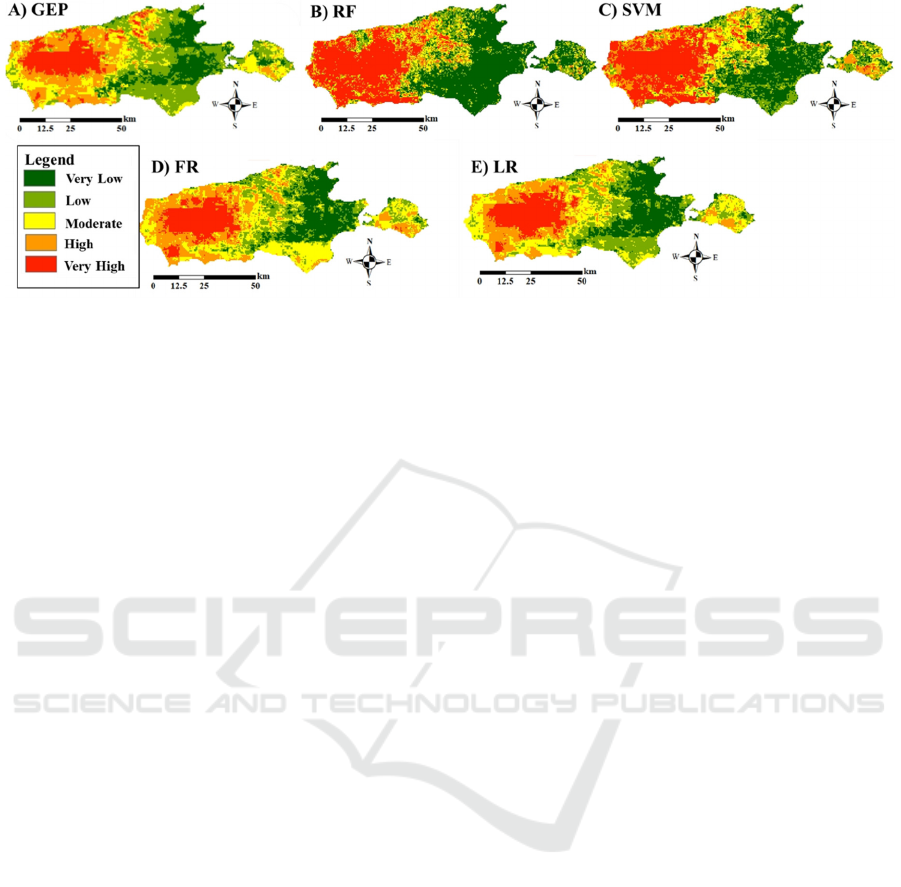
Figure 2: Bushfire susceptibility mapping by A) GEP, B) RF, C) SVM, D) FR and E) LR. Generated maps classified in five
different classes from very low (dark green) to very high (red).
4 DISCUSSIONS
The generated maps by different methods were
classified in five categories from very low to very
high classes. The bushfire susceptibility maps
generated by different techniques showed high
potential of bushfire in central and western part of
Kangaroo Island which was dominantly covered by
forest and dense vegetation and low potential in
eastern part were mainly covered by grassland. The
maps generated by RF and SVM were very similar,
and the Island was mainly divided in two different
classes (very low and very high), however, five
different classes (very low to very high) were more
clear in the bushfire susceptibility maps generated by
GEP, FR and LR in Kangaroo Island. The maps
generated by GEP, FR and LR were so similar while
GEP had higher AUC and accuracy than FR and LR.
On the other hand, the five different generated maps
showed incorrect classification in eastern and south-
eastern parts of study area due to the land cover of
Forest and Savannas in these areas. RF had the least
incorrect classification and FR had the most incorrect
classification. The most important barrier for
applying machine learning techniques such as RF and
SVM in bushfire modelling was lack of
interpretability (Jain et al., 2020). In contrast GEP is
easy to apply and understand and can represent the
formula to have an easier interpretation and
explanation step (Hosseini and Lim, 2022).
In addition, RF has an ability to determine variable
importance using internal estimates (Breiman, 2001).
In this study, RF showed that the precipitation factor
had the highest importance followed by digital
elevation model and land cover, in bushfire
susceptibility mapping. Previous study also showed
that land cover and precipitation factors had the
highest importance values (using RF) in bushfire
susceptibility mapping in New South Wales,
Australia (Hosseini and Lim, 2022). The bushfire
susceptibility maps generated by different methods in
this study showed different accuracies and AUCs.
Amongst the five different methods, RF had the
highest values in both accuracy and AUC, followed
by SVM and GEP. Therefore, FR and LR had the
lowest values for accuracy and AUC. Similarly,
previous study showed GEP ensembled with FR
outperformed the other methods such as LR and FR
in Victoria, Australia (Hosseini and Lim, 2021).
5 CONCLUSIONS
In this study, we investigated and compared the
application of machine learning techniques and GEP
in bushfire susceptibility mapping. We applied five
different methods including GEP, RF, SVM, FR and
LR to generate bushfire susceptibility maps in
Kangaroo Island. RF had the highest AUC and
accuracy followed by SVM and GEP, however, LR
and FR had the least performance and lower AUC and
accuracy. Based on the generated maps, the western
and central part of the Island had the highest potential
of bushfire while the eastern part of Island had a low
potential of bushfire. Furthermore, GEP is an advance
and new method for generating bushfire maps and RF
had the highest AUC. Therefore, in different study
areas, we can apply different methods to generate
bushfire susceptibility maps and use them to improve
the management of bushfire and have a better
performance in bushfire prone areas.
GISTAM 2023 - 9th International Conference on Geographical Information Systems Theory, Applications and Management
126

REFERENCES
Alkroosh, I. and Nikraz, H. (2011) ‘Correlation of pile
axial capacity and CPT data using gene expression
programming’, Geotechnical and Geological
Engineering, 29(5), pp. 725–748.
Bonney, M. T., He, Y. and Myint, S. W. (2020)
‘Contextualizing the 2019–20 kangaroo island
bushfires: Quantifying landscape-level influences on
past severity and recovery with landsat and google earth
engine’, Remote Sensing, 12(23), 3942. doi: 10.3390/
rs12233942.
Bourman, R. P., Murray-Wallace, C. V and Harvey, N.
(2016) Coastal Landscapes of South Australia.
University of Adelaide Press.
Breiman, L. E. O. (2001) ‘Random Forests’, pp. 5–32.
Bui, Q. T. (2019) ‘Metaheuristic algorithms in optimizing
neural network: a comparative study for forest fire
susceptibility mapping in Dak Nong, Vietnam’,
Geomatics, Natural Hazards and Risk, 10(1), pp. 136–
150. doi: 10.1080/19475705.2018.1509902.
Dorji, S. and Ongsomwang, S. (2017) ‘Wildfire
Susceptibility Mapping in Bhutan Using
Geoinformatics Technology’, Suranaree Journal of
Science and Technology, 24(2), pp. 213–237.
Eskandari, S., Miesel, J. R. and Pourghasemi, H. R. (2020)
‘The temporal and spatial relationships between
climatic parameters and fire occurrence in northeastern
Iran’, Ecological Indicators, 118(June), p. 106720. doi:
10.1016/j.ecolind.2020.106720.
Ferreira, C. (2001) ‘Gene expression programming: a new
adaptive algorithm for solving problems’, arXiv
preprint cs/0102027.
Gholamnia, K. et al. (2020) ‘Comparisons of diverse
machine learning approaches for wildfire susceptibility
mapping’, Symmetry, 12(4), 604. doi: 10.3390/
SYM12040604.
Ghorbanzadeh, O. et al. (2019) ‘Spatial prediction of
wildfire susceptibility using field survey gps data and
machine learning approaches’, Fire, 2(3), pp. 1–23. doi:
10.3390/fire2030043.
Hong, H. et al. (2017) ‘A comparative assessment between
linear and quadratic discriminant analyses (LDA-QDA)
with frequency ratio and weights-of-evidence models
for forest fire susceptibility mapping in China’, Arabian
Journal of Geosciences, 10(7), 167. doi: 10.1007/s
12517-017-2905-4.
Hong, H., Jaafari, A. and Zenner, E. K. (2019) ‘Predicting
spatial patterns of wildfire susceptibility in the
Huichang County, China: An integrated model to
analysis of landscape indicators’, Ecological Indicators,
101, pp. 878–891. doi: 10.1016/j.ecolind.2019.01.056.
Hosseini, M. and Lim, S. (2021) ‘Gene expression
programming and ensemble methods for bushfire
susceptibility mapping: a case study of Victoria,
Australia’, Geomatics, Natural Hazards and Risk, 12,
pp. 2367–2386. doi: 10.1080/19475705.2021.1964618.
Hosseini, M. and Lim, S. (2022) ‘Gene expression
programming and data mining methods for bushfire
susceptibility mapping in New South Wales, Australia’,
Natural Hazards, 113(2), pp. 1349–1365. doi:
10.1007/s11069-022-05350-7.
Jaafari, A. et al. (2019) ‘Wildfire Probability Mapping:
Bivariate vs. Multivariate Statistics’, Remote Sensing,
11(6), 618. doi: 10.3390/rs11060618.
Jaafari, A., Gholami, D. M. and Zenner, E. K. (2017) ‘A
Bayesian modeling of wildfire probability in the Zagros
Mountains, Iran’, Ecological Informatics, 39, pp. 32–
44. doi: 10.1016/j.ecoinf.2017.03.003.
Jaafari, A. and Pourghasemi, H. R. (2019) ‘Factors
Influencing Regional-Scale Wildfire Probability in
Iran’, in Spatial Modeling in GIS and R for Earth and
Environmental Sciences. Elsevier, pp. 607–619. doi:
10.1016/b978-0-12-815226-3.00028-4.
Jain, P. et al. (2020) ‘A review of machine learning
applications in wildfire science and management
‘Environmental Reviews, 28(4), pp.478-505. doi:
10.1139/er-2020-0019.
Leuenberger, M. et al. (2018) ‘Environmental Modelling &
Software Wild fire susceptibility mapping: Deterministic
vs. stochastic approaches’, Environmental Modelling
and Software, 101, pp. 194–203.
MODIS Fire, (2020). ‘MODIS Active Fire and Burned Area
Products - Home’, www.modis-fire.umd.edu. Accessed
16 Nov. 2022.
Peace, M. and Mills, G. (2012) ‘A case study of the 2007
Kangaroo Island bushfires’, CAWCR Technical Report
No. 053, pp. 58. Available at: http://www.
cawcr.gov.au/technical-reports/CTR_053.pdf.
Razavi-Termeh, S. V., Sadeghi-Niaraki, A. and Choi, S. M.
(2020) ‘Ubiquitous GIS-based forest fire susceptibility
mapping using artificial intelligence methods’, Remote
Sensing, 12(10). doi: 10.3390/rs12101689.
Tehrany, M. S. et al. (2019) ‘A novel ensemble modeling
approach for the spatial prediction of tropical forest fire
susceptibility using LogitBoost machine learning
classifier and multi-source geospatial data’, Theoretical
and Applied Climatology, 137(1–2), pp. 637–653. doi:
10.1007/s00704-018-2628-9.
Tonini, M. et al. (2020) ‘A machine learning-based
approach for wildfire susceptibility mapping. The case
study of the liguria region in italy’, Geosciences
(Switzerland), 10(3). doi: 10.3390/geosciences
10030105.
Valdez, M. C. et al. (2017) ‘Modelling the spatial
variability of wildfire susceptibility in Honduras using
remote sensing and geographical information systems’,
Geomatics, Natural Hazards and Risk, 8(2), pp. 876–
892. doi: 10.1080/19475705.2016.1278404.
Zhang, G., Wang, M. and Liu, K. (2019) ‘Forest Fire
Susceptibility Modeling Using a Convolutional Neural
Network for Yunnan Province of China’, International
Journal of Disaster Risk Science, 10(3), pp. 386–403.
doi: 10.1007/s13753-019-00233-1.
Zhang, Y., Lim, S. and Sharples, J. J. (2016) ‘Modelling
spatial patterns of wildfire occurrence in South-Eastern
Australia’, Geomatics, Natural Hazards and Risk, 7(6),
pp. 1800–1815. doi: 10.1080/19475705.2016.1155501.
Bushfire Susceptibility Mapping Using Gene Expression Programming and Machine Learning Methods: A Case Study of Kangaroo Island,
South Australia
127
