
Towards Effective Traffic Signal Safety and Optimization Using Fisheye
Video
Rahul Sengupta
a
, Tania Banerjee
b
, Ke Chen, Yashaswi Karnati
c
, Sanjay Ranka
d
and Anand Rangarajan
e
Department of Computer and Information Science & Engineering, University of Florida, Gainesville, FL, U.S.A.
fl
Keywords:
Simulation and Modeling, Data Mining and Data Analysis, Modeling, Simulation, Control of Pedestrians and
Cyclists.
Abstract:
Most traffic authorities across the US usually collect high-resolution (10 Hz) loop detector and signal state
data and video data. The multiple modalities of data that are readily available can be utilized for better traffic
operations management and improving safety. In this work, we show that the fusion of widely deployed loop
detector data with trajectory information collected through video cameras can augment intersection safety and
operational efficiency analysis. The additional information that can be extracted from the object’s (vehicle and
pedestrian) trajectory derived from video data when fused with signal state data leads to several interesting
safety analyses. Data analysis shows a significant variance in turn-movement counts, pedestrian behaviors,
vehicle composition, etc., temporally (hour-of-day, day-of-week, etc.) and spatially (approach-wise). We
present a simulation-based approach for customizing signal timing plans based on the traffic behavior at the
intersections at various times. When used to drive simulations in demand generation, we show that the fused
data calibrating the simulation parameters can lead to potential improvements in existing signal timing plans
that match reality and can greatly help improve intersection safety and operational efficiency by providing
planners with data-driven insights.
1 INTRODUCTION
With rapid urbanization ocurring worldwide, the
growing volume of vehicles and increasing complex-
ity of road networks have led to problems such as con-
gestion, traffic jams, and traffic incidents (Rao and
Rao, 2012; Carson et al., 2010). These have been
shown to affect productivity in a negative way and
also the local economy(Weisbrod et al., 2003), soci-
etal well-being (Levy et al., 2010), and the environ-
ment (Zhang and Batterman, 2013). Therefore, the
smooth flow of traffic and safety are important con-
cerns for traffic authorities.
Intelligent Transportation Systems is (ITS) a fast-
growing field (Alam et al., 2016; Borgi et al., 2017)
and some commonly seen aspects of ITS (Gordon,
2016) include:
a
https://orcid.org/0000-0001-9793-5176
b
https://orcid.org/0000-0003-4737-0001
c
https://orcid.org/0000-0002-2512-1250
d
https://orcid.org/0000-0003-4886-1988
e
https://orcid.org/0000-0001-8695-8436
• Use of microprocessor-based traffic signals that
are “coordinated” to optimize traffic flow across
a corridor. These use embedded road sensors to
relay vehicle detection counts
• Collection and storage of high-resolution (10 Hz)
induction loop detector actuations along with de-
tailed signal state information, as well as visual-
ization of derived metrics called Automated Traf-
fic Signal Performance Measures
1
• Use of video cameras (with computer vision pro-
cessing) at intersections to detect traffic signal vi-
olations, vehicle tracking, queue length estima-
tion, etc.
Most traffic authorities across the United States
of America usually collect high-resolution (10 Hz)
loop detectors and signal state data (Figure 1). How-
ever, there are significant drawbacks, such as the in-
ability to collect precise trajectory information, turn-
movement counts, pedestrian walking behaviors, etc.
We focus on using data obtained from fisheye lens
1
Link: atspm.cflsmartroads.com/ATSPM/
54
Sengupta, R., Banerjee, T., Chen, K., Karnati, Y., Ranka, S. and Rangarajan, A.
Towards Effective Traffic Signal Safety and Optimization Using Fisheye Video.
DOI: 10.5220/0011729000003479
In Proceedings of the 9th International Conference on Vehicle Technology and Intelligent Transport Systems (VEHITS 2023), pages 54-63
ISBN: 978-989-758-652-1; ISSN: 2184-495X
Copyright
c
2023 by SCITEPRESS – Science and Technology Publications, Lda. Under CC license (CC BY-NC-ND 4.0)

Figure 1: A sample of high-resolution loop detector and
signal state data.
Figure 2: Table showing the benefits of using fisheye lens
video data compared to the pre-existing high-resolution
loop detector and signal state data.
cameras, which can mitigate some of these deficien-
cies.
As shown in Figure 2, items ‘ a’ and ‘b’ help com-
pute descriptive statistics of the overall intersection
dynamics. Items ‘c’ and ‘d’ are vital for intersection
safety, whereas ‘a’,‘b’, ‘c’, ‘d’, ‘e’, and ‘f’ are es-
sential for building an accurate, calibrated simulation
model for signal timing optimization.
The collection, processing, and application of in-
formation extracted from fisheye video data can be
effectively augmented with high-resolution loop de-
tectors and signal state data for applications in safety
analyses and improving traffic operations. The ad-
ditional information that can be extracted from a
user’s (vehicle or pedestrian) trajectory, such as speed
profiles, vehicle-to-vehicle interactions, vehicle-to-
pedestrian interactions, abrupt braking, etc., can be
helpful to qualitatively and quantitatively understand
intersection safety. Also, this information when com-
bined with signal state data can lead to further inter-
esting analysis, such as red-light violations, vehicle
movements during red clearance intervals, etc.
The use of microscopic simulation to understand
intersection dynamics, including the impact of differ-
ent signal timing plans, is quite common. In order
to ensure that the traffic flow dynamics in a simu-
lator align with real-world observations, incorporat-
ing real-world data into simulations for demand gen-
eration and calibration of simulation parameters is a
crucial aspect. The controller log data can be used
to obtain granular vehicle flow data in the simula-
tor. However, video data can provide accurate turning
movement counts (especially for combined turn lanes
such as through-right turning lanes), vehicle composi-
tions, speed/acceleration profiles, accurate pedestrian
demand, and walking speeds. These can be used to
fine-tune and calibrate the simulation and thus make
it more realistic.
Using data collected from real traffic intersections,
we show that potential improvements in the existing
signal timing can be made using controller log data
and additional information from video data.
We have deployed a fisheye video collection sys-
tem at a vital intersection in a dense urban region
with time-varying vehicular and pedestrian traffic. We
have processed the video obtained and extracted tra-
jectory information for vehicles and pedestrians. Our
data analysis shows a significant variance in turn-
movement counts, pedestrian behaviors, vehicle com-
position, etc., temporally (hour-of-day, day-of-week,
etc.) and spatially (approach-wise). Such analysis can
significantly help improve intersection safety and op-
erational efficiency by providing planners with data-
driven insights. The overall system flowchart is pre-
sented in Figure 3. The main contributions of the pa-
per are as follows:
• We quantitatively and qualitatively present safety
analyses at an intersection by fusing controller log
data with trajectory information obtained through
video cameras.
• We present a simulation-based approach for cus-
tomizing signal timing plans at an intersection at
various times. When used to drive simulations,
the fused data can lead to potential improvements
in existing signal timing plans that match reality.
The rest of the paper is organized as follows. Sec-
tion 2 discusses the background information. Sec-
tion 3 presents the details of our field implementation.
We also review the data obtained and present some
descriptive statistics. We describe the application of
the data obtained to intersection safety in Section 4
and signal timing optimization in Section 5. We con-
clude and present future work in Section 6.
2 BACKGROUND
We now discuss the data collection methodology and
the simulation software.
Towards Effective Traffic Signal Safety and Optimization Using Fisheye Video
55
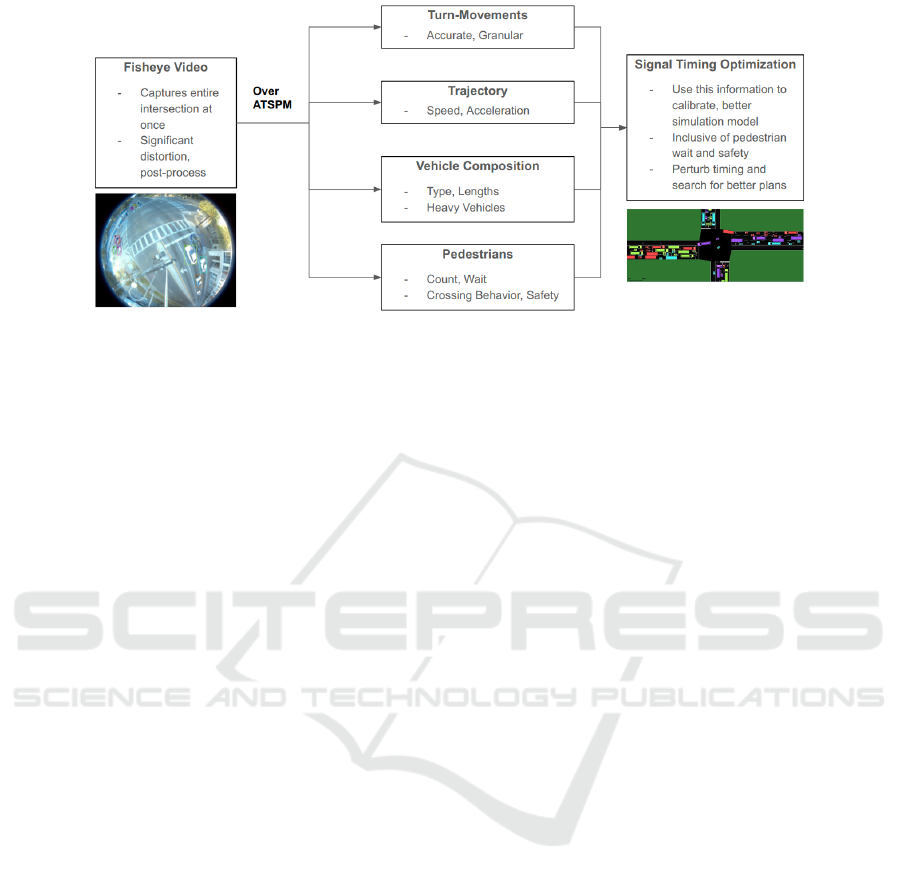
Figure 3: Flowchart showing the workflow for using fisheye video data to improve safety and signal timing of an intersection
using a traffic microsimulation framework. Fisheye video data provides vital information on different aspects of the intersec-
tion dynamics, which can then be used to improve modeling.
2.1 Fisheye Lens Camera Data:
Collection and Processing
A fisheye lens is a type of camera lens that produces
a distortion that allows for an ultra-wide-angle field
of view, often 100 to 180 degrees. This allows a sin-
gle camera to capture a much larger scene than regu-
lar camera lenses. Such lenses are often paired with
video cameras to record the dynamics of traffic inter-
sections. Additional video processing techniques are
required to perform object-tracking in such distorted
videos.
While computer vision using regular non-
distorted video data at traffic intersections is well-
explored (Mondal et al., 2019; Buch et al., 2011; San-
thosh et al., 2020), there needs to be more research
using fisheye video data. (Huang et al., 2020) uses
an integrated two-stream convolutional networks ar-
chitecture that performs real-time detection, tracking,
and near-accident detection of different road users
(pedestrains and vehicles) in traffic video from a fish-
eye lens camera; (Yeh et al., 2020) details a sys-
tem for automatically identifying and tracking vehi-
cles and processing their trajectories; (Chen et al.,
2021) describes a visualization tool for analyzing tra-
jectories from fisheye video data; (Zhao et al., 2021)
discusses a system for pedestrian detection and re-
identification.
In our video processing pipeline based on (Chen
et al., 2021; Huang et al., 2020), raw video data from
the fisheye lens was processed, and trajectory infor-
mation of vehicles and pedestrians was obtained. Ob-
ject detection was done using YOLOV4(Bochkovskiy
et al., 2020) Deep Neural Network, and multiple-
object tracking was built upon Deep SORT(Wojke
et al., 2017). Camera calibration was performed, and
landmark points were mapped from the fisheye cam-
era image of the intersection to the top-view satel-
lite map image of the intersection. Thin-Plate Spline
(Bookstein, 1989; Chui and Rangarajan, 2000) was
used as the basis function for coordinate mappings
from the reference to the target. Thus, object trajecto-
ries seen in the fisheye videos were projected onto the
satellite map of the intersection. Outlier detection and
smoothing techniques were used to stabilize trajecto-
ries. Manual annotation and checking were also per-
formed to get a final accuracy of over 95 percent for
detecting vehicles and pedestrians. The details of the
performance of the vision processing algorithms can
be found in (Chen et al., 2021; Huang et al., 2020).
2.2 Traffic Simulation Software
Traffic simulation frameworks (US DOT FHWA,
2020; DLR, 2020) are computational implementa-
tions of traffic models with dynamic components (ve-
hicles, traffic signals, pedestrians, etc.) and static
components (road geometry and linkages, etc.). A
traffic simulation consists of a traffic scenario with
a base map that defines the static features, such as
the topology of roads with lanes, junctions that con-
nect these roads, etc. These static components usu-
ally remain the same in the short term (i.e., in sec-
onds or minutes). On this base map, dynamic com-
ponents usually change their states based on prede-
fined behaviors (i.e., cars will change their locations
based on their speeds and accelerations, traffic sig-
nals will change their light configuration based on the
signal plan, etc.). The simulation is started and is al-
lowed to evolve in time. We can thus simulate a vari-
VEHITS 2023 - 9th International Conference on Vehicle Technology and Intelligent Transport Systems
56

ety of base maps and behaviors and estimate different
measures of effectiveness (such as queue lengths and
travel times).
One such essential simulation software is Sim-
ulation of Urban MObility (SUMO) (Lopez et al.,
2018). SUMO is an open-source, microscopic, agent-
based road traffic simulation package that is de-
signed to handle large road networks. SUMO uses
its file formats for traffic networks, but it can im-
port files encoded in other popular formats like Open-
StreetMap (OpenStreetMap contributors, 2017), VIS-
SIM (Lownes and Machemehl, 2006) etc. SUMO is
implemented in C++ and uses only portable libraries,
thus making it lightweight and fast. SUMO is single-
threaded, i.e., it uses only one CPU core, but several
parallel SUMO processes can be spawned, allowing
for parallel simulations.
3 FIELD IMPLEMENTATION
AND DESCRIPTIVE
STATISTICS
A critical intersection at a major urban center in
the United States of America was analyzed for this
demonstration. The intersection borders a large uni-
versity. Several residential complexes and commer-
cial establishments (especially restaurants) in the area
give rise to significant pedestrian traffic and vehicular
traffic. On the median, a single fisheye video camera
is mounted 13 feet (3.96 meters) above the intersec-
tion at the southbound approach.
Raw data from the intersection (fisheye video
data, high-resolution loop detector, and signal state
data) was captured and stored in a cloud database.
Three weeks of data, spanning October-November
2021, with time ranges from 6 am to 8 pm, was con-
sidered. This time range captures the AM (morning),
PM (evening), and midday traffic peaks but also en-
sures sufficient ambient light for the camera to func-
tion. The Major flow (i.e., North-South direction)
usually sees higher flows than the Minor flow (i.e.,
East-West direction), with the Major flow (North-
South combined) reaching 1400-1800 vph (vehicles
per hour) at peak and Minor flow (East-West com-
bined) reaching 800-1200 vph.
We then analyze the data given the hour-of-day
and day-of-week. We look for both variations and
similarities. These will help us identify periods where
significant pedestrian traffic co-exists with vehicu-
lar traffic and also inform us where segmented cus-
tomized signal timing plans may be needed.
4 APPLICATION TO IMPROVE
INTERSECTION SAFETY
Fisheye cameras provide a crucial piece of informa-
tion: turn-movement counts. This data is challeng-
ing to obtain from loop-detector-based ATSPM data
without exit detectors. Intersections frequently have
lanes that accommodate multiple movements, such as
the right-most lane allowing through and right-turning
traffic. Fisheye lens tracking can count these vehi-
cles, which loop detectors cannot differentiate. Fish-
eye data is necessary to analyze direction-wise flows
(see Figure 4). In addition, fisheye cameras also al-
low us to track individual pedestrians. This allows us
to estimate the number of pedestrians crossing in var-
ious directions. This contrasts with ATSPM data that
tracks the number of pedestrian calls but has no way
of estimating the actual number of pedestrians (Figure
5, Figure 7). With accurate trajectories of vehicles
and pedestrians, it is possible to study, both qualita-
tively and quantitatively, the safety aspects of the in-
tersection. Visualizations (Figure 4, Figure 5, Figure
7) can help determine overlapping times and direc-
tions where vehicles and pedestrians have intersect-
ing trajectories. This can support traffic authorities
in modifying intersection signaling (e.g., restricting
right turns, etc.) for those times and directions.
Standard safety metrics(Mullakkal Babu et al.,
2017) such as Time-To-Collision (TTC) and Post-
Encroachment Time (PET) can also be calculated.
Our intersection safety research (Banerjee et al.,
2022) has involved computing TTC and PET, along
with other factors such as speed, deceleration, prox-
imity between conflicting users, to determine severe
events. These metrics are solely obtainable from
trajectory datasets that are processed through video.
In (Mishra et al., 2022), we presented a study that
showed how the day of the week and time of day can
affect the frequency and severity of events at intersec-
tions. This analysis enables us to pinpoint the busiest
periods and conflict-prone locations at intersections.
The data can then be utilized to evaluate safety coun-
termeasures with minimal disruption to intersection
efficiency.
The fisheye video also lets us detect heavy motor
vehicles, i.e., large vehicles such as delivery trucks
and buses (Figure 6). These large vehicles often
have a long braking distance and significant blind
spots. Given that this intersection borders the Uni-
versity and has several shopping and eating locations
nearby, these large vehicles may pose a safety concern
for pedestrians. Their movement can be restricted or
rerouted based on such data. Using this information
to adjust signal timing plans for transit priority is also
Towards Effective Traffic Signal Safety and Optimization Using Fisheye Video
57

Figure 4: Heatmap showing the intensity of vehicles per hour for various hours of the day across the week. We can see
that the Southbound-through direction has a larger AM peak, and the Northbound-through direction sees a larger PM peak.
This is likely because the University is south of the intersection, with people coming to work in the morning and leaving
in the evening. Similarly, for Southbound-Right and Northbound-Right directions, we can see that both AM and PM peaks
for Southbound-Right are larger. Loop detectors do not usually capture right turns as they share the same lane as through
movements. Right turns are vital for pedestrian safety, as drivers may neglect pedestrians while focusing on merging at the
right turn.
possible. Thus, we have seen the usefulness of fish-
eye lens camera videos in providing us with statis-
tics and visualizations of various road users, includ-
ing heavy vehicles and pedestrians. Such analysis can
lead to better policy decisions, especially for pedes-
trian safety.
5 APPLICATION TO SIGNAL
TIMING OPTIMIZATION
In this section, we present our efforts in utilizing the
fisheye lens camera data for modeling the intersection
dynamics in simulation. We can then vary various sig-
nal timing parameters to improve performance.
We build a simulation (Figure 9) of the chosen in-
tersection. We then input flows by the cycle with the
correct turn-movement counts. We also replicate the
effect of pedestrian calls within the ring-and-barrier
actuated signal timing plan we have implemented in
the simulation. Using bounding box information, we
can further calibrate vehicle lengths and types in the
simulation.
Significant variations in different aspects of traf-
fic patterns will indicate to us that customized signal
timing plans may be required. The similarities across
such sections suggest which signal timing plan can be
effectively applied in the future. We plot and analyze
the weekly traffic throughput in Figure 10. This leads
us to identify four crucial stable high-volume traffic
patterns:
• Weekday AM peak,
• Weekday midday peak
• Weekday PM peak
• Weekend PM peak
VEHITS 2023 - 9th International Conference on Vehicle Technology and Intelligent Transport Systems
58
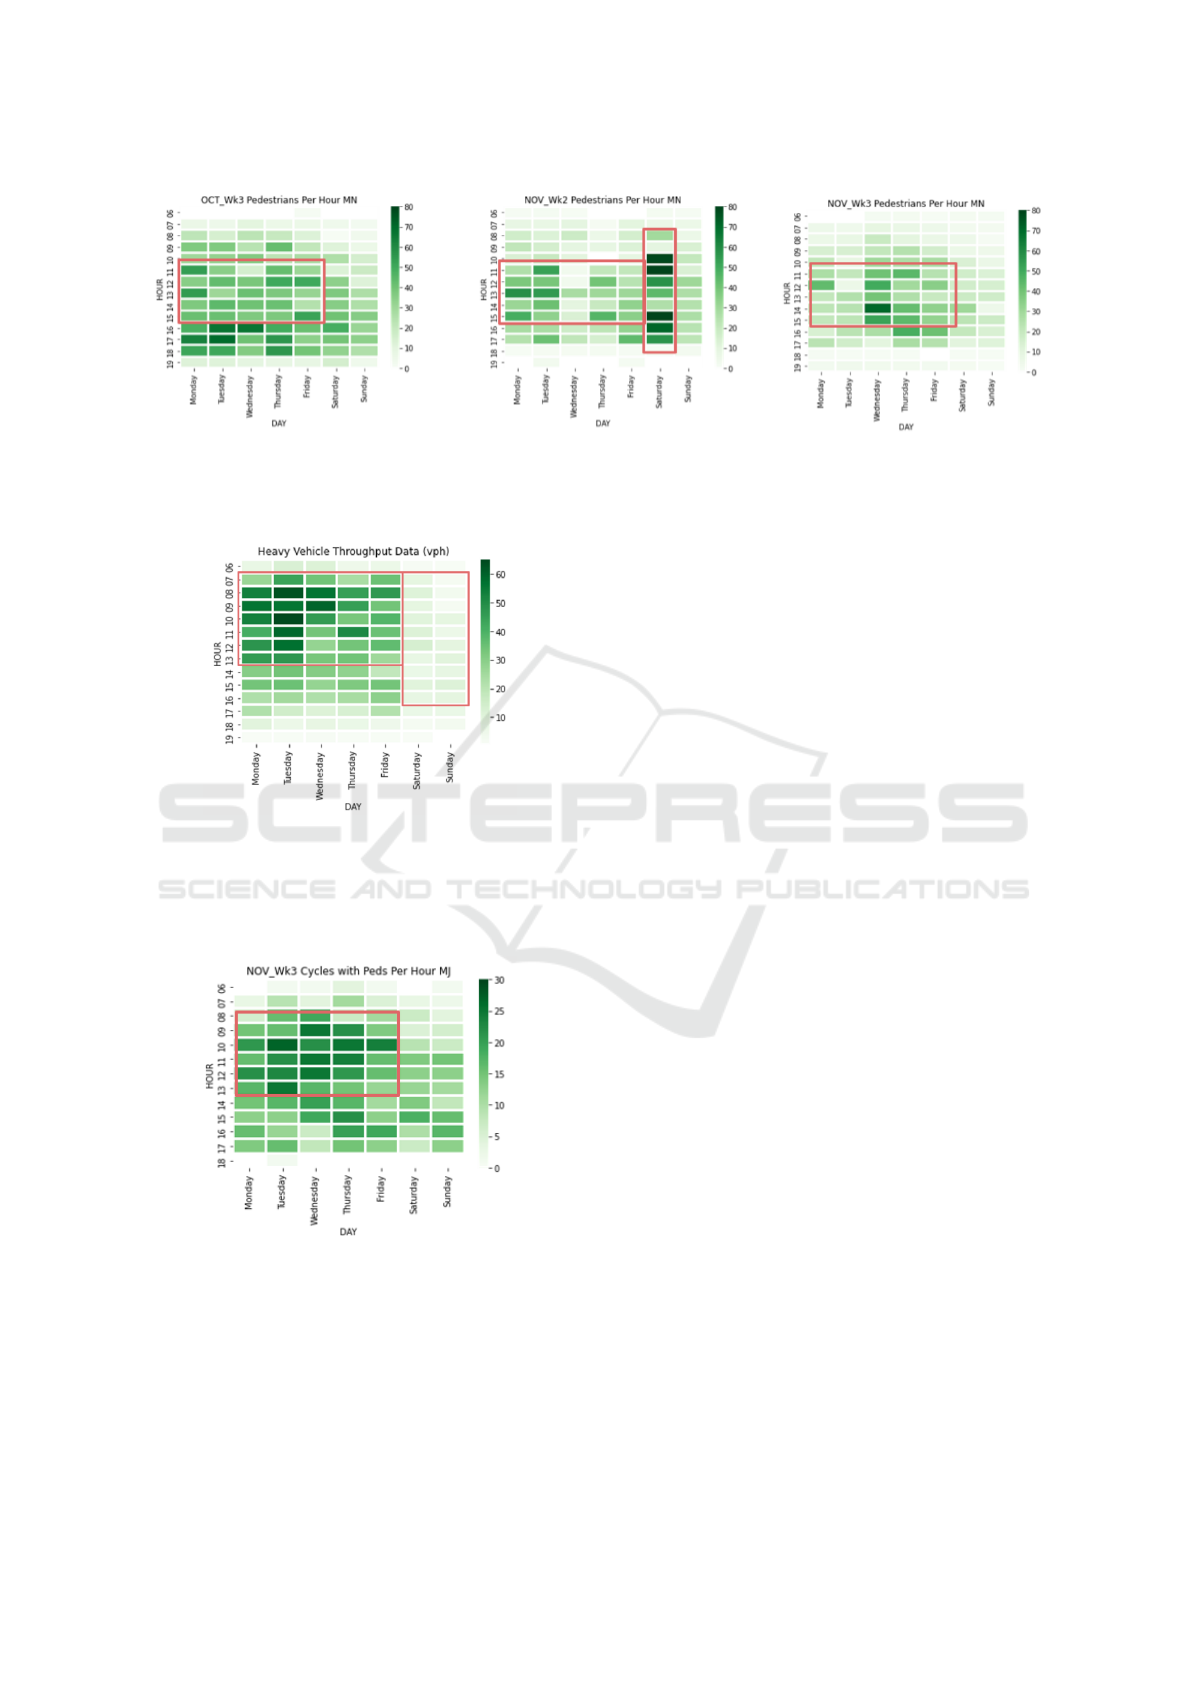
Figure 5: Heatmap showing the intensity of pedestrians per hour for various hours of the day, across three weeks along the
Minor Phase (i.e., East-West direction). We see high activity around lunch hours on weekdays. An unusual peak was seen on
Saturday in the second week of November. This can be explained due to an important football game that day. Such anomalies
can be inferred from this data.
Figure 6: Heatmap showing the intensity of heavy vehicles
per hour for various hours of the day across the week. We
can see that heavy vehicles are usually limited to weekday
mornings. Additional measures, such as restricting right-
turns, re-routing, etc., can be put into effect at those times
for safety reasons.
Figure 7: Heatmap showing the number of pedestrian calls
per hour for various hours of the day across three weeks
along the Major Phase (i.e., North-South direction). We see
high activity around lunch hours on weekdays, where al-
most every cycle has a pedestrian call. Customized signal
behavior (turn restrictions etc.) and timing plans can be im-
plemented.
We simulate these scenarios with their respective
signal timing plans, vehicle flow patterns, and pedes-
trian call patterns. We vary the barrier times (sepa-
rating the major and minor phase rings in the Ring-
and-Barrier signal plan) across a reasonable range of
values and see the effect on the trade-off between the
major and minor phase wait times.
We first see the impact of introducing pedestrian
calls (Figure 8) and ignoring them. We can see an
apparent effect of including pedestrian calls. Pedes-
trians require significant time to cross the road (here,
30 seconds) safely. The ring-and-barrier configura-
tion shown, including pedestrian calls within a cycle,
ensures lower time for the left-turning phases that pre-
cede them (in both major and minor directions). We
can see that because this non-negotiable amount of
time (here, 30 seconds) must be provided to serve the
pedestrian calls, barrier times that previously had ac-
ceptable wait times for left-turning traffic are now un-
acceptable. Hence, these barrier times can no longer
be viable when considering pedestrian calls. Thus,
the inclusion of pedestrian calls is vital during simu-
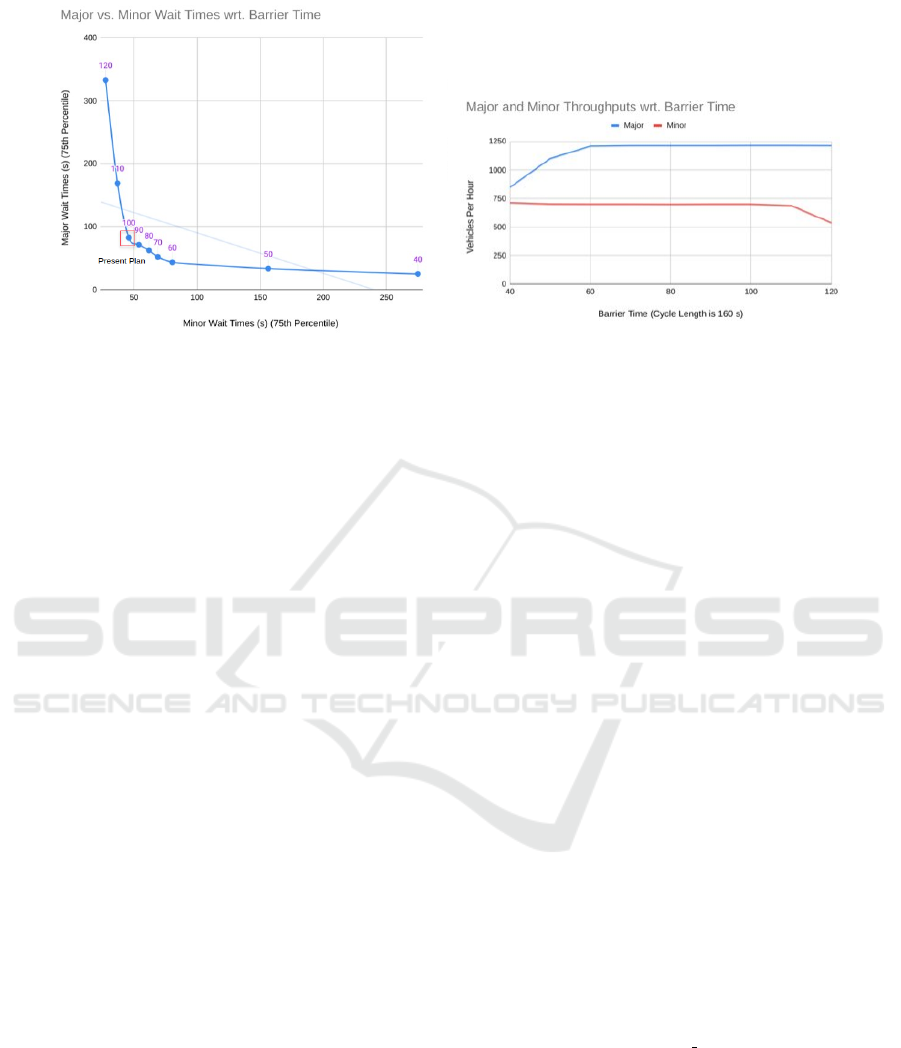
lation. We present the simulation results for the four
critical traffic times we identified. The ”Major vs.
Minor Wait Times wrt. Barrier Time” plots show
the trade-off for (75th percentile) wait times of ma-
jor and minor streets (Figures 11, 12). The ”Major
and Minor Throughputs wrt. Barrier Time” plot on
the right shows the change in throughput when the
barrier time is changed. Thus, it is possible to un-
derstand the trade-off between the Major and Minor
phase traffic flows in terms of wait times and through-
puts (Figures 11, 12). Ideally, we want to lower
significant wait times while not massively increasing
minor phase wait times and while not lowering the
throughput.
Towards Effective Traffic Signal Safety and Optimization Using Fisheye Video
59

Figure 8: Given the ring-and-barrier scheme at this intersection, left turns are affected by the inclusion of pedestrian calls.
The ring structure of the signal timing plan is shown at the bottom of the figure. The pedestrians cross parallel to the moving
traffic, i.e., left-turning traffic does not interact with pedestrians for safety reasons. Hence, the left-turning phases, i.e., 1/5
and 3/7, get less when pedestrian calls are made since a non-negotiable pedestrian crossing time (here, 30 seconds) must be
given. Further, barrier time restricts the total time the half-rings (i.e., major(1/5 and 2/6) and minor(3/7 and 4/8) halves) get.
Taking an extreme barrier time of 40 seconds means 2/6 must get at least 30 seconds (when pedestrian calls are considered),
leaving just 10 seconds for 1/5. Hence, there is a very high wait time of 642 seconds for left-turning traffic. Had pedestrian
calls not been included in the simulation, the same situation would have given us a wait time of 130 seconds. Hence, it is
important to include the impact of pedestrian calls while analyzing the trade-off between major and minor street wait times.
Figure 9: Replication of intersection geometry and flows in
SUMO simulator. The intersection base map was manually
made. The traffic information was automatically extracted
and fed to SUMO.
6 CONCLUSION AND FUTURE
WORK
Fisheye data provides additional information about
the intersection dynamics, such as accurate turn-
movement counts and flows, vehicle lengths, and
pedestrian information. Unlike regular non-distorted
cameras, of which several are required to capture the
intersection view, a single fisheye lens camera can be
used instead. But there are significant issues due to
the fisheye distortion. However, these can be over-
come using the latest computer vision and smoothing
techniques to yield accurate trajectories, speeds, and
Figure 10: Overall traffic throughput shows four high-
volume times for analysis: weekday AM peak, weekday
midday peak, weekday PM peak, and weekend PM peak.
Efforts can be focused on managing the traffic at these
times.
acceleration profiles of vehicles and pedestrians.
This data fusion with widely available controller
log data is valuable to traffic engineers and city au-
thorities, as it provides new insights into traffic (ve-
hicular and pedestrian) behavior and safety. These
two data sources augment each other in various ways
VEHITS 2023 - 9th International Conference on Vehicle Technology and Intelligent Transport Systems
60

(a) Simulations results for Weekday AM Peak. In this scenario, we can see that major phase wait times could be decreased by
lowering the barrier time to 70 or 80 seconds, with a relatively small increase in minor phase wait times. The throughput would
remain unchanged. Beyond 70 seconds, there would be a massive increase in minor phase wait times, with no appreciable
improvement in major wait times.
(b) Simulations results for Weekday Midday Peak. In this scenario, we can see that major phase wait times could be decreased
by lowering the barrier time to 70 or 80 seconds, with a relatively small increase in minor phase wait times. The throughput
would remain unchanged. Beyond 70 seconds, there would be a massive increase in minor phase wait times, with no appre-
ciable improvement in major phase wait times.
(c) Simulations results for Weekday PM Peak. In this scenario, we can see that major phase wait times could be decreased
slightly by lowering the barrier time to 60 or 70 seconds, but with a more significant increase in minor phase wait times. The
throughput would remain unchanged. Beyond 60 seconds, there would be a massive increase in minor phase wait times, with
no appreciable improvement in major phase wait times.
Figure 11: Simulation results for Weekday AM peak, Weekday midday peak, Weekday PM peak.
Towards Effective Traffic Signal Safety and Optimization Using Fisheye Video
61
(a) Simulations results for Weekend PM Peak. In this scenario, we can see that Major phase wait times could be decreased
by lowering the barrier time to 60 or 70 seconds, but with a more significant increase in minor phase wait times. The
throughput would remain unchanged. Beyond 60 seconds, there would be a massive increase in minor phase wait times, with
no appreciable improvement in major phase wait times.
Figure 12: Simulation results for Weekend PM peak.
and, when used together, can be helpful for safety
analysis and aid data-driven traffic operations.
In the near future, we intend to build an end-to-end
system. It will be capable of supporting multi-camera
fisheye data fusion for large intersections. We also
plan to fuse other modalities of data, such as trajec-
tory data. The system will fully automate the tasks of
cleaning, processing, and visualizing the intersection
dynamics and can be easily deployed across several
intersections with minimal manual effort.
ACKNOWLEDGEMENTS
The work was partly supported by NSF CNS 1922782
and by the Florida Department of Transportation
(FDOT) District 5. The opinions, findings, and con-
clusions expressed in this publication are those of the
authors and not necessarily those of FDOT D5.
REFERENCES
Alam, M., Ferreira, J., and Fonseca, J. (2016). Introduc-
tion to intelligent transportation systems. In Intelligent
Transportation Systems, pages 1–17. Springer.
Banerjee, T., Chen, K., Almaraz, A., Sengupta, R., Kar-
nati, Y., Grame, B., Posadas, E., Poddar, S., Schenck,
R., Dilmore, J., Srinivasan, S., Rangarajan, A., and
Ranka, S. (2022). A modern intersection data ana-
lytics system for pedestrian and vehicular safety. In
2022 IEEE 25th International Conference on Intel-
ligent Transportation Systems (ITSC), pages 3117–
3124.
Bochkovskiy, A., Wang, C.-Y., and Liao, H.-Y. M. (2020).
Yolov4: Optimal speed and accuracy of object detec-
tion. ArXiv, abs/2004.10934.
Bookstein, F. (1989). Principal warps: thin-plate splines
and the decomposition of deformations. IEEE Trans-
actions on Pattern Analysis and Machine Intelligence,
11(6):567–585.
Borgi, T., Zoghlami, N., and Abed, M. (2017). Big data for
transport and logistics: A review. pages 44–49.
Buch, N., Velastin, S. A., and Orwell, J. (2011). A review of
computer vision techniques for the analysis of urban
traffic. IEEE Transactions on intelligent transporta-
tion systems, 12(3):920–939.
Carson, J. L. et al. (2010). Best practices in traffic incident
management. Technical report, Federal Highway Ad-
ministration, United States Department of Transporta-
tion.
Chen, K., Banerjee, T., Huang, X., Ding, Z., Varanasi,
V. S., Rangarajan, A., and Ranka, S. (2021). A web-
based visual analytics system for traffic intersection
datasets. International Journal of Big Data Intelli-
gence, 8(1):76–88.
Chui, H. and Rangarajan, A. (2000). A new algorithm for
non-rigid point matching. IEEE Computer Society
Conference on Computer Vision and Pattern Recog-
nition, 2:44–51 vol.2.
DLR (2020). Theory/Traffic Simulations, https://sumo.dlr
.de/docs/Theory/Traffic\
Simulations.html.
Gordon, R. (2016). Intelligent transportation systems.
Cham: Springer.
Huang, X., He, P., Rangarajan, A., and Ranka, S. (2020). In-
telligent intersection: Two-stream convolutional net-
works for real-time near-accident detection in traffic
video. ACM Transactions on Spatial Algorithms and
Systems (TSAS), 6(2):1–28.
Levy, J. I., Buonocore, J. J., and Stackelberg, K. V. (2010).
Evaluation of the public health impacts of traffic con-
VEHITS 2023 - 9th International Conference on Vehicle Technology and Intelligent Transport Systems
62

gestion: a health risk assessment. Environmental
health, 9(1):65.
Lopez, P. A., Behrisch, M., Bieker-Walz, L., Erdmann, J.,
Flotterod, Y.-P., Hilbrich, R., Lucken, L., Rummel,
J., Wagner, P., and Wiessner, E. (2018). Microscopic
Traffic Simulation using SUMO. In IEEE Intelligent
Transportation Systems Conference (ITSC). IEEE.
Lownes, N. E. and Machemehl, R. B. (2006). Vissim:
a multi-parameter sensitivity analysis. In Proceed-
ings of the 2006 Winter Simulation Conference, pages
1406–1413. IEEE.
Mishra, A., Chen, K., Poddar, S., Posadas, E., Rangara-
jan, A., and Ranka, S. (2022). Using video analytics
to improve traffic intersection safety and performance.
Vehicles, 4(4):1288–1313.
Mondal, A., Dutta, A., Dey, N., Sen, S., and Fuqian, S.
(2019). Visual traffic surveillance: A concise sur-
vey. 2019 the 4th International Conference on In-
formation Technology and Intelligent Transportation
Systems, Frontiers in Artificial Intelligence and Appli-
cations.
Mullakkal Babu, F. A., Wang, M., Farah, H., Arem, B., and
Happee, R. (2017). Comparative assessment of safety
indicators for vehicle trajectories on highways. Trans-
portation Research Record Journal of the Transporta-
tion Research Board, 2659.
OpenStreetMap contributors (2017). Website data . https:
//www.openstreetmap.org.
Rao, A. M. and Rao, K. R. (2012). Measuring urban traffic
congestion-a review. International Journal for Traffic
& Transport Engineering, 2(4).
Santhosh, K. K., Dogra, D. P., and Roy, P. P. (2020).
Anomaly detection in road traffic using visual surveil-
lance: a survey. ACM Computing Surveys (CSUR),
53(6):1–26.
US DOT FHWA (2020). Types of Traffic Analysis Tools.
https:// ops.fhwa.dot.gov/trafficanalysistools/ type\ t
ools.htm.
Weisbrod, G., Vary, D., and Treyz, G. (2003). Measuring
economic costs of urban traffic congestion to business.
Transportation research record, 1839(1):98–106.
Wojke, N., Bewley, A., and Paulus, D. (2017). Simple on-
line and realtime tracking with a deep association met-
ric. In 2017 IEEE International Conference on Image
Processing (ICIP), pages 3645–3649.
Yeh, I.-C., Chung, S., Hsu, Y.-P., and Huang, C.-I. (2020).
Event-based surveillance video retrieval through tra-
jectory analysis using fisheye camera. In 2020 IEEE
International Conference on Consumer Electronics-
Taiwan (ICCE-Taiwan), pages 1–2. IEEE.
Zhang, K. and Batterman, S. (2013). Air pollution and
health risks due to vehicle traffic. Science of the to-
tal Environment, 450:307–316.
Zhao, Z., Zhao, Z., Wang, S., Watta, P., and Murphey, Y. L.
(2021). Pedestrian re-identification using a surround-
view fisheye camera system. In 2021 International
Joint Conference on Neural Networks (IJCNN), pages
1–8. IEEE.
Towards Effective Traffic Signal Safety and Optimization Using Fisheye Video
63
