
Adaptive Resolution Selection for Improving Segmentation Accuracy of
Small Objects
Haruki Fujii
a
and Kazuhiro Hotta
b
Meijo University, 1-501 Shiogamaguchi, Tempaku-ku, Nagoya 468-8502, Japan
Keywords:
Adaptive Resolution Selection, Small Objects, Semantic Segmentation, Cell Images, Medical Images.
Abstract:
This paper proposes a segmentation method using adaptive resolution selection for improving the accuracy of
small objects. In semantic segmentation, the segmentation of small objects is more difficult than that of large
objects. Semantic segmentation requires both spatial details to locate objects and strong semantics to classify
objects well, which are likely to exist at different resolution/scale levels. We believe that small objects are
well represented by high-resolution feature maps, while large objects are suitable for low-resolution feature
maps with high semantic information, and propose a method to automatically select a resolution and assign it
to each object in the HRNet with multi-resolution feature maps. We propose Adaptive Resolution Selection
Module (ARSM), which selects the resolution for segmentation of each class. The proposed method considers
the feature map of each resolution in the HRNet as an Expert Network, and a Gating Network selects adequate
resolution for each class. We conducted experiments on Drosophila cell images and the Covid 19 dataset, and
confirmed that the proposed method achieved higher accuracy than the conventional method.
1 INTRODUCTION
Semantic segmentation is the task for assigning a
class label to each pixel in an image. It has a lot
of applications to medicine (Ronneberge et al., 2015;
Milletari et al., 2016), cell biology (Arbelle and Ra-
viv, 2019; Edlund et al., 2021), and in-vehicle video
recognition (Zhao et al., 2017; Badrinarayanan et al.,
2017). Because semantic segmentation assigns class
labels to all pixels in an image, the class imbalance
problem occurs in segmentation. This makes it diffi-
cult to identify objects that appear infrequently in an
image or have a small area.
Dense image prediction tasks such as semantic
segmentation require both spatial details to locate ob-
jects and strong semantics to classify objects, which
are likely to exist at different resolution/scale levels
in CNN(Long et al., 2015; Lin et al., 2017). There-
fore, how to efficiently generate a hierarchy of fea-
tures at different scales is important for handling high-
density prediction tasks. We propose Adaptive Res-
olution Selection Module (ARSM) using the idea of
Gating network (Jacobs et al., 1991) that automati-
cally selects resolution from the HRNet (Sun et al.,
2020). ARSM assigns a adequate resolution to each
class from multi-resolution feature maps in the HR-
a
https://orcid.org/0000-0003-0440-8479
b
https://orcid.org/0000-0002-5675-8713
Net, while considering the tendency of deep neural
networks to detect small objects with high-resolution
feature map and large objects with low-resolution fea-
ture map.
As shown in Figure 1, HRNet repeatedly ex-
changes the information between resolutions by con-
necting convolution streams from higher resolution to
lower resolution in parallel. Therefore, each resolu-
tion in the deepest part of the HRNet is considered
to be rich in both semantic and spatial information.
As shown in Figure 2, the proposed method considers
the feature map of each resolution in the HRNet as
an Expert Network, and outputs segmentation result
at each resolution. On the other hand, the Gating Net-
work automatically divides the multi-class segmenta-
tion into multiple sub-problems, and assigns each res-
olution (Expert Network) to each class. This allows
each Expert Network to solve only a specific problem,
and thus an Expert Network that recognizes small ob-
jects is automatically generated, which is expected to
improve accuracy.
In experiments, we evaluated the pro-
posed method on the Drosophila cell images
(Gerhard et al., 2013) and the COVID-19
(https://medicalsegmentation.com/covid19/, 2020)
dataset. Experimental results showed that the pro-
posed method achieved higher segmentation accuracy
than the conventional method. We also confirmed
that the proposed method automatically divides the
Fujii, H. and Hotta, K.
Adaptive Resolution Selection for Improving Segmentation Accuracy of Small Objects.
DOI: 10.5220/0011736800003417
In Proceedings of the 18th International Joint Conference on Computer Vision, Imaging and Computer Graphics Theory and Applications (VISIGRAPP 2023) - Volume 4: VISAPP, pages
393-400
ISBN: 978-989-758-634-7; ISSN: 2184-4321
Copyright
c
2023 by SCITEPRESS – Science and Technology Publications, Lda. Under CC license (CC BY-NC-ND 4.0)
393

input image into sub-problems and assigns a role to
each Expert Network.
The paper is organized as follows. Section 2
presents related works. Section 3 details the proposed
method. Section 4 shows the results of evaluation ex-
periments. Finally, Section 5 is for conclusion.
2 RELATED WORKS
2.1 Mixture of Experts
Mixture of Experts (MoE) (Jacobs et al., 1991) is
a model that has the strategy of dividing a complex
problem into smaller problems and solving the sim-
pler problems. The MoE consists of an Expert Net-
work E
1
,. . . ,E
n
and a Gating Network G whose output
is an n-dimensional vector. All expert networks must
have the outputs of same size, but the structure of each
expert network need not be the same. The output y of
the MoE is expressed by the following equation.
y =
n
∑
i=1
G(x)
i
E
i
(x) (1)
G(x) = so f tmax(W
T
g
x) (2)
where G(x) is the output of the Gating Network and
E
i
(x) is the output of the i−th Expert Network. G(x)
is the softmax function of inner product of the input
x and the weight matrix W
g
. Thus, it is equivalent to
weighting the output of each Expert Network. This
allows it to be trained more efficiently than a large
single Deep Neural Network (Kumagai et al., 2018;
Hiramatsu et al., 2018). However, MoE has the prob-
lem when we use Deep Neural Networks. The num-
ber of parameters and computational cost increase.
2.2 HRNet
The High-Resolution Net (HRNet) (Sun et al., 2019)
starts with a high-resolution subnetwork (Branch 1)
as shown in Figure 1. HRNet gradually adds high-
resolution to low-resolution subnetworks one by one,
and the number of branches increases and multi-
ple resolution subnetworks are connected in paral-
lel. It maintains high-resolution features, providing
n stages, corresponding n branches and n resolutions.
In this paper, n is set to 4 with reference to the original
paper(Wang et al., 2020).
After input, the width (the number of channels in
the convolutional layer) is increased to 64 by 3 × 3
convolutional layers with stride 1 (see Stem section in
Figure 1). The channel number C (could be selected
as 18, 32 and 48 in HRNet, which represent HR-
NetW18 that W means width, HRNetW32 and HR-
NetW48 respectively) in different branches are in turn
set as C, 2C, 4C and 8C, respectively. On the other
hand, the resolution decreases to H × W , H/2 ×W /2,
H/4 × W /4, and H/8 × W /8. For application to se-
mantic segmentation, the final four output features are
mixed and the result is the output from the multi-scale
semantic information (Sun et al., 2020).
In this paper, we expect small objects to be well
represented by high-resolution feature maps and con-
sider the four resolutions output from HRNet to be
the output of an Expert Network. This method allows
multiple Expert Networks to be prepared in a single
Deep Neural Network, thereby reducing the overall
number of parameters and increasing the computa-
tional cost.
3 PROPOSED METHOD
This paper proposes Adaptive Resolution Selection
Module (ARSM), which selects the output with ad-
equate resolution in HRNet for each class. ARSM
consists of an Expert Network and a Gating Network.
Figure 2 shows the structure of the proposed method.
The model used for the backbone has the same struc-
ture as the HRNet shown in Figure 1, and the structure
up to stage 4 is omitted in Figure 2.
The input of ARSM is five feature maps. In five
feature maps, four are the feature maps X
n
of each
resolution in HRNet where n is the feature map of the
n−th branch from the top. For example, X
2
represents
a feature map, which is the size of H/2 × W /2 with
the second highest resolution. Note that H × W is the
size of the input image. The feature map X
n
is the in-
put to the Expert Network of ARSM, which consists
of 1 × 1 convolutions and outputs the segmentation
result e
n
for each resolution. The remaining one fea-
ture map is the multiscale semantic information ∆X,
which is the concatenation of all feature maps from
each branch in HRNet. The reason for this is that the
Gating Network selects adequate Expert Network for
each class based on the information from all Expert
Networks.
Figure 3 shows the structure of the Gating Net-
work. The Gating Network consists of the same num-
ber of Gating Blocks as the output of the Expert Net-
work, and each Gating Block outputs a feature map
with the same shape as the output of the Expert Net-
work. The input feature maps ∆X of the Gating Net-
work is large in both resolution and number of chan-
nels, so the computational cost of processing in the or-
dinary convolutional layer would be enormous. Thus,
VISAPP 2023 - 18th International Conference on Computer Vision Theory and Applications
394
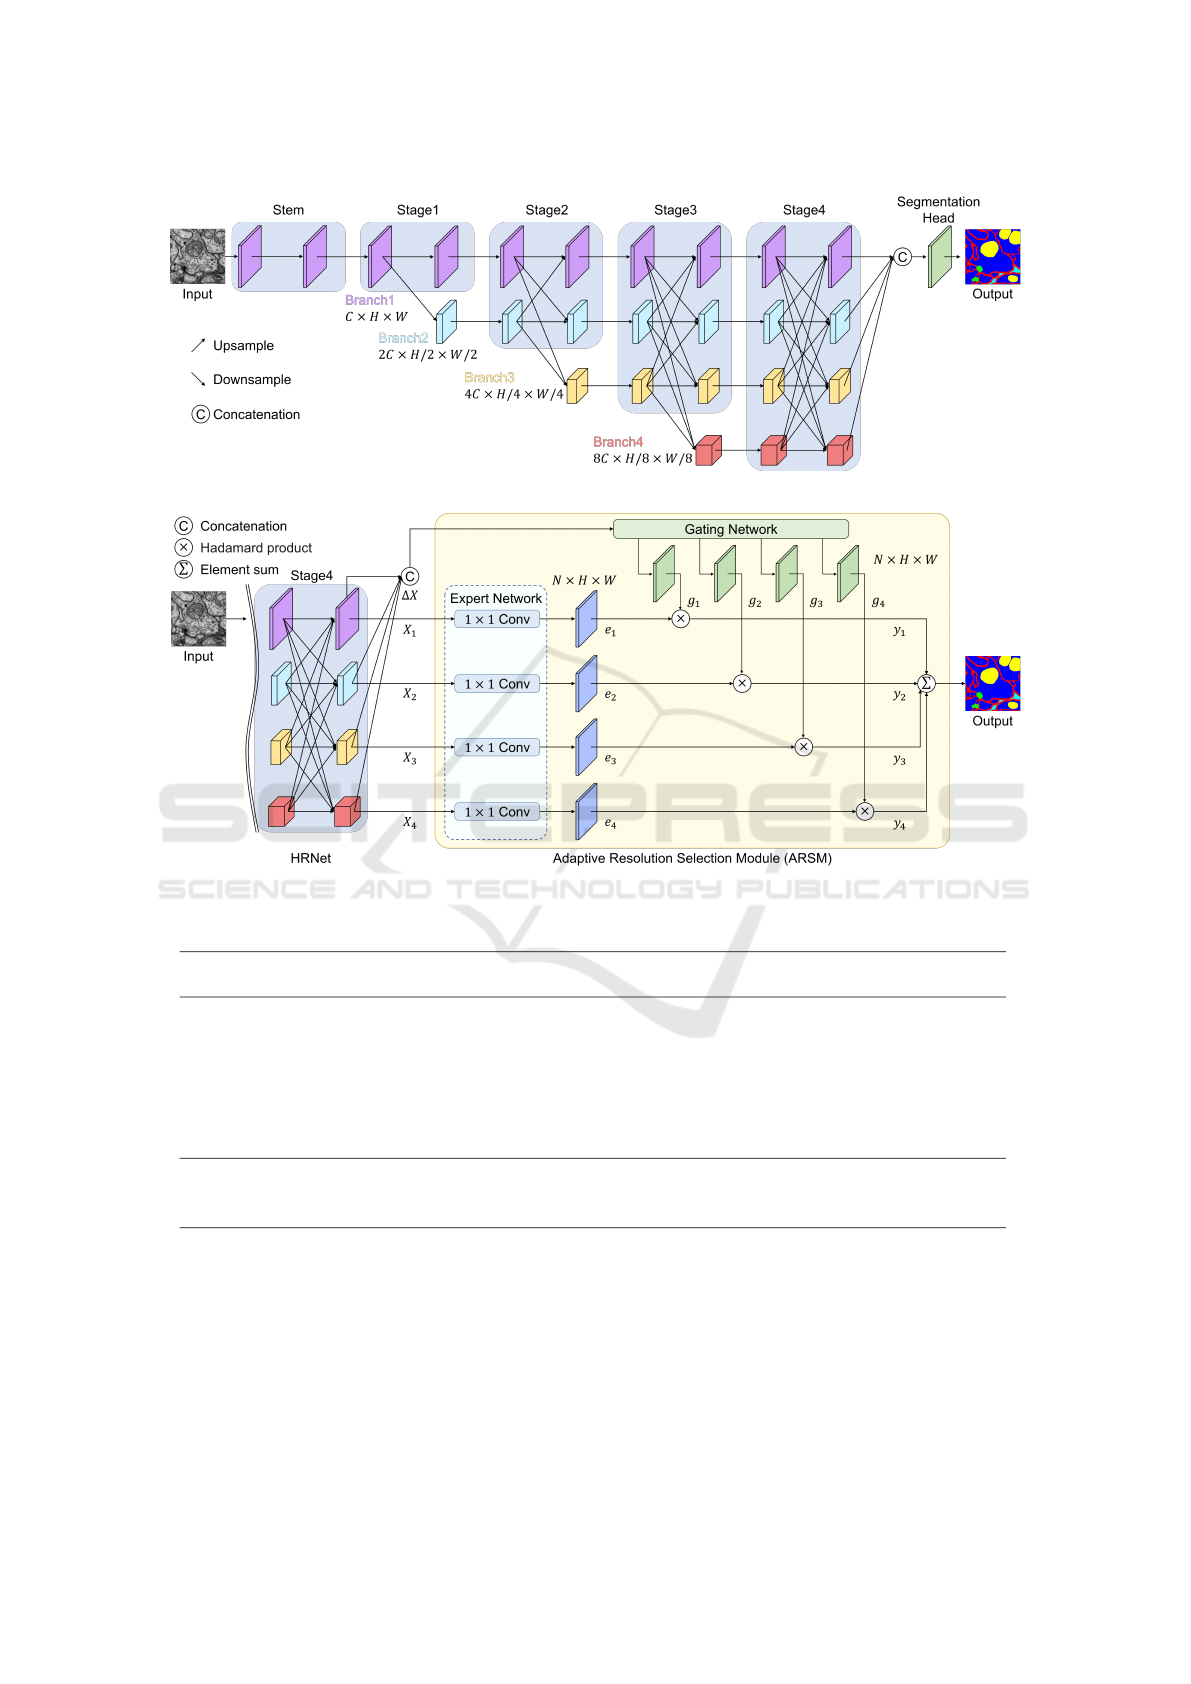
Figure 1: Structure of HRNet.
Figure 2: Structure of ARSM.
Table 1: Comparison results on the Drosophila cell image dataset.
membrane mitochondria synapse
glia/
extracellular intracellular mIoU
HRNetW18 72.07(±1.61) 83.07(±0.85) 44.75(±3.92) 68.38(±1.44) 92.02(±0.44) 72.06(±0.75)
Deeplabv3+ 72.81(±1.57) 83.85(±1.50) 45.07(±3.05) 68.31(±1.67) 92.43(±0.44) 72.49(±0.90)
HRNetW18
+OCR 72.57(±1.33) 83.58(±1.87) 46.18(±1.36) 68.13(±1.61) 92.35(±0.39) 72.56(±0.54)
HRFormer 72.42(±1.84) 82.79(±1.28) 48.71(±3.05) 68.14(±1.80) 92.23(±0.49) 72.86(±1.04)
HRNetW18
+ARSM(ours) 73.29(±1.30) 84.08(±1.87) 49.12(±1.55) 68.76(±1.62) 92.58(±0.38) 73.57(±0.53)
HRNetW32 72.82(±1.42) 83.72(±1.46) 45.88(±3.05) 68.20(±1.90) 92.48(±0.46) 72.62(±0.90)
HRNetW32
+ARSM(ours) 73.35(±1.32) 84.15(±0.78) 49.36(±1.82) 69.00(±1.68) 92.43(±0.37) 73.66(±0.87)
we use the Shuffle Unit(Ma et al., 2018) to reduce
computational complexity in the Gating network.
Each feature map obtained from the Shuffle Unit
has the same number of channels as each output of the
Expert Network in 1 × 1 convolution. The Gumbel
softmax is then used to calculate the importance of
each resolution. Figure 4 shows the computation of
the importance at point p shown as the green boxes in
the j−th channel. The same calculation is performed
for all pixels per channel. Therefore, the output of the
Gating Network G=[g
1
,. . . ,g
n
] can be expressed as
4
∑
i=1
g
ic
j
(x
k j
,y
k j
) = 1. (3)
Adaptive Resolution Selection for Improving Segmentation Accuracy of Small Objects
395
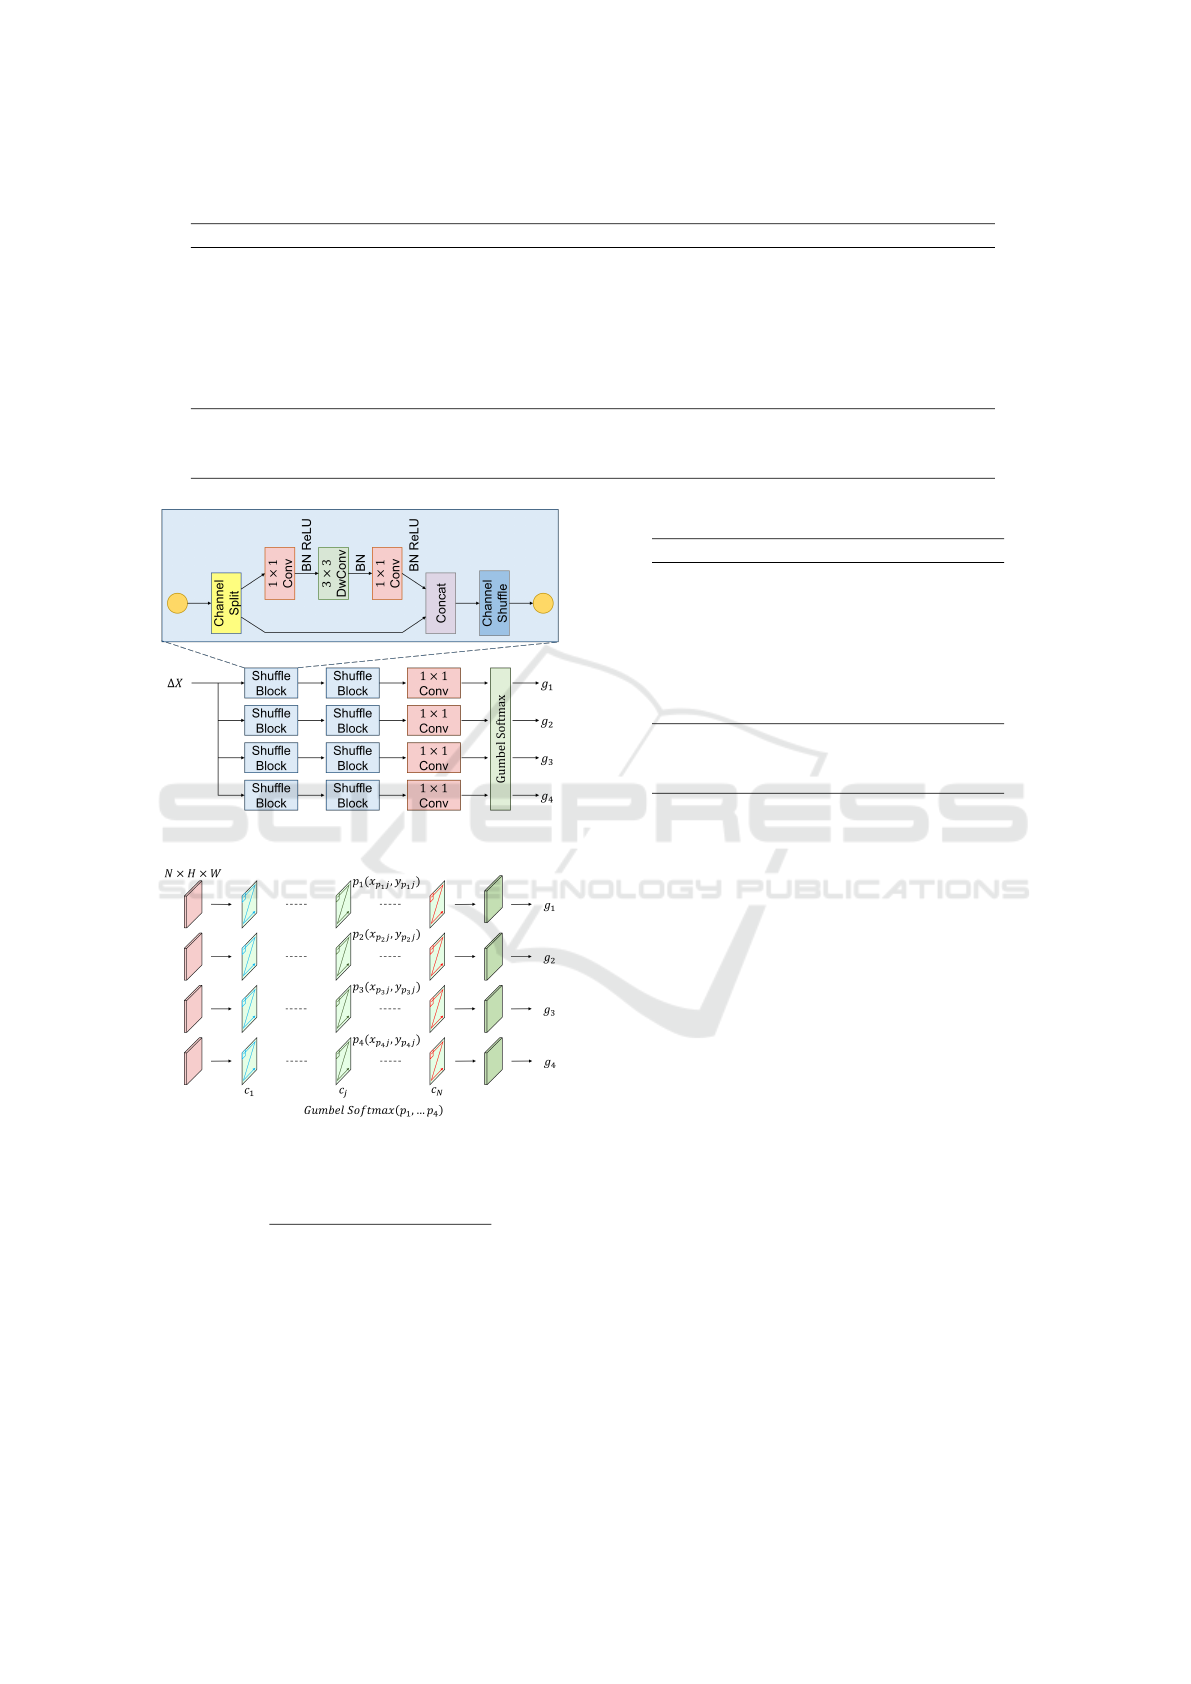
Table 2: Comparison results on the Covid-19 dataset.
background consolidation ground glass pleural effusion mIoU
HRNetW18 95.32(±1.25) 33.02(±2.50) 45.07(±6.23) 7.57(±4.49) 45.24(±1.80)
Deeplabv3+ 94.73(±0.72) 32.16(±2.58) 45.95(±4.75) 8.52(±2.90) 45.34(±0.84)
HRNetW18
+OCR 95.35(±0.84) 34.12(±3.36) 44.78(±5.34) 7.22(±4.58) 45.37(±1.46)
HRFormer 95.50(±0.70) 34.77(±3.25) 46.15(±7.05) 7.29(±3.14) 45.93(±3.54)
HRNetW18
+ARSM(ours) 95.54(±0.63) 37.81(±3.73) 47.05(±7.01) 14.61(±7.31) 48.75(±1.73)
HRNetW32 95.61(±0.94) 34.56(±4.68) 45.82(±6.48) 5.97(±2.95) 45.49(±1.54)
HRNetW32
+ARSM(ours) 95.29(±1.05) 38.06(±3.87) 47.3(±7.01) 14.73(±7.28) 48.85(±1.71)
Figure 3: Structure of Gating Network.
Figure 4: Calculation of the importance of each resolution.
Gumbel softmax is expressed as
p
i
=
exp((log(x
i
) + g
i
)/T )
∑
n
j=1
exp((log(x
j
) + g
j
)/T )
(4)
where g
i
is the sample from the Gumbel distribution
and T is the temperature parameter (T = 0.1 in this
paper). The reason for using Gumbel softmax is to
clarify the role of each Expert Network by weighting
them close to one-hot.
The final output Y of ARSM is the sum
of elemental products of Expert Network’s out-
puts E=[e
1
,. . . ,e
n
] and Gating Network’s output
Table 3: Complexity comparison.
FLOPs(G) param(M)
HRNetW18 63.98 9.44
Deeplabv3+ 264.45 12.61
HRNetW18
+OCR 211.91 12.07
HRFormer 249.51 6.45
HRNetW18
+ARSM(ours) 79.60 9.72
HRNetW32 168.74 29.27
HRNetW32
+ARSM(ours) 197.74 29.79
G=[g
1
,. . . ,g
n
]. It is expressed by the following equa-
tion.
Y =
4
∑
i=1
G
i
(∆X)E
i
(X
i
) (5)
where X
i
is the output feature map from each branch
of HRNet and ∆X is the multiscale semantic informa-
tion that concatenates of all feature maps X
i
. There-
fore, the Gating Network can select feature maps with
adequate resolution at the pixel-level for each class.
4 EXPERIMENTS
4.1 Datasets and Evaluate Measure
We used two datasets in experiments. The first one
is the Drosophila cell image dataset (Gerhard et al.,
2013). This dataset is the Drosophila melanogaster
third instar larva ventral nerve cord taken at serial
section Transmission Electron Microscopy (ssTEM).
The dataset consists of 5 classes; membrane, mito-
chondria, synapse, glia/extracellular and intracellu-
lar. Since the original size is 1024 × 1024 pixels, we
cropped the regions of 256 × 256 pixels from origi-
nal images due to the size of GPU memory. There is
no overlap for cropping regions, and the total number
VISAPP 2023 - 18th International Conference on Computer Vision Theory and Applications
396

Figure 5: Segmentation results on the Drosophila cell image dataset.
of cropped regions is 320. We used 192 regions for
training, 64 for validation and 64 for test. We evalu-
ated our method with 5 fold cross-validation.
The other one is the Covid-19 dataset
(https://medicalsegmentation.com/covid19/, 2020).
It includes 100 axial CT images from more than
40 patients with COVID-19. The size of image is
256 × 256 pixels, and the number of classes is 4;
background, consolidation, ground glass, and pleural
effusion. We used 50 for training, 25 for validation
and 25 for test. We evaluated our method with 4 fold
cross-validation.
The proposed method is evaluated in terms of IoU
of each class and mean IoU (mIoU) which is the av-
erage IoU of all classes.
4.2 Implementation Details
In this paper, the Pytorch library was used and we
trained our method for 1,000 epochs using Adam. The
learning rate was initially set to 0.001, and the batch
size was set to 8.
The model with the highest Mean IoU for the val-
idation set was used for evaluation. Because Gumbel
softmax is calculated using random numbers, we cal-
culated 100 times the Gumbel softmax and used the
average value during the evaluation. Cross Entropy
Loss with Class weight was used as the loss function.
In experiments, the proposed method was com-
pared to HRNet (Sun et al., 2020), Deeplabv3+
(Chen et al., 2018) with HRNet as the backbone,
HRNet with Object-contextual representations (OCR)
(Yuan et al., 2019), and High-Resolution Transformer
(HRFomer) (Yuan et al., 2021). Comparisons with
HRNet were performed by changing the number of
channels to 18 and 32, while other methods use only
HRNetW18 as the backbone.
4.3 Comparison with Other Methods
Tables 1 and 2 show the results on the Drosophila cell
image dataset and Covid-19 dataset. The unit of ac-
curacy in Tables is % and the numbers in parentheses
are the standard deviations of accuracy over cross-
validations. In common with the results in Tables 1
and 2, the proposed method achieved the best accu-
racy in all classes when HRNetW18 was used as the
backbone. The proposed method improved the accu-
racy of Synapse class by 4.37% on the Drosophila cell
image dataset, which is significantly more improved
than other classes. On the other hand, in the Covid-19
dataset, the proposed method improved the accuracy
of pleural effusion by 7.04%, which is significantly
more improved than the other classes. These results
indicate that the proposed method is effective in rec-
ognizing small objects because our method select ad-
equate resolution.
Table 3 shows comparison results about the com-
plexity of each method. We compared the computa-
tional complexity for inputs of size [1 × 256 × 256].
The proposed method is smaller than Deeplabv3+ and
HRNetW18+OCR in both FLOPs and the number of
parameters (param). When we compare the proposed
method with the HRFormer, it is inferior in param but
significantly superior in FLOPs.
Tables 1, 2, and 3 show the results when the model
size is increased by changing the number of channels
in the backbone. The proposed method provided the
largest improvement in accuracy for Synapse class in
the Drosophila cell image dataset and pleural effu-
sion class in the Covid-19 dataset compared to the
other classes. This indicates that the proposed method
is effective regardless of model size. The proposed
method improved the accuracy with a slight increase
in the number of parameters compared to HRNet.
Adaptive Resolution Selection for Improving Segmentation Accuracy of Small Objects
397

Figure 6: Segmentation results on the Covid-19 dataset.
In addition, HRNetW18+ARSM is superior to
HRNetW32 in both accuracy and complexity. The re-
sults show that the proposed ARSM is more efficient
than increasing the backbone model size, indicating
the usefulness of the proposed method.
4.4 Qualitative Results
Figure 5 shows the segmentation results on the
Drosophila cell image dataset by each method. Figure
5 shows that Synapse class was improved by the pro-
posed method compared to the conventional methods.
Figure 6 shows the segmentation results on the Covid-
19 dataset by each method. Figure 6 shows that the
segmentation of pleural effusion class was improved
by the proposed method compared to the conventional
methods. This is because our method select adequate
resolution for each class.
We also visualized the feature maps to ascer-
tain which resolution map is selected for each class.
Figure 7 and 8 show the visualization results of
Y=[y
1
,. . . ,y
4
] obtained by the element product be-
tween the output E=[e
1
,. . . ,e
4
] of the Expert Net-
work and the output G=[g
1
,. . . ,g
4
] of the Gating Net-
work on Drosophila cell image dataset and Covid-19
dataset. The input image is the same as shown in Fig-
ure 5 and 6. In this visualization, normalization was
performed between the channels at each resolution.
In other words, we normalized between the four fea-
ture maps (256 × 256 × 4 pixels) in the n-th channel
of y
1
to y
4
. Note that y
1
is the highest resolution and
y
4
is the lowest resolution. Therefore, the number of
visualization results corresponds to the number of res-
olutions × the number of classes. We normalized the
feature map from 0 to 1 and painted red to the pix-
els that are close to 1 and blue to the pixels that are
close to 0. Since the channels in semantic segmenta-
tion correspond to class labels, this process allows us
to check which output is responsible for which class.
Figure 7 shows that membrane is handled by y
2
,
mitochondria is handled by y
4
, synapse is handled by
y
3
, and glia/extracellular is handled by y
2
. Intracel-
lular is handled by y
1
at the boundaries with other
classes, and the other large areas are handled by y
2
,
y
3
and y
4
. Figure 8 shows that the background is han-
dled by y
1
and y
4
, consolidation and ground glass are
handled by y
3
, and Pleural effusion is handled by y
2
.
The results of Figures 7 and 8 show that object
boundaries and small objects are processed at high
resolution. The visualization results show that differ-
ent role is assigned by ARSM to each resolution. The
results demonstrated the effectiveness of ARSM.
5 CONCLUSION
In this paper, we proposed Adaptive Resolution Se-
lection Module (ARSM), which selects adequate res-
olution for segmentation to each class. The proposed
method considers the feature map of each resolution
in the HRNet as an Expert Network, and the Gating
Network selects an appropriate Expert Network for
each class. This allows each Expert Network to solve
only certain problems and improved the accuracy by
automatically generating Expert Networks that rec-
ognize small objects. In addition, this paper evalu-
ates the accuracy on two datasets with different image
properties, and demonstrated the effectiveness of our
method. This indicates that ARSM is a highly versa-
tile analysis method.
VISAPP 2023 - 18th International Conference on Computer Vision Theory and Applications
398

Figure 7: Visualization results of feature maps weighted by ARSM’s Gating Network on the Drosophila cell image dataset.
Figure 8: Visualization results of feature maps weighted by ARSM’s Gating Network on the Covid-19 dataset.
ACKNOWLEDGEMENTS
This work is supported by KAKENHI Grant Number
22H04735.
REFERENCES
Arbelle, A. and Raviv, T. R. (2019). Microscopy cell seg-
mentation via convolutional lstm networks. In IEEE
Adaptive Resolution Selection for Improving Segmentation Accuracy of Small Objects
399

16th International Symposium on Biomedical Imag-
ing, pages 1008–1012.
Badrinarayanan, V., Kendall, A., and Cipolla, R. (2017).
Segnet: A deep convolutional encoder-decoder archi-
tecture for image segmentation. In Pattern Analysis
and Machine Intelligence, volume 39, pages 2481–
2495.
Chen, L. C., Zhu, Y., Papandreou, G., Schroff, F., and
Adam, H. (2018). Encoder-decoder with atrous sepa-
rable convolution for semantic image segmentation. In
Proceedings of the European conference on computer
vision, pages 801–818.
Edlund, C., Jackson, T. R., Khalid, N., Bevan, N., Dale,
T., Dengel, A., Ahmed, S., Trygg, J., and Sj
¨
ogren, R.
(2021). Livecell—a large-scale dataset for label-free
live cell segmentation. In Nature methods, volume 18,
pages 1038–1045.
Gerhard, S., Funke, J., Martel, J., Cardona, A., and Fet-
ter, R. (2013). Segmented anisotropic sstem dataset of
neural tissue. In figshare.
Hiramatsu, Y., Hotta, K., Imanishi, A., Matsuda, M., and
Terai, K. (2018). Cell image segmentation by inte-
grating multiple cnns. In IEEE/CVF Conference on
Computer Vision and Pattern Recognition Workshops.
https://medicalsegmentation.com/covid19/ (2020). Covid-
19 ct segmentation dataset.
Jacobs, R. A., Jordan, M. I., Nowlan, S. J., and Hinton, G. E.
(1991). Adaptive mixtures of local experts. In Neural
Computation, volume 3, pages 79–87.
Kumagai, S., Hotta, K., and Kurita, T. (2018). Mixture of
counting cnns. In Machine Vision and Applications,
volume 29, pages 1119–1126.
Lin, T. Y., Dollar, P., Girshick, R., He, K., Hariharan, B.,
and Belongie, S. (2017). Feature pyramid networks
for object detection. In Proceedings of the IEEE con-
ference on computer vision and pattern recognition,
pages 2117–2125.
Long, J., Shelhamer, E., and Darrell, T. (2015). Fully con-
volutional networks for semantic segmentation. In
Proceedings of the IEEE conference on computer vi-
sion and pattern recognition, pages 3431–3440.
Ma, N., x. Zhang, Zheng, H. T., and Sun, J. (2018). Shuf-
flenet v2: Practical guidelines for efficient cnn archi-
tecture design. In Proceedings of the European con-
ference on computer vision, pages 116–131.
Milletari, F., Navab, N., and Ahmadi, S. A. (2016). V-
net: Fully convolutional neural networks for volumet-
ric medical image segmentation. In Proceedings of In-
ternational Conference on 3D Vision, pages 565–571.
Ronneberge, O., Fischer, P., and Brox, T. (2015). U-net:
Convolutional networks for biomedical image seg-
mentation. In Proceedings of International Confer-
ence on Medical Image Computing and Computer-
Assisted Intervention, pages 234–241.
Sun, K., Xiao, B., Liu, D., and Wang, J. (2019). Deep high-
resolution representation learning for human pose es-
timation. In Proc. IEEE/CVF Conference on Com-
puter Vision and Pattern Recognition, pages 5693–
5703.
Sun, K., Zhao, Y., Jiang, B., Cheng, T., Xiao, B., Liu, D.,
Mu, Y., Wang, X., Liu, W., and Wang, J. (2020). High-
resolution representations for labeling pixels and re-
gions. In arXiv:1904.04514.
Wang, J., Sun, K., Cheng, T., Jiang, B., Deng, C., Zhao, Y.,
Liu, D., Mu, Y., Tan, M., Wang, X., Liu, W., and Xiao,
B. (2020). Deep high-resolution representation learn-
ing for visual recognition. In IEEE transactions on
pattern analysis and machine intelligence, volume 43,
pages 3349–3364.
Yuan, Y., Chen, X., Chen, X., and Wang, J. (2019). Segmen-
tation transformer: Object-contextual representations
for semantic segmentation. In arXiv:1909.11065.
Yuan, Y., Fu, R., Huang, L., Lin, W., Zhang, C., Chen,
X., and Wang, J. (2021). Hrformer: High-resolution
transformer for dense prediction. In Neural Infor-
mation Processing Systems, volume 34, pages 7281–
7293.
Zhao, H., Shi, J., Qi, X., Wang, Z., and Jia, J. (2017). Pyra-
mid scene parsing network. In Proceeding of the IEEE
Conference on Computer Vision and Pattern Recogni-
tion, pages 2881–2890.
VISAPP 2023 - 18th International Conference on Computer Vision Theory and Applications
400
