
The Impact of COVID-19 on Authoring Open Data Workshop Settings in
High School
Maria Anna Ambrosino, Vanja Annunziata, Giuseppina Gonnella and Maria Angela Pellegrino
a
Universit
`
a degli Studi di Salerno, via Giovanni Paolo II, 132 84084 Fisciano (SA), Italy
Keywords:
Open Data, Open Data Authoring, Workshop, Education, School, Learning, Engagement, Remote, at a
Distance, High School.
Abstract:
According to the Open Knowledge Foundation, Open Data are data that can be freely used, created and shared
by anyone. Initiatives to let K-12 learners exploit Open Data are rare in literature, and the situation is even
worse if we look for opportunities to move them in the position of Open Data publishers. To advance the
dialogue around methods to increase awareness of Open Data, improve users’ skills to author and use Open
Data, HETOR regularly organises workshops with secondary school learners to let them create, publish, and
exploit Open Data by SPOD since 2016. While workshops were organised as physical meetings, during the
COVID-19 pandemic, HETOR required to revise the performed protocol. This article reports changes applied
to the workshops proposed by HETOR and the observed results in terms of quantity and quality of produced
open datasets, and quality of presenting and disseminating the authored Open Data by comparing workshops’
results before and after the COVID-19. According to the discussion, the quantity and quality of the workshops
outcome increased during the workshops that took place after the COVID-19 pandemic demonstrating that
Open Data based initiatives can successfully survive in remote settings. On the opposite, the quality of the
presentations authored by scholars is more heterogeneous during after-COVID workshops demonstrating that
remote settings make educational inequalities worse.
1 INTRODUCTION
“Open Data (OD) are data that can be freely used,
shared and built-on by anyone, anywhere, for any
purpose” (Open Knowledge Foundation, 2013). OD
have the potential to improve government trans-
parency, citizen collaboration and participation, and
spur innovation (Harrison et al., 2012).
It is required to overcome the lack of technical
skills and domain knowledge, one of the key barri-
ers to OD use, to exploit OD to the best. Users need
more data literacy skills, as they are unaware of avail-
able OD (Martin et al., 2015) and how to get value
out of data (Safarov et al., 2017). Training is crucial
in letting users author and exploit OD effectively, but
there is limited research on strategies to train users
(Gasc
´
o-Hern
´
andez et al., 2018), scarce involvement
of citizens (Safarov et al., 2017; Styrin et al., 2017),
and isolated efforts to verify skills and tasks stake-
holders require to deal with data properly (Martin and
Begany, 2017; Susha et al., 2015). Moreover, citizens
usually play the role of OD users without having the
a
https://orcid.org/0000-0001-8927-5833
possibility to author data of interest and experience
the challenges of the OD publication stage.
To increase awareness of OD, improve users’
skills to author and work with OD, and let K-12 learn-
ers develop data and information literacy, HETOR pro-
poses a series of workshops to allow high school
learners to familiarise themselves with OD. Work-
shops have been held annually since 2016 in the con-
text of school-work alternance. While HETOR usually
moderated workshops as physical meetings, COVID-
19 required a revision to the protocol to move to a
remote setting.
The COVID-19 pandemic and the restrictions that
followed caused many challenges in education (Antle
and Frauenberger, 2020; Iivari et al., 2020). Schools
switched to remote mode as well as all the learn-
ing activities held as curricular activities or as after-
school initiatives (Kinnula et al., 2021; Roumelioti
et al., 2022; Antelmi and Pellegrino, 2022). Chang-
ing learning activities into an online mode is chal-
lenging as it requires re-thinking collaborative inter-
actions among peers, adjusting the activity protocol,
and guaranteeing the presence and detailed guidance
474
Ambrosino, M., Annunziata, V., Gonnella, G. and Pellegrino, M.
The Impact of COVID-19 on Authoring Open Data Workshop Settings in High School.
DOI: 10.5220/0011743400003470
In Proceedings of the 15th International Conference on Computer Supported Education (CSEDU 2023) - Volume 2, pages 474-482
ISBN: 978-989-758-641-5; ISSN: 2184-5026
Copyright
c
2023 by SCITEPRESS – Science and Technology Publications, Lda. Under CC license (CC BY-NC-ND 4.0)

of experienced instructors to support novice learn-
ers also at a distance (Kinnula et al., 2021). More-
over, engaging learners is potentially more challeng-
ing when held at a distance (Roumelioti et al., 2022).
This article reports the protocol experienced by
HETOR in letting scholars authoring and exploiting
OD, how it has been revised to face challenges
posed by the pandemic, and quantitative and qual-
itative comparison of the artifacts authored during
in-presence and remote workshops. The analysis
demonstrates that HETOR successfully adopted re-
motely a workshop protocol similar to the one expe-
rienced face-to-face. Remote workshops let scholars
produce a consistent number of open datasets during
remote workshops. Moreover, the quality of the pro-
duced OD is better in terms of completeness with re-
spect to the pre-COVID workshops. It could be jus-
tified by the possibility of taking the required time to
accomplish tasks. However, the quality of authored
presentations during post-COVID workshops is more
heterogeneous than during pre-COVID workshops. It
might be caused by the education inequalities that are
strengthened by remote learning activities.
The rest of the article is structured as follows. Sec-
tion 2 reports related work; section 3 overviews the
performed protocol both in presence and in remote
settings; section 4 describes quantitative and qualita-
tive observations collected during the last three edi-
tions of the HETOR workshops, while section 5 dis-
cusses challenges and outcomes observed during the
remote sessions if compared to the in-presence ac-
tivities to underline how the COVID-19 impact OD-
based workshops; the article concludes with final re-
marks and suggestions for future OD authoring work-
shops.
2 RELATED WORK
In terms of skills needed to use OD, the Open Data In-
stitute (ODI) has developed a framework that includes
six basic skills sets (Open Data Institute, 2020), which
include an introduction, publishing by paying atten-
tion to data quality, management including building
communities, analysis including data visualization,
and value creation. This article adopts the ODI’s
framework because of its internal consistency and
wider scope. Moreover, being the guiding framework
for the ODI training strategy and practice, it has the
potential to offer academic and practical implications.
More and more researchers and educators recog-
nise the potentialities in using OD as an educational
resource (Piedra et al., 2017) targeting heterogeneous
goals. (
´
Alvarez Otero et al., 2018) and (Charvat et al.,
2017) focus on deeper learners skills in environmen-
tal education. While the GI-Learner project (
´
Alvarez
Otero et al., 2018) targets secondary school and ex-
ploits OD on the cloud to learn about protected ar-
eas in Spain, the SDI4Apps Open INSPIRE4Youth
(Charvat et al., 2017) encourages higher grades of el-
ementary schools, high schools, and universities to
reuse Linked Open Data (LOD) and environmental
data for educational and gaming purposes. (Basford
et al., 2016) raise awareness of rhino conservation by
prototyping Erica the Rhino, an interactive art exhibit
that implicitly allowed children to consume and pub-
lish LOD through Erica interaction. (Kurada et al.,
2021; Windhager et al., 2016; De Donato et al., 2021)
discuss the role plaid by data visualisation in letting
learners make sense of complex data.
Interventions to improve users’ skills and knowl-
edge are rare in the literature and mainly focus on
OD exploitation. (Gasc
´
o-Hern
´
andez et al., 2018) de-
scribe and compare interventions to increase aware-
ness of OD, enhance users’ skills and engage them in
the use of OD. (Chen et al., 2014; Dickinson et al.,
2015; Vargianniti and Karpouzis, 2020) proposed OD
game-based workshops to engage learners while let-
ting them learn. (Wolff et al., 2019; Saddiqa et al.,
2019b) let learners exploit OD in improving their
awareness of environment and smart city develop-
ment. (Saddiqa et al., 2019a; Antelmi and Pellegrino,
2022) focused on the importance and challenges of
mastering OD visualisations.
Usually, OD-based workshops are organised in
physical meetings. Rare are online workshops. (Var-
gianniti and Karpouzis, 2020; Antelmi and Pel-
legrino, 2022) were forced to move lessons re-
motely due to the COVID-19 pandemic. (Vargian-
niti and Karpouzis, 2020) propose a digital version of
Geopoly, a game similar to Monopoly that exploits
OD to learn about geography. It successfully kept
learners engaged and motivated, which was especially
difficult given that schools were closed and strict mea-
sures were enforced during the experiment. (Antelmi
and Pellegrino, 2022) focused on OD visualisation
mixing theory classes and hands-on sessions. Despite
promising learning and engagement outcomes, mod-
erators observed participants’ reluctance to switch on
cameras and technological immaturity that hindered
activities in remote settings.
In all the previously cited workshops, learners
consume data without having the possibility to author
data of interest. HETOR’s workshops move secondary
school learners to the position of OD publishers, let-
ting them experience the challenges inherent in the
role of data curator.
The Impact of COVID-19 on Authoring Open Data Workshop Settings in High School
475

3 WORKSHOP DESIGN
3.1 Research Questions
The main research goal of this article relates to under-
standing the impact caused by COVID-19 on the ar-
tifacts authored by participants in the proposed work-
shops. Our aim is translated into a single research
question (RQ): What is the impact of COVID-19 on
OD authoring workshops?
3.2 Protocol
HETOR workshops include both authoring and ex-
ploitation stages. Each workshop includes an intro-
ductory phase and a hands-on session. In the in-
troductory phase, the moderators explain concepts,
encourage participants to reply to questions and
quick oral exercises, and clarify any doubt. During
the hands-on session, participants work on the as-
signed task in groups of four or five members, asyn-
chronously assisted by the moderator when needed.
Details on the learning content of each workshop (W
#
with # progressive number) follow.
W
1
: Authoring OD. W
1
introduces OD and SPOD
as an authoring platform to collaboratively create OD.
According to the class and groups’ interests, the mod-
erators assign a topic related to the open datasets
scholars are invited to create during the hands-on ses-
sion. During the hands-on session, scholars are organ-
ised into small groups of four or five members. Each
group has to look for publicly available data related
to the assigned topic to populate the authored dataset
collaboratively. The outcome of this workshop is the
authored (portion of a) dataset stored as a data table
in the SPOD platform.
W
2
: OD Exploitation. W
2
introduces OD exploita-
tion by data visualisation and the chart authoring
mechanism implemented in SPOD. Then, scholars are
invited to co-create and discuss charts starting from
the authored datasets. This workshop’s outcome is a
data representation collection that visually describes
the authored dataset content.
W
3
: Dissemination. W
3
focuses on the dissemi-
nation of the created value. Scholars are invited to
author a presentation to overview the performed ac-
tivities and summarise the created value in authoring
and exploiting OD. The outcome of this workshop is
a presentation containing at least the context in terms
of learnt concepts and the used tools, dataset details
in terms of topic and content, dataset visualisation(s),
conclusive observations, and opinions. Presentations
are held as public or private events, within the class,
the school, or among schools, based on the possibili-
ties. Each group had 15 minutes to report their work.
3.3 Participants and Setting
The workshops described in the protocol section have
been moderated by the two researchers of HETOR
since 2016. 9 high schools spontaneously joined the
HETOR project for free by contacting the HETOR associ-
ation and asking for moderating workshops to let high
school learners familiarise themselves with OD. Each
school decides the involved classes, the workshops
duration and settings according to available hours and
its lessons’ requirements, while the HETOR associa-
tion proposes the workshops topics. All the learn-
ers belonging to the involved classes have to attend
the HETOR activities. Since 2018, 6 high schools have
been involved, with a total of 471 high school learn-
ers. All of them needed to familiarise themselves with
concepts related to data literacy (e.g., data manipula-
tion and chart creation) and tools used to perform data
exploitation (e.g., Excel and Google Sheet). Partici-
pants’ ages ranged from 16 to 19 years old. Meetings
usually start in December (or January at most) and
are scheduled until May. While hands-on sessions are
conceived as self-learning activities with the oppor-
tunity to asynchronously discuss with the moderators
through SPOD, theory classes are organised in pres-
ence or online at a distance due to COVID-19 reg-
ulations. Workshops took place as school-work al-
ternance, i.e., curricular hours dedicated to education
or training that combine periods in an educational in-
stitution and the workplace. The workplace is a vir-
tual platform, SPOD, where scholars can author and
exploit OD collaboratively. Workshops were part of
curricular lessons or took place as after-school activ-
ities based on the school timetable or pandemic re-
Table 1: Summary of participants and setting of the last three OD authoring workshops.
Year Setting Schools Scholars Theory classes Dissemination
number number setting event setting
2018-2019 After-school 3 63 In presence Public, in presence
2020-2021 Curricular 3 291 Remote Public or private, remote
2021-2022 Curricular 3 117 Remote Private, in person or remote
CSEDU 2023 - 15th International Conference on Computer Supported Education
476

Table 2: Metrics for assessing the presentation quality.
Metrics Description Score
Aestheticism Attention to details in authoring a presentation pleasant to look at. {0,0.5,1}
Charts Proper use of charts to support statements. {0,0.5,1}
Conciseness Avoid verbose slides. {0,0.5,1}
Context Details to contextualise the contribution of the authored dataset. {0,0.5,1}
Language Lexical correctness and proper use of domain-specific terms. {0,0.5,1}
Requirements The presentation should contain a brief introduction of OD and SPOD authored dataset de-
tails and screen, data visualisation(s), conclusive personal considerations, authors’ details
{0,0.5,1}
Time Reasonable number of slides in 15 minutes presentation. {0,0.5,1}
quirements. It is worth clarifying that HETOR’ work-
shops focus on OD authoring and exploitation and
communication and dissemination. This article deals
only with the first type of workshop. Details of work-
shops discussed in this article are summarised in Ta-
ble 1 which reports the number of involved schools
and learners per year, and the workshop settings.
3.4 Tools
The OD authoring (W
1
) and the exploitation (W
2
)
workshops rely on SPOD. SPOD
1
(Cordasco et al.,
2017) is a social platform allowing the co-creation of
OD, OD exploitation by data visualisations, and data-
driven discussions in virtual public places. Hence,
users can create OD in tabular format collaboratively
within SPOD. Moreover, authored datasets can be visu-
alised by dynamic charts that make collected data eas-
ily understandable. Charts can be downloaded as dy-
namic components and imported into blogs and web
pages or as images for static presentations. During
hands-on sessions, independently from the workshop
setting, learners could chat with the HETOR’s modera-
tors via SPOD to pose questions and ask for support.
The theory classes of the post-COVID workshops
took place via Google Meet synchronous videocon-
ferencing tool. Only if explicitly required by the
participating school, the HETOR moderators organ-
ised synchronous video-conferences also during the
hands-on sessions. It happened once.
3.5 Data Gathering
The moderators collected the authored artifacts at the
end of each workshop. Hence, they have access to
the authored datasets and presentations. To evaluate
how COVID-19 influenced the quality of the work-
shops’ outcomes, we considered the quantity and the
quality of the authored datasets and the quality of the
presentations. The quality of the datasets is evaluated
1
SPOD: http://spod.databenc.it
in terms of incompleteness by counting the percent-
age of missing values. The quality of the presenta-
tions has been evaluated in terms of appropriateness
to the time available, degree of contextualisation, care
of aestheticism, use of charts to support statements,
conciseness level, language skills, and degree of com-
pliance with guidelines. Two domain experts itera-
tively defined these metrics and performed a two-step
procedure to evaluate participants’ projects. First, the
experts independently reviewed each presentation ac-
cording to the metrics reported in Table 2; then, they
resolved inconsistencies through discussions. The fi-
nal score associated with each presentation is the sum
of the score of each metric. Thus, the maximum score
per presentation is 7 (the higher, the better).
4 RESULTS
This section reports the quantitative and qualitative
assessment of datasets and presentations according to
the metrics described in Section 3.
Quantity and Quality of Open Datasets. This sec-
tion quantifies and estimates the quality of datasets
authored by scholars. HETOR activities focus on the
preservation and digitisation of National and Regional
cultural heritage, as observed by the datasets name in
Table 3. All the authored datasets are modelled as
data tables where learners are in charge of populat-
ing data table rows according to the required columns
to model agreed topics. Learners have to look for
required information by googling them, using offi-
cial cultural heritage resources, or getting in touch
with cultural heritage site contact points. Each dataset
might be either authored by a single group or can
result from the concatenation of rows authored by
each group. All the datasets are published as OD
on CKAN. Table 3 summarises the size of authored
datasets in terms of the number of rows, columns, and
cells and their quality in terms of incompleteness, es-
timated by counting the number of empty cells. Ta-
The Impact of COVID-19 on Authoring Open Data Workshop Settings in High School
477
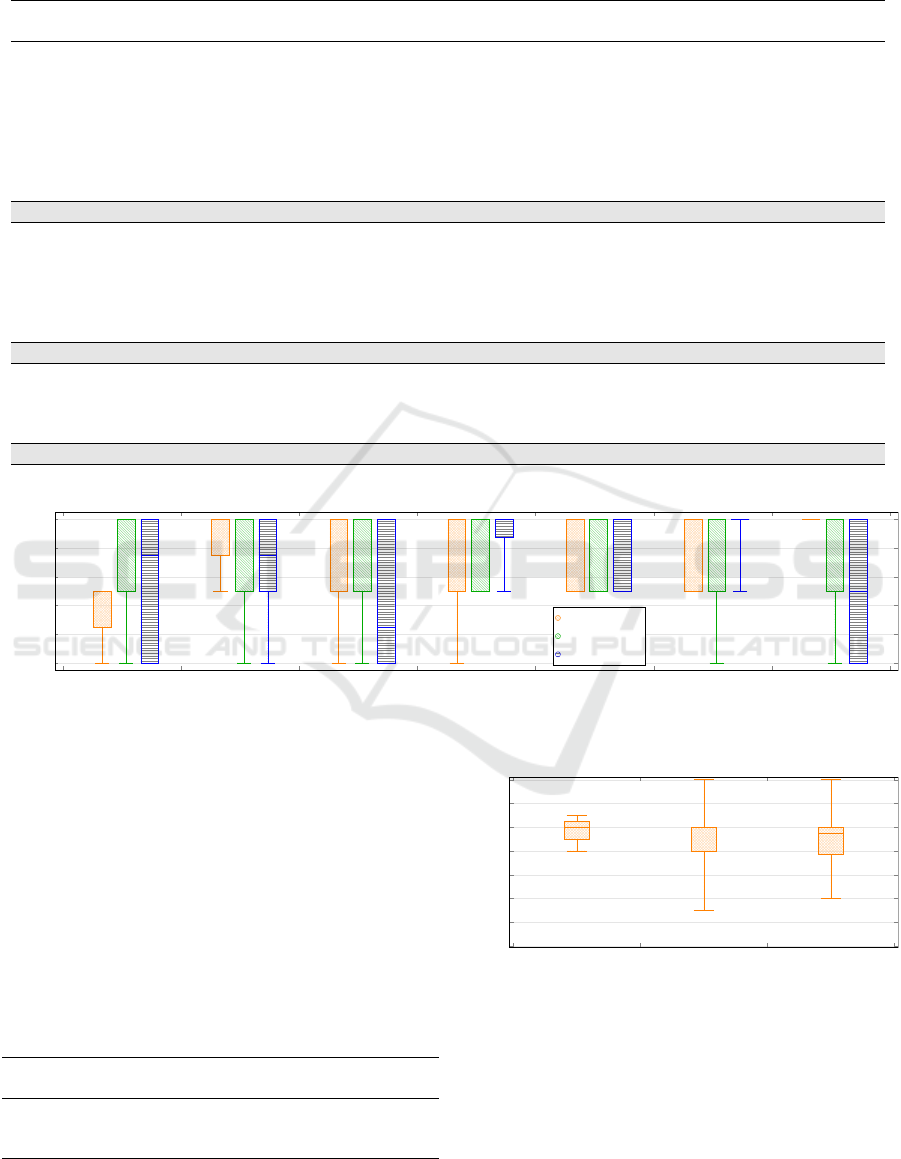
Table 3: Quantity and quality of OD authored by all the involved schools, year by year. Real names of towns, provinces, and
area are omitted due to the anonymity requirement.
Dataset Number Number Number Number of Empty cells
of rows of cols of cells empty cells on total
Regional forests 10 19 190 16 8%
Regional seed woods 17 19 323 26 8%
Start-up, small and medium enterprises 153 21 3,213 398 12%
Enterprises in Battipaglia and Eboli 168 22 3,696 586 16%
Regional farmhouses 206 15 3,090 597 19%
Regional social farms 19 22 418 92 22%
Former Borbon prison monumental complex 95 18 1,710 371 22%
Regional slow food principals 89 15 1,135 337 30%
2018/2019 - 8 datasets 757 151 13,775 2,423 18%
Caserta municipalities 104 21 2,184 94 4%
Avellino municipalities 118 24 2,832 213 8%
Salerno municipalities 158 24 3,792 362 9%
Caserta points of interest 1,314 13 17,082 2,568 15%
Avellino points of interest 1,439 13 18,707 2,882 15%
Agro Nocerino points of interest 283 12 3,396 512 15%
2020/2021 - 6 datasets 3,416 107 47,993 6,631 14%
National abandoned railway lines 287 9 2,583 36 1%
Museum of Cilento and Policastro Gulf 69 17 1,173 126 11%
Museum of Mathematics 53 18 954 117 12%
National computer science museums & collections 38 16 608 88 14%
2021/2022 - 4 datasets 447 60 5,318 367 7%
aestheticism charts
conciseness
context
language
requirements time
0
0.2
0.4
0.6
0.8
1
Metrics values
Metrics details
2018/2019
2020/2021
2021/2022
Figure 1: Scores per metric.
ble 3 reports datasets per year, sorted according to the
percentage of empty cells.
Quality of Presentations. This section reports the
quality assessment of presentations according to met-
rics described in Table 2. Table 4 reports the number
of presentations per year and statistics of scores as-
signed and revised by two independent field experts.
Figure 2 graphically compares qualitative assessment
of presentations per year, while Figure 1 reports the
score distributions per metric and year.
Table 4: Qualitative assessment of presentations.
Year Num. of Min Mean St.Dev. Max
groups score score score
’18-’19 3 4.0 4.83 0.76 5.5
’20-’21 21 1.5 4.57 1.36 7.0
’21-’22 7 2.0 4.50 1.44 7.0
2018/2019 2020/2021 2021/2022
0
1
2
3
4
5
6
7
Presentation scores
Presentations’ assessment
Figure 2: Qualitative assessment of presentations per year.
5 DISCUSSION
This section discusses results by organising observa-
tions according to protocol modifications to be com-
pliant with the COVID-19 restrictions, the impact on
the authored OD and the scholars’ presentations, re-
CSEDU 2023 - 15th International Conference on Computer Supported Education
478

current problems and challenges observed during the
workshops.
Minimum Modifications to the Protocol to Com-
ply with the COVID-19 Restrictions. The proto-
col described in Section 3 is the same performed
during in-person and remote OD authoring work-
shops. COVID-19 only impacted the activity setting
as participating schools modified the school-work al-
ternance training activities from after-school initia-
tives to curricular activities. It can be observed in Ta-
ble 1 noting that workshops moved from after-school
setting in 2018/2019 (before COVID-19) to curricular
activities in 2020/2021 and 2021/2022 (after COVID-
19). According to the moderators, this shift from
physical to remote workshops without applying any
protocol change was possible thanks to the exploita-
tion of SPOD that natively offers collaborative sup-
port without requiring in-person interactions. In fact,
scholars can co-create open datasets working on the
same table at the same time and can discuss doubts
through in-site chats. The moderators complain about
the impact caused by the COVID-19 on the dissem-
ination event setting. During the 2018/2019, it took
place as a public event letting all the involved schools
to join to the same event with the special presence of
guests of honour, such as OD experts, guests from the
Regional Council. Due to the COVID-19 pandemic,
public in person events have been replaced to remote
versions of the same events or as private events with-
out constructive competition among schools and spe-
cial guests as motivators.
COVID-19 Has not Affected the Quantity and
Quality of the Authored Datasets. The OD author-
ing workshops kept on producing open datasets, as
visible in Table 3. It is worth noting that the number
of authored datasets depends on the number of partic-
ipants, groups, and scholars’ interests, while the size
of each dataset strictly depends on the datasets’ topic
and the modelled columns. Hence, we cannot directly
compare the number of datasets or their size to partic-
ipants to quantify the effort. However, we can notice
that scholars actively worked to open datasets in re-
mote settings during the COVID-19 pandemic. Con-
cerning the quality of the produced datasets, we es-
timated their completeness by counting the percent-
age of empty cells, as usually performed in tabular
datasets. Incomplete information may be caused by
i) lack of available information (as observed in For-
mer Borbon prison monumental complex), ii) lack
of interest in deeply looking for them on Google,
shyness in requesting information by official contact
points, iii) not the applicability of required column
to specific rows. According to the results reported
in Table 3, we can conclude that the quality of the
produced datasets improved. It moved from a total
of 18% of incomplete cells during 2018/2019 to 7%
during 2021/2022.
According to the workshops’ moderators, the low-
est scores may be caused by difficulties in engag-
ing scholars or perceiving the difficulties encountered
by the shyest learners and supporting them oppor-
tunely. In fact, during in-person activities, modera-
tors can easily detect scholars’ mood by looking at
them at work or adapting the theory classes to their
facial reactions. On the opposite, during remote ses-
sions, scholars rarely switch on cameras and are reluc-
tant to pose questions (Antelmi and Pellegrino, 2022).
Moreover, lack of technical skills is an obstacle in
sharing doubts in remote settings as most participants
have difficulties sharing their screens and dealing with
multiple tools at the same time (Antelmi and Pelle-
grino, 2022).
Great Variability of Participants’ Performance in
Remote Settings. Concerning the qualitative as-
sessment of the authored presentations, it is worth
recalling that scores may range from 0 to 7. Ta-
ble 4 schematically reports scores achieved by schol-
ars’ groups in each workshop year. During the
pre-COVID workshops (i.e., during 2018/2019), pre-
sentations’ scores are almost homogeneous, ranging
from 4 to 5.5 with a mean score of 4.83. Scores
are significantly more variable and heterogeneous
during the post-COVID workshops (i.e., during the
2020/2021 and 2021/2022), ranging from a minimum
score of 1.5 in 2020/2021 to a maximum score of 7 in
both years. It is even more visible in Figure 2, which
reports the box plot of the qualitative assessment of
presentations per year. The remote setting seems to
accentuate the scholars’ differences in the propensity
to work and make the educational inequalities worse.
It is discussed further in the following.
Focus on Opportunities and Challenges of Remote
Workshops. The same variability of participants’
performance can be observed if we focus on metrics
details, graphically reported in Figure 1. As a gen-
eral pattern, during 2018/2019, scores are more ho-
mogeneous than during the following years in most of
the metrics. During 2020/2021, scores span the entire
range, from 0 to 1, follow a similar pattern in most of
the metrics, and are above 0.5 for most of the partic-
ipants. In 2021/2022, scores are very heterogeneous,
covering the entire range in most metrics.
The care for aestheticism improved after the
COVID-19 pandemic. In fact, while during
The Impact of COVID-19 on Authoring Open Data Workshop Settings in High School
479

2018/2019, the maximum score in aestheticism was
0.5, in the following years, presentations achieved the
maximum score. Moreover, in 2020/2021, most pre-
sentations gained a score greater than 0.5. Hence,
most of the participants also curated the appearance
of the presentation. A similar trend is observed in the
context metric, as the ability to contextualise the per-
formed activity improved during the COVID-19 pan-
demic. It can be justified by the possibility of taking
the required time to accomplish the assigned tasks and
curate them opportunely. Moreover, after COVID-
19, workshops were organised as curricular activities
without requiring scholars to carve out time for ex-
tracurricular activities by limiting required workload.
The language is the unique metric that remains
unchanged during the different workshops, underly-
ing that it is a recurrent problem to master domain-
specific terms. Also, the ability to be concise follows
a similar pattern during the different editions, achiev-
ing slightly lower scores during 2021/2022. It might
be caused by the absence of pressure in having pre-
sentations with a restricted audience or, even worse,
without a public. This hypothesis supports also the
worsening of time metric scores, that decreased after
the COVID-19 pandemic.
If we focus on chart usage, scores decreased after
2020. It might be caused by the difficulties to expe-
rience the theory classes remotely, perhaps due to the
easiness in being distracted in remote settings.
Concerning the requirements metric, during
2021/2022, scholars diligently complied with the pro-
vided indications, achieving very high scores. It sup-
ports the hypothesis that in remote settings, scholars
need clear tasks and indications to follow. Hence,
moderators should be concise on theory classes to
minimise the possibility of distraction and require
scholars’ concentration for a limited time interval.
Remote Workshops Strengthen Educational In-
equalities. The heterogeneity observed in the pre-
sentations’ qualitative assessment might be justified
by the negative impact that remote workshops have
on educational inequalities. Researchers and interna-
tional organisations have studied the effects of school
closures on scholars’ learning and found a measur-
able loss in the acquisition of basic skills, particularly
for the most disadvantaged children, also before 2020
(Quinn et al., 2016; Cattaneo et al., 2017). COVID-19
pandemic and distance learning amplified education
inequalities across the world (Blask
´
o et al., 2022).
Distance learning effectiveness crucially depends
on learners’ possibilities to attend virtual classes
(Bonacini and Murat, 2021). Online learning requires
appropriate equipment (a computer to fully take ad-
vantage of the workshops described in this paper) and
a satisfying Internet connection (Bonacini and Mu-
rat, 2021). They should not be given for granted, as
demonstrated by the analysis performed by (Blask
´
o
et al., 2022). To cope with the lack of equipment,
governments or school provided learners and edu-
cators with computers (Bonacini and Murat, 2021).
Even when learners can access remote learning, ed-
ucation at a distance strengthens the gap between
scholars from different socio-economic backgrounds
(Coe et al., 2020). Learners may have different in-
ternet connectivity conditions and unequal opportuni-
ties to access technological devices to carry out their
schoolwork (Bonal and Gonz
´
alez, 2020). Scholars
might be required to share their devices with siblings
or parents (Bonacini and Murat, 2021) and might be
forced to join online activities by tablets or smart-
phones (Cordini and De Angelis, 2021). During the
workshops described in this paper, the HETOR’s mod-
erators noticed that several learners attended work-
shops by smartphones, even if they clearly asked for a
computer at the beginning of the workshops. It might
affect performance, engagement, and outcome qual-
ity due to the difficulties in dealing with SPOD and
software to author presentations on small screen de-
vices. Hence, learners who were not provided with a
computer caused slowdowns both during the hands-
on sessions since they were not able to use SPOD via
smartphones and after workshops since they were re-
quired to carry out the assigned activities at a later
time. Moreover, scholars and moderators experienced
Internet connection issues due to adverse weather
conditions and the participation of learners residing in
decentralised municipalities where the Internet con-
nection was not stable.
Families might be unprepared for distance learn-
ing and homeschooling (Cordini and De Angelis,
2021). Hence, when learners require adult support,
it is not obvious to consider parents’ support equiv-
alent to the educators’ or moderators’ one. Parents
might need more skills or time (due to their work)
to properly support learners. Conditions for effec-
tive learning, such as clear explanations, scaffolding,
and teacher feedback, are challenging to accomplish
(Bonal and Gonz
´
alez, 2020). Moreover, asking for
support can also be hindered by difficulties in clearly
reporting the faced difficulties, the shyness in publicly
asking for help, or technological deficiencies in shar-
ing the screen and giving moderators the possibility
to solve problems, clarify doubts, and reply to ques-
tions. The moderators also noticed a need for greater
digital skills in data analysis tools, video-conference
software, screen-sharing mechanisms, and keyboard
shortcuts to speed up OD authoring via SPOD.
CSEDU 2023 - 15th International Conference on Computer Supported Education
480

A non-trivial factor is the presence of distractions
at home and the importance of having a quiet place
to study (Bol, 2020). Educators and moderators are
responsible for instilling an atmosphere conducive to
learning in the classroom. When children switch to
online learning programs, they quickly discover that
the same setting is hard to recreate at home. As a
result, the level of engagement in online learning is
lower, and children with weaker self-discipline come
under significant pressure.
While distance learning seems to have the poten-
tial to democratise education due to the absence of
physical barriers and geographical constraints, not go-
ing to school reduces learning opportunities for all.
However, learners from low-income backgrounds and
less-skilled learners are lagging behind (Bonal and
Gonz
´
alez, 2020).
6 CONCLUSIONS
According to their definition, OD can be created by
anyone. However, rarely are scholars moved to the
position of OD publishers. A tentative step to fill
this gap is proposed by HETOR that regularly organises
OD authoring workshops with high-school learners in
the context of school-work alternace training activi-
ties since 2016. While workshops are usually held as
physical meetings, COVID-19 forces HETOR to move
the workshops to remote settings. The performed
protocol succeeded in being adapted without under-
going substantial variations thanks to the used plat-
form, SPOD, that supports co-creation also remotely.
To estimate the impact of COVID-19 on the OD au-
thoring workshops (RQ), we estimated the quantity
of the produced open datasets, their quality in terms
of completeness, and the quality of the dissemination
presentations authored by scholars to overview the
performed activity. While the produced datasets im-
proved in quantity and quality after COVID-19, the
presentations’ quality obtained more heterogeneous
results. Hence, OD authoring workshops successfully
survived COVID-19. However, remote settings make
educational inequalities worse.
To further improve the outcome of future work-
shops, HETOR’s moderators remark that it is crucial
to ask for school educators’ support during activities
to gain a more homogeneous quality of authored arti-
facts. It might also be helpful to consider a modifica-
tion to the performed protocol to introduce a reflec-
tion phase to discuss performed errors collectively,
encourage less motivated scholars or learners that
faced challenges in completing tasks to improve the
authored artifacts and let them refine them according
to the collected suggestions. Availability of required
equipment and a favourable learning setting must be
carefully verified to avoid learners’ disengagement
and frustration.
REFERENCES
Antelmi, A. and Pellegrino, M. A. (2022). Open data liter-
acy by remote: Hiccups and lessons.
Antle, A. N. and Frauenberger, C. (2020). Child–computer
interaction in times of a pandemic. International jour-
nal of child-computer interaction, 26:100201.
Basford, P., Bragg, G., Hare, J., Jewell, M., Martinez, K.,
Newman, D., Pau, R., Smith, A., and Ward, T. (2016).
Erica the rhino: A case study in using raspberry pi
single board computers for interactive art. Electronics,
5:35.
Blask
´
o, Z., Costa, P. d., and Schnepf, S. V. (2022). Learning
losses and educational inequalities in europe: Map-
ping the potential consequences of the covid-19 crisis.
Journal of European Social Policy, 32(4):361–375.
Bol, T. (2020). Inequality in homeschooling during the
corona crisis in the netherlands. first results from the
liss panel.
Bonacini, L. and Murat, M. (2021). Coronavirus pandemic,
remote learning and education inequalities. Technical
report, GLO Discussion Paper.
Bonal, X. and Gonz
´
alez, S. (2020). The impact of lock-
down on the learning gap: family and school divisions
in times of crisis. International Review of Education,
66(5):635–655.
Cattaneo, M. A., Oggenfuss, C., and Wolter, S. C. (2017).
The more, the better? the impact of instructional
time on student performance. Education economics,
25(5):433–445.
Charvat, K., Cerba, O., Kozuch, D., and Splichal, M.
(2017). Geospatial data based environment in in-
spire4youth. Procedia Computer Science, 104:183–
189.
Chen, C.-P., Shih, J.-L., and Ma, Y.-C. (2014). Using in-
structional pervasive game for school children’s cul-
tural learning. Journal of Educational Technology &
Society, 17(2):169–182.
Coe, R., Weidmann, B., Coleman, R., and Kay, J. (2020).
Impact of school closures on the attainment gap: rapid
evidence assessment. june 2020.
Cordasco, G., De Donato, R., Malandrino, D., Palmieri,
G., Petta, A., Pirozzi, D., Santangelo, G., Scarano, V.,
Serra, L., Spagnuolo, C., and Vicidomini, L. (2017).
Engaging citizens with a social platform for open
data. In Proceedings of the 18th Annual Interna-
tional Conference on Digital Government Research,
page 242–249.
Cordini, M. and De Angelis, G. (2021). Families between
care, education and work: The effects of the pandemic
on educational inequalities in italy and milan. Euro-
pean Journal of Education, 56(4):578–594.
The Impact of COVID-19 on Authoring Open Data Workshop Settings in High School
481

De Donato, R., Garofalo, M., Malandrino, D., Pellegrino,
M. A., and Petta, A. (2021). Education meets knowl-
edge graphs for the knowledge management. In
Methodologies and Intelligent Systems for Technology
Enhanced Learning, 10th International Conference.
Workshops, pages 272–280, Cham. Springer Interna-
tional Publishing.
Dickinson, A., Lochrie, M., and Egglestone, P. (2015). Dat-
apet: Designing a participatory sensing data game
for children. In Proceedings of the British Human-
Computer Interaction Conference, page 263–264.
Gasc
´
o-Hern
´
andez, M., Martin, E. G., Reggi, L., Pyo, S., and
Luna-Reyes, L. F. (2018). Promoting the use of open
government data: Cases of training and engagement.
Government Information Quarterly, 35(2):233–242.
Harrison, T. M., Pardo, T. A., and Cook, M. (2012). Cre-
ating open government ecosystems: A research and
development agenda. Future Internet, 4(4):900–928.
Iivari, N., Sharma, S., and Vent
¨
a-Olkkonen, L. (2020).
Digital transformation of everyday life–how covid-
19 pandemic transformed the basic education of the
young generation and why information management
research should care? International Journal of Infor-
mation Management, 55:102183.
Kinnula, M., S
´
anchez Milara, I., Norouzi, B., Sharma, S.,
and Iivari, N. (2021). The show must go on! strate-
gies for making and makerspaces during pandemic.
International Journal of Child-Computer Interaction,
29:100303.
Kurada, R. R., Ramu, Y., and Pattem, S. (2021). Lessoning
geospatial visualizations on real-time data. In 2021
IEEE International Conference on Computation Sys-
tem and Information Technology for Sustainable So-
lutions (CSITSS), pages 1–6.
Martin, E. G. and Begany, G. M. (2017). Opening govern-
ment health data to the public: benefits, challenges,
and lessons learned from early innovators. Jour-
nal of the American Medical Informatics Association,
24(2):345–351.
Martin, E. G., Helbig, N., and Birkhead, G. S. (2015).
Opening health data: what do researchers want? early
experiences with new york’s open health data plat-
form. Journal of Public Health Management and
Practice, 21(5):E1–E7.
Open Data Institute (2020). Data skills framework. https://
theodi.org/open-data-skills-framework. [Online, last
access April 2022].
Open Knowledge Foundation (2013). Defining open data.
https://blog.okfn.org/2013/10/03/defining-open-data.
[Online at , Last access November 2022].
Piedra, N., Chicaiza, J., L
´
opez, J., and Caro, E. T. (2017). A
rating system that open-data repositories must satisfy
to be considered oer: Reusing open data resources in
teaching. In Global Engineering Education Confer-
ence, pages 1768–1777.
Quinn, D. M., Cooc, N., McIntyre, J., and Gomez, C. J.
(2016). Seasonal dynamics of academic achievement
inequality by socioeconomic status and race/ethnicity:
Updating and extending past research with new na-
tional data. Educational Researcher, 45(8):443–453.
Roumelioti, E., Pellegrino, M. A., Rizvi, M., D’Angelo,
M., and Gennari, R. (2022). Smart-thing design by
children at a distance: How to engage them and make
them learn. International Journal of Child-Computer
Interaction, 33:100482.
Saddiqa, M., Larsen, B., Magnussen, R., Rasmussen, L. L.,
and Pedersen, J. M. (2019a). Open data visualization
in danish schools: A case study. In Proc. of Intern.
Conf. in Central Europe on Computer Graphics, Visu-
alization and Computer Vision.
Saddiqa, M., Rasmussen, L., Magnussen, R., Larsen, B.,
and Pedersen, J. M. (2019b). Bringing open data
into danish schools and its potential impact on school
pupils. In Proc. of the 15th International Symposium
on Open Collaboration.
Safarov, I., Meijer, A., and Grimmelikhuijsen, S. (2017).
Utilization of open government data: A systematic lit-
erature review of types, conditions, effects and users.
Information Polity, 22(1):1–24.
Styrin, E., Luna-Reyes, L. F., and Harrison, T. M. (2017).
Open data ecosystems: an international comparison.
Transforming Government: People, Process and Pol-
icy.
Susha, I., Gr
¨
onlund,
˚
A., and Janssen, M. (2015). Driving
factors of service innovation using open government
data: An exploratory study of entrepreneurs in two
countries. Information polity, 20(1):19–34.
Vargianniti, I. and Karpouzis, K. (2020). Using big and
open data to generate content for an educational game
to increase student performance and interest. Big Data
and Cognitive Computing, 4(4).
Windhager, F., Mayr, E., Schreder, G., and Smuc, M.
(2016). Linked information visualization for linked
open government data. a visual synthetics approach
to governmental data and knowledge collections.
JeDEM-eJournal of eDemocracy and Open Govern-
ment, 8(2):87–116.
Wolff, A., Wermelinger, M., and Petre, M. (2019). Explor-
ing design principles for data literacy activities to sup-
port children’s inquiries from complex data. Interna-
tional Journal of Human-Computer Studies, 129:41–
54.
´
Alvarez Otero, J., L
´
azaro, M., and JesusG, M. (2018). A
cloud-based giscience learning approach to spanish
national parks. European Journal of Geography, 9:6–
20.
CSEDU 2023 - 15th International Conference on Computer Supported Education
482
