
Visualizing Dynamic Data-Flow Analysis of Object-Oriented Programs
Based on the Language Server Protocol
Laura Troost, Jonathan Neugebauer
a
and Herbert Kuchen
b
Department of Information Systems, University of M
¨
unster, M
¨
unster, Germany
Keywords:
Data-Flow Analysis, Bytecode Analysis, Java Instrumentation, Software Testing, Integrated Development
Environment, Language Server Protocol.
Abstract:
Although studies emphasized the effectiveness of analyzing data-flow coverage as opposed to branch coverage
in the area of testing, there is still a lack of appropriate tools. We propose an approach to visualize data flows
of programs within code editors based on the Language Server Protocol (LSP). For this purpose, we define
extensions of the LSP to increase usability in the given application. Furthermore, we present a prototype with
implementations of a language server as well as the two language clients IntelliJ IDEA and Visual Studio
Code. Moreover, we outline how the different components can interact effectively based on the LSP to enable
the analysis and visualization of data-flows. We evaluate our prototype based on various benchmarks.
1 INTRODUCTION
Data-flow analysis determines the flow of definitions
and usages throughout a program and was origi-
nally developed for compiler optimization (Allen and
Cocke, 1976). In the last four decades, continuous re-
search has been focused on this topic (Su et al., 2017).
It has been applied to areas such as testing or test case
generation where studies have shown that the data-
flow-based coverage criteria are more effective than
the control-flow-based criteria such as branch cover-
age (Frankl and Weiss, 1993; Hutchins et al., 1994).
Hence, evaluating and generating test cases with re-
spect to the data-flow coverage is desirable (Troost
and Kuchen, 2022).
Due to the lack of appropriate tools for precisely
tracking the data flow of a program, a prototype called
Dacite (DAta-flow Coverage for Imperative TEsting)
was developed. It dynamically identifies the reach-
able data flows of a given Java program and con-
siders typical challenges such as aliasing and inter-
procedural data flows (Troost and Kuchen, 2022).
To facilitate the comprehensibility of the identi-
fied data flow, a graphical visualization of the output
of Dacite is needed. In order to provide direct feed-
back for the considered test cases and the program,
an integration of the visualization into the develop-
a
https://orcid.org/0000-0001-5865-7118
b
https://orcid.org/0000-0002-6057-3551
ment environment is preferable. However, because of
market segmentation there does not exist one mainly
used environment but a variety of development envi-
ronments that are utilized by different users (e.g., Vi-
sual Studio Code vs. IntelliJ). To reduce the imple-
mentation costs for developing the Dacite integration
and visualization for every major Integrated Devel-
opment Environment (IDE) separately, the LSP (Mi-
crosoft Corporation, 2022b) is an approach to extract
functionality from the editor into a separate compo-
nent named language server. This way, a centralized
implementation of common features can be reused for
different editors. In this context, editors are referred
to as language clients (Rask et al., 2021).
This paper introduces a graphical visualization of
the data flow and, thus, extends our original work on
Dacite (Troost and Kuchen, 2022). The main contri-
butions are:
• designing an approach for visualizing data flows
within code editors,
• designing a protocol based on the LSP suited
for the communication between a language server
and client for the purpose of analyzing and visu-
alizing data flows,
• developing a language server to make the core
functionalities of Dacite as well as features re-
lated to the visualization centrally available for
language clients,
Troost, L., Neugebauer, J. and Kuchen, H.
Visualizing Dynamic Data-Flow Analysis of Object-Oriented Programs Based on the Language Server Protocol.
DOI: 10.5220/0011743500003464
In Proceedings of the 18th International Conference on Evaluation of Novel Approaches to Software Engineering (ENASE 2023), pages 77-88
ISBN: 978-989-758-647-7; ISSN: 2184-4895
Copyright
c
2023 by SCITEPRESS – Science and Technology Publications, Lda. Under CC license (CC BY-NC-ND 4.0)
77

• developing integrations for the language clients
IntelliJ IDEA
1
and Visual Studio Code
2
.
The remainder of this paper is structured as fol-
lows. In Section 2, the data-flow analysis approach
of Dacite is explained. Section 3 illustrates the sys-
tem design of the prototype necessary for the graph-
ical visualization of the data flow. Afterward, Sec-
tion 4 describes the LSP. Therefore, it first explains
the concept of the LSP approach, which language fea-
tures can be utilized, and how it can be extended for
the data-flow visualization. Next, Section 5 describes
the prototype implementation for the language server
and two exemplary IDE integrations. In Section 6,
the results are evaluated and validated given bench-
marks examples. Section 7 summarizes the related
work concerning data flow and coverage visualiza-
tion. Section 8 concludes the results of this paper.
2 DATA-FLOW ANALYSIS
APPROACH
The concept of data flow considers the definition and
usage of data throughout the program. This informa-
tion can be represented by assigning definitions and
their corresponding usages to definition-usage chains
(DUCs), which can be defined as follows:
let X be a variable and S,S
′
,S
′′
instructions
def (S) :={ X | S writes to X}
use(S) :={ X | S reads from X }
If X ∈ def (S) ∪ use(S
′
) and X /∈ def (S
′′
) for
each S
′′
on any path from S to S
′
, (X,S, S
′
) forms a
definition-usage chain (Troost and Kuchen, 2022).
As already stated in the introduction, Dacite dy-
namically identifies reachable data flows of a given
Java Program and its JUnit tests. By using the dy-
namic approach of identifying the DUCs during the
execution, limitations of a static analysis such as iden-
tifying unreachable DUCs or using techniques like
overapproximation to detect variable aliases are pre-
vented (Denaro et al., 2014). Because the DUCs
are tracked during the execution, only those DUCs
can be identified that are covered by the given JUnit
tests. This information is essential when comparing
JUnit tests. For instance, in combination with our ex-
isting test-case generator (Winkelmann et al., 2022),
which produces one test-case for every path through
the classes under test, it can be used to reduce this
set of test-cases to an (almost) minimal set ensuring
data-flow coverage.
1
https://www.jetbrains.com/idea
2
https://code.visualstudio.com
2
*
DefUseChains
- defUseChains :
ArrayList<DefUseChain>
DefUseChain
- def : DefUseVariable
- use : DefUseVariable
DefUseVariable
- linenumber : int
- instruction : int
- varIndex : int
- value: Object
- method: String
- varName: String
DefUseField
- instance: Object
- instName: String
Figure 1: An overview of the DUCs implementation of
Dacite (methods omitted for the sake of clarity).
The dynamic analysis of Dacite is based on
the Java Virtual Machine (JVM) bytecode and Java
instrumentation with the open-source framework
ASM
3
. This allows modifying the existing classes of
the program on bytecode level before they are loaded
into the JVM. More precisely, methods tracking the
definition and usage of variables in the program are
automatically added to the program code to be able to
access this information during the execution. These
methods are then called during the execution and pass
the information to the analyzer class which is respon-
sible for collecting and analyzing this information in
order to derive the passed DUCs (Troost and Kuchen,
2022).
To define the information necessary for the data
flow analysis, Figure 1 illustrates the representa-
tion of the DUCs in Dacite. A DUC is imple-
mented by the class DefUseChain and consists of a
DefUseVariable instance for the definition and one
for the usage. Each instance of this variable has a list
of attributes. In order to allocate a usage to its defini-
tion, the corresponding variable or element has to be
uniquely identified. As the variable index, i.e. the in-
dex of the entry in the variable table, is reused due to
compiler optimization, the method name and instruc-
tion number are additionally utilized to assign defini-
tions and usages. Moreover, to enable users to relate
the data flow to their program code, the correspond-
ing variable name and line number are stored for each
definition and usage. The class DefUseField repre-
sents a special form of a definition or usage for an ob-
ject field or an array element. Therefore, a reference
to the related object or array has to be additionally
stored (Troost and Kuchen, 2022).
3
https://asm.ow2.io
ENASE 2023 - 18th International Conference on Evaluation of Novel Approaches to Software Engineering
78

3 SYSTEM DESIGN
Before describing the development of the prototype
and the LSP in detail, this section aims at explaining
general design decisions for the implementation of the
visualization.
As stated in Section 1, the data-flow visualization
should be shown in programming editors to provide
direct feedback for the considered test cases and the
program during development. However, as there ex-
ist alternative popular IDEs, one would have to im-
plement a Dacite integration for every major IDE to
reach the majority of programmers (Rask et al., 2021).
LSP is one way to reduce this implementation ef-
fort by decoupling the language features functionality
from the editor. When given m languages and n ed-
itors, without LSP m ∗ n implementations have to be
made. But by decoupling the common features into
a separate component, called language server, they
can be reused for different editors. Additionally, by
implementing a standardized LSP client endpoint for
every editor, referred to as language client, these can
be reused for different language servers as well. Con-
sequently, the previously mentioned problem of m ∗ n
implementations is reduced by LSP to m + n imple-
mentations (Rask et al., 2021). Although LSP was
originally developed to support the integration of pro-
gramming languages such as Java or C++, adoptions
have emerged for functionalities that are typically not
found for programming languages, e.g., in the context
of model checking or theorem proving (Rask et al.,
2021).
Hence, the Language Server Protocol (LSP) can
also be utilized in this scenario to reduce the overhead
of implementing a separate Dacite integration for ev-
ery major IDE. Consequently, different components
are necessary for the integration of Dacite into an IDE
via the LSP. Namely, next to the Dacite core which is
executing the dynamic data-flow analysis (cf. Section
2), a language server and an IDE plugin which serves
as the language client endpoint are needed. These
components are depicted in Figure 2. The language
server aims to extract all IDE independent function-
alities such as triggering the execution of Dacite and
transforming the data for the visualization while the
IDE client communicates via LSP with the language
server and visualizes the data for the user.
After explaining the system architecture, the visu-
alization and the necessary information for this pur-
pose need to be defined. To be able to comprehensi-
bly visualize the data-flow information as described in
Section 2, three types of visualizations are necessary.
First, to be able to start the Dacite analysis, the
user needs some form of interaction with the editor.
IDE Client
IDE Client
Language Server
Language Server
Dacite-CoreDacite-Core
LSP
Figure 2: Dacite components for IDE integration via LSP.
This can be done in form of a button for a JUnit test
or a link that can be clicked.
Second, the list of identified DUCs needs to be
shown to the user to give an overview of how many
and what kind of DUCs where detected. Thereby, the
data is assorted in a tree-like structure to the corre-
sponding classes, methods, and variables of the pro-
gram to allow users to view all DUCs, e.g., for a spe-
cific variable. When relating a DUC to its variable,
method, and class, one has to consider DUCs that
go over the boundary of one method or class, e.g.,
the definition is in one method and through passing
this variable as a parameter the usage is in another
method. Hence, the mentioned structure always re-
lates the DUCs according to their definitions. Figure
3 displays an example of this structure. Additionally,
each level should be expandable to avoid overwhelm-
ing the user with all information at once. This is espe-
cially relevant for large programs with many classes,
methods, and variables respectively. For each level
that does not correspond to a DUC, next to the name
of the class, method, or variable the number of sub-
ordinate DUCs is displayed. This gives an overview
of the distribution of the identified DUCs even when
levels are minimized. Moreover, for each DUC the
corresponding line numbers of the definition and us-
age are displayed for identification within the source
code. If the variable usage is located in a different
class or method, the location name is displayed as
well. The list of DUCs is generated by the Dacite core
analysis (cf. Figure 1). The transformation to the tree-
like structure like in Figure 3 can be decoupled by the
language server as this has to be performed for every
IDE and the result transferred to the IDE client which
displays it for the user.
The third type of visualization is the code high-
lighting in the editor in form of source code annota-
tions. It enhances the comprehensibility of the data
flow as it enables the user to directly relate the infor-
mation of the list of DUCs to the source code of the
program. Because these annotations can become con-
voluted for large programs with many DUCs, users
should be able to enable and disable it based on the
list of DUCs. So depending on the use case, users can
highlight all identified DUCs, all DUCs for a specific
Visualizing Dynamic Data-Flow Analysis of Object-Oriented Programs Based on the Language Server Protocol
79

class1 3 chains
method1 3 chains
variable1 2 chains
L2 L5
L2 method2 L30
variable2 1 chain
L6 L23
method2 0 chains
variable1 0 chains
Figure 3: An exemplary tree-like structure for visualizing
the list of DUCs.
variable, or a single DUC. This requires user inter-
action with the IDE for which the IDE client registers
the interaction and the language server determines the
position to-be-highlighted by the IDE. Moreover, to
make the code highlighting more understandable, col-
oring should be added to be able to differentiate the
data flow of variables, e.g, by coloring all DUCs of
variable a in a different color than variable b.
4 PROTOCOL DESIGN
In this section, more details of the protocol designed
to enable communication between the different com-
ponents are discussed. Based on a description of the
remote procedure call protocol JSON-RPC (JSON-
RPC Working Group, 2013) in Section 4.1, Sec-
tion 4.2 discusses relevant protocol messages speci-
fied in the LSP. Finally, Section 4.3 outlines exten-
sions of the LSP used within this work.
4.1 JSON-RPC
JSON-RPC is a remote procedure call protocol based
on the data interchange format JavaScript Object No-
tation (JSON) (T. Bray, 2013). In this work, remote
procedure calls are done between the language client
and server which are separate processes exchanging
messages based on standard input and standard out-
put. All messages sent are JSON objects containing
different attributes based on their type. Subsequently,
more details about the main object types are discussed
(JSON-RPC Working Group, 2013).
Request Object. A remote procedure call is initi-
ated by sending a request object. An example can
be seen in Listing 1. Besides specifying the protocol
version, an identifier is introduced which later is used
to correlate the request and response objects (cf. List-
ing 2). Additionally, the method to be invoked and
corresponding parameters are specified.
1 {
2 "jsonrpc": "2.0",
3 "id": 1,
4 "method": "add",
5 "params": [1, 2]
6 }
Listing 1: Exemplary JSON-RPC Request Object.
1 {
2 "jsonrpc": "2.0",
3 "id": 1,
4 "result": 3
5 }
Listing 2: Exemplary JSON-RPC Response Object.
A notification is a specialized request object for
which no response object is expected. Hence, no iden-
tifier is specified in notifications.
Response Object. In Listing 2, an exemplary re-
sponse object is shown. Similar to request objects, the
protocol version and an identifier must be specified.
Furthermore, the result of the request with a match-
ing identifier is provided. In case of errors, additional
information is encoded in response objects (e.g., error
type and description).
The params attribute of request objects as well as
the result attribute of response objects can be arbi-
trarily complex JSON values. Consequently, besides
primitive values such as numbers or strings, objects
and arrays are also allowed.
4.2 Language Server Protocol
The LSP is a protocol specifying messages intended
for the communication between a language client
(e.g., an IDE) and a language server providing a cen-
tralized implementation of common features. It is
based on the JSON-RPC and, thus, uses JSON objects
to encode messages. Subsequently, message types
relevant to this work are outlined (Microsoft Corpo-
ration, 2022b). In all code examples, the attributes
jsonrpc and id explained in the previous subsection
and expected by JSON-RPC are omitted for the sake
of clarity.
Lifecycle. Communication is initiated at the client
by starting the server process and sending an
initialize request to the server. One main informa-
tion exchanged during the initialization phase is the
capabilities. With these, the client and server spec-
ify which protocol features they support such that the
subsequent communication is tailored to the features
implemented by both.
In addition to starting the server, it is also the
client’s responsibility to shut down the server. For this
purpose, the client can use the shutdown request to
ENASE 2023 - 18th International Conference on Evaluation of Novel Approaches to Software Engineering
80

1 {
2 "method": "textDocument/didOpen",
3 "params": {
4 "textDocument": {
5 "uri": "file:///src/Demo.java",
6 "text": "public class Demo {...}"
7 }
8 }
9 }
Listing 3: Exemplary notification for an opened text docu-
ment (simplified).
1 {
2 "method": "textDocument/codeLens",
3 "params": {
4 "textDocument": {
5 "uri": "file:///src/Demo.java"
6 }
7 }
8 }
Listing 4: Exemplary code lens request (simplified).
ask the server to stop responding to regular requests.
After that, the server process will exit once an exit
request has been received.
Synchronization. To provide features such as infor-
mation about code annotations as described in Sec-
tion 3 to the client, the server needs to be synchro-
nized with the client. This is done based on dedi-
cated notification messages. An exemplary notifica-
tion that is sent from the client to the server once a
text document has been opened can be seen in List-
ing 3. By providing the file’s Uniform Resource Iden-
tifier (URI) as well as its content, the server can cache
a virtual file structure in order to perform, e.g., code
analysis.
Analogously to the presented notification for
opened documents, there are notifications once a doc-
ument was changed or closed. Both are used by the
server to update or clean up the virtual file structure,
respectively.
Command Execution. The server can hint the client
at positions in the source code from where command
executions can be done (e.g., executing the main
method or a test case). The client can use this in-
formation and display the execution option within the
editor (e.g., by displaying an executable link or a but-
ton on the side). In LSP, such hints are named code
lenses.
A client can request code lenses by sending a
corresponding request to the server (cf. Listing 4).
Within this request, the URI to the file of interest has
to be specified. Correspondingly, the server calculates
code lenses only for the given file.
As a response, the server provides an array of code
lenses. In Listing 5, an example is provided. A code
1 {
2 "response": {[{
3 "range": {
4 "start":
5 {"line": 7, "character": 10},
6 "end":
7 {"line": 7, "character": 15}
8 }
9 "command": {
10 "title": "Run Analysis",
11 "command": "dacite.analyze",
12 "arguments": [
13 "file:///src/Demo.java"
14 ]
15 }
16 }]}
17 }
Listing 5: Exemplary code lens response (simplified).
1 {
2 "response": {[{
3 "position":
4 {"line": 2, "character": 7},
5 "label": "Def"
6 }]}
7 }
Listing 6: Exemplary inlay hint response (simplified).
lens is defined by specifying the range in the text doc-
ument to which it applies. Additionally, information
about the command is given including a title to show
in the IDE’s user interface, a command identifier as
well as arguments needed for command execution.
The example in Listing 5 contains a command used
to trigger the execution of Dacite’s dynamic analysis.
Once a command is triggered from within the
IDE, a corresponding executeCommand request is
sent to the server including the command’s identifier
as well as required arguments. After finishing the ex-
ecution, the server responds with a result. This result
can be any arbitrary JSON value.
Code Annotations. Annotations rendered in place
with the source code are named inlay hints in the LSP.
A client can obtain such hints using an inlayHint re-
quest specifying the textDocument (cf. lines 4 ff of
Listing 4) and range (cf. lines 3 ff of Listing 5) of
interest.
As a response, the server sends back an array of
inlay hints. An example is shown in Listing 6. Based
on this specification, the editor would render the label
“Def” at the given editor position.
4.3 Protocol Extensions
In addition to standard protocol messages presented
previously, this subsection deals with protocol exten-
Visualizing Dynamic Data-Flow Analysis of Object-Oriented Programs Based on the Language Server Protocol
81

sions used in this work that enabled realizing selected
aspects of the designed visualization types as spec-
ified in Section 3. First, we introduce an extension
named tree view protocol. Then, we outline how dec-
orations for inlay hints are exchanged between the
client and server. Of course, such extended message
types are not supported by default in clients compat-
ible with the LSP. However, the standard protocol
messages are supported by all language clients and,
thus, ensure basic functionality.
Tree View Protocol. The tree view protocol (Metals,
2022) specifies protocol messages enabling the client
to render tree views. In this work, tree views are used
to provide an overview of identified DUCs (cf. Fig-
ure 3). Although not part of the LSP standard at the
time of writing, there exist implementations for the
tree view protocol at the server as well as the client
side making the adoption into this work easier (Met-
als, 2022).
Entries within tree views are named tree view
nodes. Every node can be identified using a node URI
and may have child nodes. Additionally, a tree view
command can be associated with a node enabling the
client to perform actions based on user interactions
with the node. In the following, two message types of
the tree view protocol (Metals, 2022) which are rele-
vant to this work are presented.
First, clients can request tree view nodes be-
longing to a given parent node by sending a
treeViewChildren request to the server. The parent
for which child nodes are requested is specified using
its node URI. In order to request a root node, the node
URI is left empty. The server responds with a list of
tree view nodes. Subsequently, the client requests the
children of all newly obtained nodes. An example is
given in Listing 7. For displaying purposes, each node
can be assigned a label and an icon. Furthermore,
it can be specified whether the node should be ex-
panded or collapsed by default. Lastly, the command
attribute is used to specify tree view commands which
work analogously to commands defined in the LSP
(cf. lines 9 ff of Listing 5).
Second, clients can request the parent’s node URI
of a particular node by sending a treeViewParent
request to the server.
Inlay Hint Decorations. By default, inlay hints can-
not be styled. However, to visualize multiple DUCs a
coloring greatly improves usability. Hence, this work
defines an extension to the inlayHint request. By
sending an inlayHintDecoration request specify-
ing the position of a particular inlay hint of inter-
est, a client can obtain styling information. This in-
cludes the text color and font style. An example of
the server’s response is shown in Listing 8.
1 {
2 "response": {[{
3 "nodeUri": "HelloWorld.method",
4 "label": "Method",
5 "command": { ... },
6 "icon": "method",
7 "collapseState": "expanded"
8 }]}
9 }
Listing 7: Exemplary tree view children response contain-
ing one child (simplified).
1 {
2 "response": {{
3 "color": [255, 0, 0, 255],
4 "fontStyle": "Serif"
5 }}
6 }
Listing 8: Exemplary inlay hint decoration response (sim-
plified).
5 PROTOTYPE DEVELOPMENT
Given the system architecture and visualization ap-
proach (cf. Section 3) as well as the protocol de-
sign (cf. Section 4) presented previously, this sec-
tion outlines more details on the development of the
different system components. First, Subsection 5.1
elaborates on the general interaction of the compo-
nents. Then, Subsections 5.2 and 5.3 provide more
details on the server and client implementations, re-
spectively. Further information on the implementa-
tion of the Dacite core library can be found in (Troost
and Kuchen, 2022). All source code for the prototype
is available on GitHub
4
.
5.1 Component Interaction
As explained in Section 3, the prototype consists of
three components interacting with each other (lan-
guage server, language client, and Dacite core). Fig-
ure 4 illustrates this communication based on the user
interaction with the IDE. The LSP lifecycle and syn-
chronization messages between the client and server
(e.g., the initialization upon the start of the IDE) are
omitted for the sake of clarity. Whenever the user
opens a Java file in the IDE, the language client sends
a codeLens request to the language server which an-
alyzes whether the corresponding file contains a JU-
nit
5
test. If this is the case, a code lens is returned
containing a position for which it is displayed as an
interaction for the user (e.g., in form of an executable
4
https://github.com/dacite-defuse/DynamicDefUse
5
https://junit.org
ENASE 2023 - 18th International Conference on Evaluation of Novel Approaches to Software Engineering
82
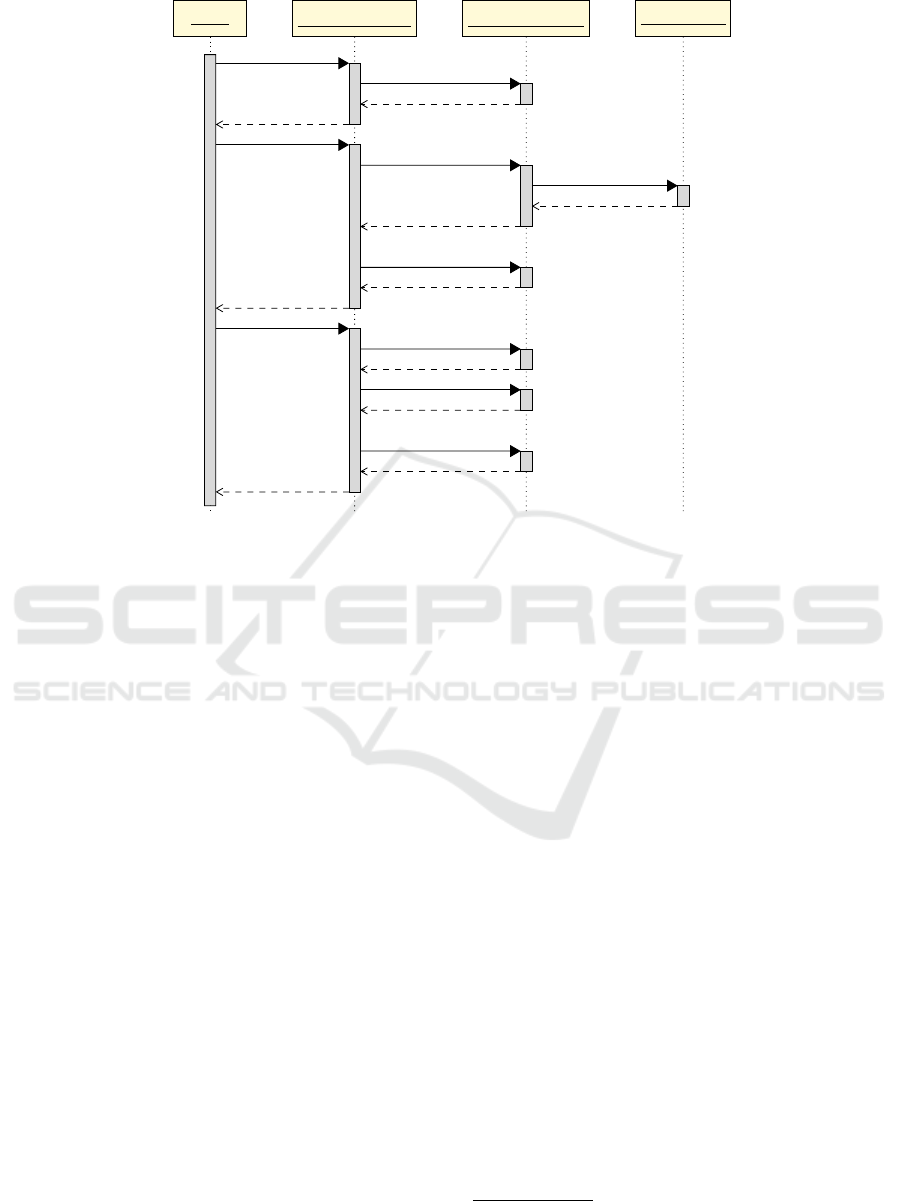
User
Language Client Language Server
Dacite Core
opens JUnit test
codeLens(params)
CodeLens
Display button
start Dacite Analysis
executeCommand
(dacite.analyze)
start Process
XML DefUseChains
treeViewChildren
(params)
List TreeViewChildren
list of DUCs
highlight DUC
executeCommand
(dacite.highlight)
inlayHints(params)
List InlayHints
inlayHintsDecoration
(params)
InlayHintsDecoration
source code
annotations
Figure 4: Sequence diagram illustrating the interaction between the user and the components, the client, the language server,
and Dacite core.
link or button). When the user utilizes this interac-
tion (e.g., by pressing the button), the client sends an
executeCommand request for the Dacite analysis to
the language server. This triggers the instrumenta-
tion and analysis process of Dacite core for the JU-
nit test case and the corresponding class files (Troost
and Kuchen, 2022). It returns an XML file containing
all identified DUCs as DefUseChains (cf. Figure 1).
This output is stored and transformed by the language
server to account for the tree-like structure grouping
all chains based on their class, method, and variable.
This way, when the client requests the tree view chil-
dren for the root node afterward, the language server
returns subsequently the grouped DUCs as tree nodes.
These are displayed by the client to the user.
Thereafter, the user has the possibility to interact
with the visualized list of DUCs, e.g., by clicking on
an entry or checking a box to enable the source code
annotations for all related DUCs. For instance, when
clicking on the method, all related DUCs which were
defined in this method are highlighted. When the user
triggers the source code annotations, the client sends
an executeCommand request to the language server
specifying which entry was clicked. The language
server internally saves this information, so that when
the client sends the inlayHints request for the doc-
ument subsequently the language server returns the
position of all DUCs which should be annotated. Af-
ter the request for inlay hints, the client requests for
each inlay hint the corresponding decoration includ-
ing the color and font style. With this information,
the annotations are rendered within the source code.
In addition to the three mentioned components,
common implementations related to the extension of
the LSP have been extracted into a library that is used
by both the language server as well as the client im-
plementation for IntelliJ IDEA. All components are
combined within a multi-project Gradle
6
build.
5.2 Language Server
The language server was implemented in Java based
on the lsp4j
7
library providing Java bindings for
the LSP. This way, the work needed for realizing
standard protocol messages could be reduced to im-
plementing appropriate interfaces. Additionally, cus-
tom interfaces were registered to account for the re-
quired LSP extensions mentioned previously. All de-
tails needed to enable the communication based on
the JSON-RPC protocol are handled by the lsp4j li-
brary (e.g., serializing and deserializing JSON). The
following paragraphs highlight selected aspects of the
language server implementation.
As mentioned in the previous subsection, the lan-
guage server obtains analysis results from Dacite
6
https://gradle.org
7
https://github.com/eclipse/lsp4j
Visualizing Dynamic Data-Flow Analysis of Object-Oriented Programs Based on the Language Server Protocol
83

core. This includes starting a new Java process, in-
strumenting the to-be-analyzed code by using a Java
agent and running the given JUnit test case. How-
ever, to be able to access the code, the server has to
make the classes of the project that should be ana-
lyzed available. Hence, the server collects directories
with *.class files as well as *.jar files and adds
these to the class path of the new Java process.
Furthermore, the language server combines the
analysis result delivered by Dacite core with infor-
mation extracted from parsing the source code. This
is necessary to identify exact positions for the inlay
hints. From the dynamic analysis only line num-
bers are provided but not column numbers which are
necessary to distinguish elements in one line. The
language server overcomes this limitation by explor-
ing the Abstract Syntax Tree (AST) corresponding to
the source code. The AST is obtained by using the
JavaParser
8
library. Each element in the AST can
be tracked back to its exact position in the source code
including line and column numbers. Hence, in order
to find the position of an inlay hint corresponding to
a variable definition or usage, the server identifies the
AST node corresponding to the variable in the spe-
cific line. Then, the column number can be obtained
as an property of the AST node.
JavaParser is also used to identify JUnit test
cases representing starting points for the Dacite an-
alyzer. For all identified tests, the server returns ap-
propriate code lenses.
5.3 Language Client
This section elaborates on the implementation of the
language client. By adhering to as many existing LSP
message types as possible, the effort to implement the
language client is minimized for IDEs that support the
LSP. In this case, the functionality of sending and
receiving these messages to and from the server and
displaying the information to the user is already im-
plemented and ready to use. However, custom ex-
tensions of LSP and their visualization still need to
be implemented for the client. Subsection 5.3.1 de-
scribes the integration of LSP and the implementation
of necessary message types for the IDE IntelliJ IDEA.
To showcase the adaptability to other IDEs, Subsec-
tion 5.3.2 describes the integration of the Dacite visu-
alization to Visual Studio Code (VS Code) with min-
imal effort by utilizing the standard LSP.
8
https://javaparser.org
Figure 5: Exemplary screenshot on how the Dacite trigger
is added as run line marker for JUnit Tests in IntelliJ.
5.3.1 IntelliJ IDEA
As LSP has emerged in recent years, many IDEs
such as IntelliJ do not support LSP per default.
However, additional plugins or libraries have been
developed which provide the standard LSP func-
tionality of communicating and synchronizing with
the server. For IntelliJ there exists the client library
lsp4intellij
9
which provides this language server
support. By adding this library to a custom IntelliJ
plugin implemented in Java and specifying the path
to the language server binary, the basic functionality
of communicating with the server is available, e.g,
for synchronization. The library also enables easy
integration of protocol extensions by providing
the interface LSPExtensionManager which allows
overriding existing messages or adding new ones
for the communication with the server. To add the
protocol extension for the tree view protocol and the
inlay hint decorations for the client and server consis-
tently, two interfaces, DaciteTreeViewService and
DaciteExtendedTextDocumentService respec-
tively, were defined specifying the requests with their
parameters and return types as shown in Section 4.3.
To visualize the information received from the
language server in adherence to the IntelliJ scheme
three parts need to be implemented (cf. Figure 4).
First, the possibility to trigger the Dacite analysis
needs to be displayed to the user. This information
is given to the client in form of a CodeLens contain-
ing an exact position within the source code where
this should be displayed if the opened file contains a
JUnit test case. For this position, similar to other run
configurations, a run line marker is added in the Intel-
liJ editor on the side (cf. Figure 5).
Second, the tree-like structure of DUCs has to be
displayed (cf. Figure 3). This is possible with the in-
ternal IntelliJ class Tree. After executing the Dacite
command, a new tool window is opened in the edi-
tor with the corresponding tree. To highlight the im-
portant information and allow a differentiation of the
types of information more clearly, each level is ren-
9
https://github.com/ballerina-platform/lsp4intellij
ENASE 2023 - 18th International Conference on Evaluation of Novel Approaches to Software Engineering
84

Figure 6: Exemplary screenshot of the Dacite visualization
in IntelliJ.
dered and complementary information displayed in a
lighter color (cf. Figure 6 on the right). Additionally,
a checkbox is added for every level allowing the user
to easily enable and disable the DUCs annotations.
By clicking on a checkbox, all subordinate check-
boxes are triggered as well to account for all DUCs
within the selected level.
Third, the source code annotations have to be dis-
played to the user. When interacting with a checkbox,
a command is sent to the language server updating
the visibility status of the corresponding inlay hints
(cf. Figure 4). Afterward, the inlay hints and their po-
sitions are retrieved from the language server. As all
subordinate DUCs are highlighted, the corresponding
positions can range in the complete document. Con-
sequently, all inlay hints of the document are updated.
Therefore, the existing inlay hints in the editor are re-
moved and the newly retrieved ones iterated. For each
iteration, the inlay hints decoration is retrieved from
the server such that the inlay hint can be displayed
with the color and font accordingly (cf. Figure 6 on
the left).
5.3.2 Visual Studio Code
Contrary to IntelliJ, VS Code provides generic sup-
port for the LSP based on a dedicated library (Mi-
crosoft Corporation, 2022a). Hence, all standardized
message types, such as inlay hints and code lenses,
are already implemented for the client and automat-
ically visualized. Although the tree view protocol is
not yet a part of the standardized LSP, support for
Figure 7: Exemplary screenshot of the Dacite visualization
in VS Code.
this message type has been implemented for VS Code
(Metals, 2022). Therefore, VS Code supports all nec-
essary protocols for the Dacite integration except the
inlay hint decorations without custom implementation
effort. However, this information is only designed to
enhance usability and does not contain crucial infor-
mation. The steps required to integrate Dacite into
VS Code mainly involved configuring how the lan-
guage server binary is started. The remaining com-
munication with the server and visualization in the
editor is performed by the standard language client
implementation.
Figure 7 shows the visual integration of Dacite for
VS Code using the provided client implementations.
Small custom visual adaptions to increase usability
and comprehensibility similar to IntelliJ still have to
be made. However, all necessary information is al-
ready available. This minimal effort in integrating
Dacite into another IDE underlines the added value
of utilizing the LSP for the communication involved
in analyzing and visualizing data flows.
6 EVALUATION
In order to evaluate and validate the results of the
data-flow analysis and its visualization as a proof of
concept, the prototype was executed for a set of dif-
ferent examples. The data-flow analysis was already
evaluated for a set of smaller examples (Troost and
Kuchen, 2022). Due to the lack of comparable tools,
the validation was executed manually which is not
feasible for larger examples with several hundreds
of DUCs. By adding a comprehensible visualiza-
tion to the data-flow output, this impediment is mit-
igated so that the validation of larger examples is fa-
cilitated. Three larger examples are retrieved from the
Visualizing Dynamic Data-Flow Analysis of Object-Oriented Programs Based on the Language Server Protocol
85

Table 1: Executed examples for the data-flow analysis and its visualization. LOC, number of program classes, number of
identified DUCs, and run times in ms without and with Dacite execution and its visualization based on LSP.
Example LOC Classes DUCs without with
Dacite Dacite
svComp.alarm 2,171 16 236 10 ms 428 ms
svComp.printtokens 623 4 155 4 ms 339 ms
svComp.siena 2,113 11 212 6 ms 368 ms
binaryTree 210 4 288 42 ms 390 ms
AVL 321 4 321 38 ms 495 ms
SV-COMP set of software verification. SV-COMP is
an annual competition for software verification that
releases a publicly available repository as a bench-
mark suite for verification and validation software
tools (Beyer, 2021). The alarm example implements
a complex alarm system, while printtokens uses a
stream reader to parse given input and process it fur-
ther. Siena is an event notification middleware and
uses encoding for its notification. Those three ex-
amples were selected for their complexity in the con-
text of data flows including aliasing and the data flow
spanning over multiple methods and classes. To also
account for different types of data structures, two fur-
ther examples were added (binaryTree, AVL) which
provide different operations for their tree structures.
All examples consist of at least four different classes
and range from 210 to 2171 Lines of Code (LOC)
(cf. Table 1).
For all the mentioned examples, JUnit test cases
were added for the execution. As discussed in
(Troost and Kuchen, 2022), analyzing the program
with Dacite introduces a small overhead to the exe-
cution ranging in milliseconds which is still accept-
able when performing program analysis. However,
by adding a visualization including program pars-
ing and communication between the language server
and client, additional overhead is introduced. This is
again analyzed by executing the JUnit test cases of the
examples with and without Dacite and its visualiza-
tion. As the Dacite visualization is dependent on sev-
eral user interactions which impedes comparable run
time measurements, the source code annotations for
the identified DUCs are enabled per default for this
analysis. This way, the execution time with Dacite
is measured from the moment the user triggers the
Dacite analysis until the list of DUCs and the source
code annotations are shown. Note that the initializa-
tion and synchronization of the language server upon
startup of the language client as well as the display
of a code lens is neglected for this run time measure-
ment as this is not an essential part of the analysis but
the language client. The results of this run time anal-
ysis can be seen in Table 1. While the run time of
the execution with Dacite is higher than without, it is
still ranging in milliseconds and, thus, is acceptable
for the analysis of Java programs.
Deriving all possible DUCs for each example per
hand for validation is not feasible as these consist of
several hundred chains (cf. Table 1). However, due to
the advanced visualization and source code highlight-
ing the data flow can be comprehended and missing
chains identified by a missing annotation. This is es-
pecially relevant in the context of test case generation.
By visualizing all tracked DUCs in the source code,
the user can identify which parts of the program and
its corresponding data flow were not covered by the
given JUnit tests.
7 RELATED WORK
As stated in the introduction, there exists a lack of
appropriate tools for precisely tracking the data-flow
information of a program (Su et al., 2017; Troost
and Kuchen, 2022). The large majority of tools are
limited to the static analysis of the data flow which
impedes the identification of aliases and distinction
of traversable and non-traversable DUCs. Moreover,
these tools are either not available or not working re-
liably (Troost and Kuchen, 2022). Only two tools
provide a visualization of the data flow information.
JaBUTi (Java Bytecode Understanding and Testing)
displays the data-flow graph and highlights the asso-
ciated lines in the source code. However, the tool is
a standalone application and not integrated into any
IDE and is not able to discern different usages or def-
initions in one line (Vincenzi et al., 2003; Vincenzi
et al., 2006). The other tool, DFC (Data Flow Cover-
age) is an Eclipse plugin. Here, the visualization con-
sists of the data flow graph and a list of found DUCs.
Moreover, an interface is given as the data flow is not
derived completely automatically but by interacting
with the user (Bluemke and Rembiszewski, 2009).
Another similar tool is the JaCoCo library which
provides code coverage analysis in JVM-based en-
vironments. It is open-source and can be integrated
ENASE 2023 - 18th International Conference on Evaluation of Novel Approaches to Software Engineering
86

into different tools, e.g., Eclipse or IntelliJ. Similar to
Dacite, it visualizes the identified coverage informa-
tion in a tree-like table and enables source code anno-
tations. However, JaCoCo does not support data flow
analysis but focuses on other coverage metrics such
as branch coverage or line coverage. Moreover, each
IDE integration was developed separately and is not
based on the LSP (EclEmma, 2017).
The Language Server Protocol (LSP) has been
utilized for the integration of various programming
languages. Additionally, extensions for functionali-
ties that are not typically not needed for integrating
programming languages have emerged, e.g., in the
context of model checking or theorem proving (Rask
et al., 2021). However, to the best of our knowledge,
the LSP has not yet been applied to the area of code
coverage.
8 CONCLUSION AND OUTLOOK
Considering that there is a lack of appropriate tools
for the analysis of the data flow within a program,
this paper introduced an approach to visualize DUCs
within code editors based on the LSP. After present-
ing some background on how the data flow is ana-
lyzed, we outlined the system design. Then, we de-
scribed how the LSP is employed in our use case
and introduced protocol extensions for selected as-
pects enabling a more comprehensible visualization.
Based on this, we presented a prototype including im-
plementations of a language server and two language
clients (IntelliJ IDEA and VS Code). We specifically
outlined how the components interact based on the
LSP. We evaluated and validated our results based on
five benchmark examples and also pointed out related
work.
Future work should integrate the language server
with support for the custom extensions to additional
popular IDEs such as Eclipse in order to make it
greatly available for Java developers. Also, plugins
for build tools such as Maven
10
and Gradle
11
should
be implemented. This way, Dacite could be used as
part of the build pipeline and the analysis output (i.e.,
the XML file) could be used by third-party tools for
further applications. Moreover, by deriving the data
flow information during the execution, only those data
flows are considered that have been passed. Enabling
a visualization for this data flow is a first step for iden-
tifying data flow which was not passed. In the future,
we plan to integrate the dynamic analysis of Dacite
10
https://maven.apache.org
11
https://gradle.org
with symbolic execution to be able to identify the
data flow of every executable path of a given program
(Winkelmann et al., 2022). This way, DUCs which
were not covered by given JUnit test cases could be
identified and forwarded to the user.
REFERENCES
Allen, F. E. and Cocke, J. (1976). A program data flow
analysis procedure. Communications of the ACM,
19(3):137.
Beyer, D. (2021). Software verification: 10th comparative
evaluation (sv-comp 2021). Proc. TACAS (2). LNCS,
12652.
Bluemke, I. and Rembiszewski, A. (2009). Dataflow test-
ing of java programs with dfc. In IFIP Central and
East European Conference on Software Engineering
Techniques, pages 215–228. Springer.
Denaro, G., Pezze, M., and Vivanti, M. (2014). On the right
objectives of data flow testing. In 2014 IEEE Seventh
International Conference on Software Testing, Verifi-
cation and Validation, pages 71–80. IEEE.
EclEmma (2017). JaCoCo. https://www.jacoco.org/jacoco.
Last accessed November 14, 2022.
Frankl, P. G. and Weiss, S. N. (1993). An experimental
comparison of the effectiveness of branch testing and
data flow testing. IEEE Transactions on Software En-
gineering, 19(8):774–787.
Hutchins, M., Foster, H., Goradia, T., and Ostrand, T.
(1994). Experiments on the effectiveness of dataflow-
and control-flow-based test adequacy criteria. In Pro-
ceedings of 16th International conference on Software
engineering, pages 191–200. IEEE.
JSON-RPC Working Group (2013). JSON-RPC 2.0 Spec-
ification. https://www.jsonrpc.org/specification. Last
accessed November 14, 2022.
Metals (2022). Core Components and Native Compo-
nents. https://scalameta.org/metals/docs/integrations/
tree-view-protocol. Last accessed November 14,
2022.
Microsoft Corporation (2022a). Language
server extension guide. https://code.
visualstudio.com/api/language-extensions/
language-server-extension-guide. Last accessed
November 14, 2022.
Microsoft Corporation (2022b). Language Server Protocol
Specification - 3.17. https://microsoft.github.io/
language-server-protocol/specifications/lsp/3.17/
specification. Last accessed November 14, 2022.
Rask, J. K., Madsen, F. P., Battle, N., Macedo, H. D.,
and Larsen, P. G. (2021). The specification language
server protocol: A proposal for standardised LSP ex-
tensions. Electronic Proceedings in Theoretical Com-
puter Science, 338:3–18.
Su, T., Wu, K., Miao, W., Pu, G., He, J., Chen, Y., and
Su, Z. (2017). A survey on data-flow testing. ACM
Computing Surveys (CSUR), 50(1):1–35.
Visualizing Dynamic Data-Flow Analysis of Object-Oriented Programs Based on the Language Server Protocol
87

T. Bray, E. (2013). The JavaScript Object Notation (JSON)
Data Interchange Format. RFC 7158.
Troost, L. and Kuchen, H. (2022). A comprehensive dy-
namic data flow analysis of object-oriented programs.
In Proceedings of the 17th International Conference
on Evaluation of Novel Approaches to Software En-
gineering - Volume 1: ENASE, pages 267–274. IN-
STICC, SciTePress.
Vincenzi, A., Wong, W., Delamaro, M., and Maldonado,
J. (2003). Jabuti: A coverage analysis tool for java
programs. XVII SBES–Simp
´
osio Brasileiro de Engen-
haria de Software, pages 79–84.
Vincenzi, A. M. R., Delamaro, M. E., Maldonado, J. C.,
and Wong, W. E. (2006). Establishing structural test-
ing criteria for java bytecode. Software: practice and
experience, 36(14):1513–1541.
Winkelmann, H., Troost, L., and Kuchen, H. (2022).
Constraint-logic object-oriented programming for test
case generation. In Proceedings of the 37th
ACM/SIGAPP Symposium On Applied Computing,
pages 1490–1499.
ENASE 2023 - 18th International Conference on Evaluation of Novel Approaches to Software Engineering
88
