
Smart Placement of Routers in Agricultural Crop Areas
P. H. G. Coelho, J. F. M. Amaral, K. P. Guimarães, E. N. Rocha and T. S. Souza
State Univ. of Rio de Janeiro, FEN/DETEL, R. S. Francisco Xavier, 524/Sala 5001E, Maracanã, RJ, 20550-900, Brazil
thaynans.souza@gmail.com
Keywords: Genetic Algorithms, Fuzzy Systems, Precision Agriculture, Artificial Intelligence Applications.
Abstract: The utilization of technologies in agriculture, which is called precision agriculture, is progressively necessary
to optimize crop yields. The purpose of this paper is to present an optimized positioning of routers, seeking a
robust topology of the network, in order to cover the sensor monitoring devices spread in an agricultural crop
area, sending data such as temperature, soil humidity, incidence of luminosity, etc., which allows the farmer
to make better decisions regarding the cultivation of his/her land. For this, genetic algorithms will be used to
determine the location of routers in a network through evolutionary techniques associated with a fuzzy
aggregation method. Typical application cases are presented and discussed to illustrate the proposal.
1 INTRODUCTION
Family farming is responsible for producing about
70% of the food that is available for consumption by
the Brazilian population. It is made up of small rural
producers, traditional peoples and communities,
foresters, aqua culturists, extractivists and fishermen.
The sector stands out for the production of corn,
manioc root, vegetables, beans, sugarcane, rice,
swine, poultry, coffee, wheat, castor beans, fruit and
vegetables. In family farming, the management of the
property is shared by the family and the agricultural
production activity is the main source of income. In
addition, the family farmer has a particular
relationship with the land, his place of work and
residence. Productive diversity is also a striking
feature of this sector, as it often combines subsistence
production with production destined for the market.
Family farming contributes to the generation of
income and employment in the countryside and also
improves the level of sustainability of activities in the
agricultural sector.
Nowadays, the utilization of technologies in
agriculture, which is called precision agriculture, is
progressively necessary to optimize crop yields.
Challenges include effects of climate change to the
agricultural systems which can drastically reduce
agricultural productivity. In this direction, a recent
work in (Del Felipe et al., 2022) proposes a network
of wireless sensors applied to precision agriculture.
The sensor network collects data on environmental
variables such as soil moisture, temperature, and
ambient humidity. This data is sent wirelessly to a
head node responsible for uploading the information
to an Internet of Things (IoT) platform. Another
research paper (Dasig, 2020) shows recent advances
in Agriculture 4.0. Business models are discussed in
(Medici et al., 2021) to identify possible agribusiness
models for developed and developing countries,
particularly for the European context and sub-
Saharan Africa and South Asia-Pacific area. Smart
IoT based approach is proposed in (Sreeja et al.,
2020) which consists of three sensors, a Wi-Fi
module and a dc motor, to measure and display the
different parameters for the crop.
Technological advances have had a great impact
on Brazilian agriculture; however, family farming is
still taking slow steps in direction. Therefore, it is
vitally important to implement technological
technical support resources in family farming, relying
on government funding and making it possible to
increase production efficiency, which leads to an
increase in production and, consequently, its gains.
The purpose of this article is to optimize the
positioning of routers, seeking a robust topology of
the network, in order to cover the sensor monitoring
devices spread in an agricultural crop area, sending
data such as temperature, soil humidity, etc., which
allow the farmer to make better decisions regarding
the cultivation of his/her land. However, in practice,
the purely random positioning of router nodes can
result in poor communication performance with the
Coelho, P., Amaral, J., Guimarães, K., Rocha, E. and Souza, T.
Smart Placement of Routers in Agricultural Crop Areas.
DOI: 10.5220/0011744800003467
In Proceedings of the 25th International Conference on Enterprise Information Systems (ICEIS 2023) - Volume 1, pages 99-106
ISBN: 978-989-758-648-4; ISSN: 2184-4992
Copyright
c
2023 by SCITEPRESS – Science and Technology Publications, Lda. Under CC license (CC BY-NC-ND 4.0)
99

sensor monitoring devices. In addition, the actual
deployment may need to consider restrictions and
geographic characteristics of the area in question,
making it necessary to search for different topologies
to distribute them. In fact, layout is a critical aspect in
mesh wireless networks. As such a problem is of the
NP hard type, one motivation to solve the mesh router
placement problem and look for the optimal solution
with adequate performance is to follow an approach
using evolutionary techniques that involve genetic
algorithms, including fuzzy aggregation. A wireless
mesh network (WMN) can be understood as a
communication network composed of radio links
planned in a mesh topology. There are two types of
nodes in WMNs: routers and clients. The group of
mesh routers, connecting to each other, forms the
backbone for the set of clients that aggregate the
mesh. Some mesh routers act as Internet gateways to
intermediate data traffic between the Internet and the
WMN. The low design cost and quick installation of
WMNs makes them a cost-effective choice for
establishing wireless connectivity for mobile users
anytime, anywhere. These characteristics can be
useful mainly in regions or developing countries,
whose decreasing costs of implantation and
maintenance of infrastructure can make possible
automations in several levels, optimizing levels of
production and income of small family farmers. The
good quality and operability of WMNs depends
heavily on placing mesh router nodes in the desired
area to achieve network connectivity, stability and
coverage. The placement of routers in a mesh network
is not a trivial problem. Typically, this is a problem
that can be solved using traditional evolutionary
techniques such as weighted-sum approach genetic
algorithms or Pareto-based techniques. Weighted-
sum evaluation for genetic algorithms leads to
difficult assignment of appropriate weights, while
Pareto techniques require the designer to select the
most suitable solution among the set of presented
solutions.
Several studies using intelligent computational
systems have been carried out by universities and
research centers around the world. In (Girgis et al.,
2014) genetic algorithm and simulated annealing is
used to search for a low-cost network with restrictions
and determine the minimum number of routers. In
(Rezaei et al., 2011) a genetic algorithm coupled with
circle packing techniques is proposed which consists
of positioning non-identical circles without
overlapping within another circle, maximizing
connectivity and coverage of the area network.
Router Nodes Placement Using Artificial Immune
Systems is used in (Coelho et al., 2017), and (Coelho
et al., 2015) for industrial applications. Recently,
coyote optimization algorithm was used to solve the
mesh router nodes placement in wireless mesh
networks (Mekhmoukh Taleb et al., 2022). The
authors claim good results in simulations carried out
for typical scenarios. In this work, we use genetic
algorithms to determine the location of routers in a
mesh network through evolutionary techniques
associated with a fuzzy aggregation method (Coelho
et al., 2019).
This paper is organized into four sections. The
second section deals with modeling the problem
followed by discussion of the case studies in section
three. Finally, section four closes the article with
conclusions.
2 HYBRID FUZZY- GENETIC
PROPOSED MODEL
The model used to solve the mesh router placement
issue was developed considering its multi-objective
aspect. In addition to the full coverage of the
acquisition points (sensor monitoring devices),
restriction zones were proposed in two scenarios,
making it difficult to install the routers. To meet these
requirements, a fuzzy-genetic approach was used,
which proposes a fusion of Genetic Algorithm and
Fuzzy Logic techniques (Coelho et al., 2019).
The genetic algorithm (GA) is inspired by
biological evolution, since it makes use of a selection
of individuals, using genetic operators and operates in
a random and oriented way, seeking an optimal
solution within a population. The main application of
genetic algorithms is to solve optimization problems
with very large or complex search areas, which makes
the use of traditional techniques impractical. In the
case of a search, a comparison is made between the
evolution of the species and the problem in question:
a population of individuals (possible solutions)
identified by chromosomes are evaluated and
associated with an aptitude and subjected to a process
of evolution, through selection. and reproduction, for
several generations. Fitness is the quality of the
individual result compared to the general fitness
transferred (Coelho et al., 2019).
The objective function or fitness is defined based
on the problem specification and is critical for
successful implementation. In general, the objective
function involves only a single criterion. However,
most real problems involve more than one objective
to be considered, so the objective function must use
methods to convert vector quantities into a scalar. The
general parameters of the GA influence its
performance and can be used to establish a stopping
ICEIS 2023 - 25th International Conference on Enterprise Information Systems
100
criterion to run the algorithm. Such parameters
include population size, maximum number of
generations and operator application rate. The choice
of parameters must meet established empirical
criteria or the specific characteristics of the problem.
In order to carry out multi-purpose case studies on
genetic algorithms we can use a fuzzy aggregation
method.
The use of fuzzy systems makes it possible to
simultaneously evaluate all objectives, integrating
user preferences in relation to each objective and for
each situation. This feature offers a good advantage
over multi-objective Pareto optimization methods, as
it does not require user interference to choose the best
solution at the end of the process, since preferences
or specifications are entered before evolution in a
simpler and more interpretable way through fuzzy
logic, so the evolution process is guided in the
direction of pre-established preferences. Each
individual in the GA population represents a possible
solution to the problem. During the evaluation
process, individuals are submitted to the function or
model that describes the problem and the results
obtained in relation to each objective are used as
inputs to the fuzzy system. For each individual in the
population, the fuzzy aggregation method is applied,
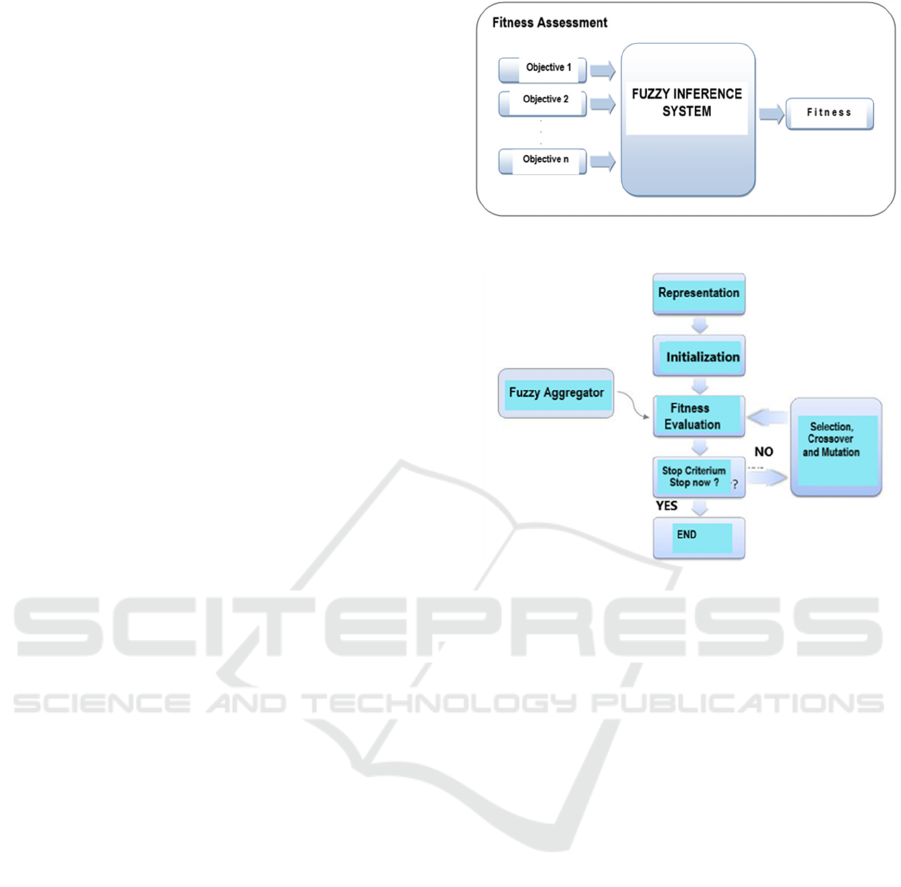
producing a single physical fitness value. Figure 1
illustrates the evaluation model using the Fuzzy
Aggregation Method. The selection, crossover,
mutation, population size and maximum number of
generations rates are defined by the designer before
starting the algorithm. The fuzzy aggregator rules are
designed to meet the preferences needed to solve the
problem, considering each objective. Evolution ends
when a certain stopping criterion is reached. The most
frequent stopping criterion is specified by a certain
maximum number of generations. Another possibility
is to establish a fitness value to be reached or stop the
execution of the algorithm when there is no evolution
for a certain number of generations. After evaluating
all individuals of the current generation, the genetic
algorithm continues the evolution process. The fuzzy
aggregation system presents the usual functioning of
a fuzzy inference system. Each system input
corresponds to an objective and membership
functions are triangular or trapezoidal in shape. The
genetic algorithm with the incorporation of the fuzzy
aggregator used in this work follows the model
presented in Figure 2.
Figure 1: Fuzzy evaluation model with aggregator system.
Figure 2: Genetic algorithm and fuzzy aggregator.
3 CASE STUDIES
In this work, three scenarios were considered for case
studies whose objective was positioning low power
battery operated routers for a mesh network to be used
for data acquisition in an agricultural environment of
size 50 m x 50 m. In all of them, the Matlab Fuzzy
Toolbox was applied.
In the first study, the genetic algorithm was used
with the sole objective of positioning the routers so
that each monitoring point in the field was covered by
at least one router.
In the other two studies, it was considered that, in
the same field, there are areas with a higher or
hindering installation cost. Therefore, these areas
were considered not suitable for installing routers. In
this way, the genetic algorithm was used together
with a fuzzy aggregation method to perform a multi-
objective application where it is desired to position
routers so that each monitoring point is in contact
with at least one router installed in a low-cost area.
The specification of data acquisition points as well as
the interconnection between the routers is not part of
the scope of this work.
Smart Placement of Routers in Agricultural Crop Areas
101
3.1 First Case Study
The environment of this first case study is an
agricultural area of 2500 m
2
, where the distribution of
routers must be carried out in such a way that each
monitoring point is covered by at least one router.
Each soil condition monitoring device consists of a
low power SoC (System On a Chip) IoT
microcontroller, equipped with sensors, battery
operated, capable of sending data within only 13
meters. Sensors such as temperature, soil moisture,
incidence of luminosity and relative humidity. air and
soil pH can be connected to the monitoring device.
The organization adopted for the routers is
homogeneous (all routers have the same
characteristics) and irregular. In order to achieve
these goals a traditional single-target genetic
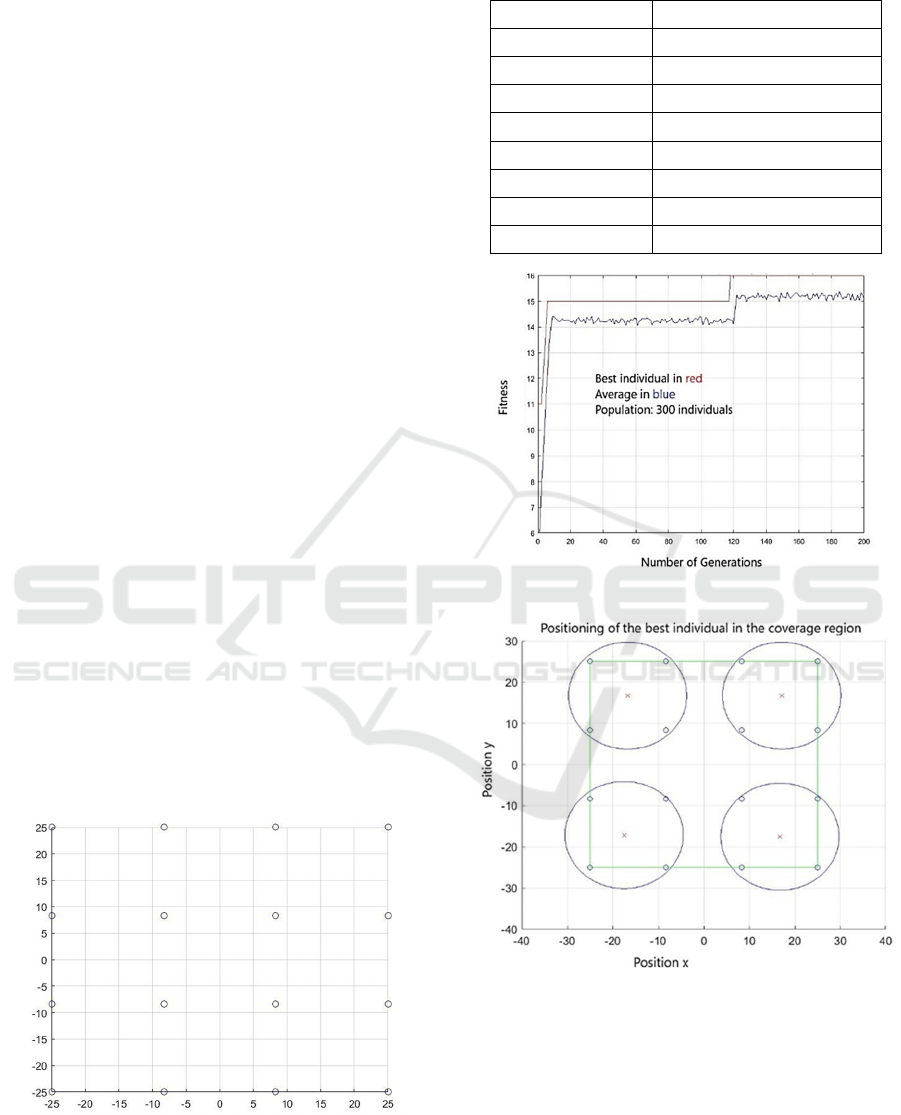
algorithm is used. The 16 monitoring points are
positioned in the area, as shown in Figure 3. It is a
single-objective problem, with a strictly objective
assessment: to maximize the number of points
covered.
The values of the parameters of the genetic
algorithm are presented in Table 1. Such values led
the algorithm to find a satisfactory solution to this
simple case study.
Figure 4 shows the fitness curve of the best
individuals and the average population.
Figure 5 shows the location of the monitored
points and the positioning of the routers for the best
individual reached by the GA. The green square in
Figure 5 represents the area of the land in question
(50m x 50 m), the smaller blue circles are the
monitoring points and the large blue circles represent
the area that each of the routers is covering, the
routers being represented by the " x" in red.
Figure 3: Location of the 16 monitoring points, Case study 1.
Table 1: GA Parameters for case study 1.
Parameters Values
Generations 200
Search Re
g
ion X=[-25, 25]; Y=[-25, 25]
Po
p
ulation 300
Precision 50 cm
F
itness Number of covered
p
oints
Selection Geometric Normalization 8%
Crossover rate 80%
Mutation rate 1%
Figure 4: Fitness curve for case study 1.
Figure 5: Routers’ positioning for case study 1.
It can be seen that the routers were positioned
satisfying the established criteria, since each
monitoring point is being covered by a router. This
first study did not take into account differences in the
cost of installing the routers in relation to areas with
more difficult access. Considering that cost is
something that is important to be reduced in most
projects, mesh networks would be no different.
Therefore, the proposal of the second case study is to
ICEIS 2023 - 25th International Conference on Enterprise Information Systems
102

configure the network taking into account the
installation costs.
3.2 Second Case Study
As in the first case study, the environment is an
agricultural area of 2500 m
2
, where the spatial
distribution of the routers must be carried out. The
monitoring device has a range of 13 m and the
organization of the routers is homogeneous (all
routers have the same characteristic) and irregular.
For this scenario it is necessary that:
- each monitoring point is covered by at least one
router;
- the routers are not positioned in places where the
installation cost is high.
So, we have a multi-objective problem: covering the
area and reducing costs.
To achieve these goals, a genetic algorithm is used
in conjunction with a fuzzy aggregation scheme.
The developed fuzzy system is of the Mamdani
type, characterized by being simpler and more
interpretable than TSK-type systems, and all rules
have the same degree of importance, that is, weights
equal to one.
The fuzzy aggregation system has two inputs:
“NCS” (Number of Covered Sensor monitoring
devices) and "Cost". Both inputs have 3 membership
functions. The output is the Fitness that receives an
evaluation between 0 and 10, and also has 3
membership functions. The system uses the default
Matlab configuration (And method = min ; Or method
= max; Implication = min; Aggregation = max).
The Defuzzification method is the mean of
maxima (MoM).
Figure 6 shows the fuzzy aggregation system used
in this case study.
Figure 6: Fuzzy aggregation system for case study 2.
Figure 7 shows the "NCS" (Number of Covered
Sensor monitoring devices) input membership
functions.
Figure 7: NCS membership functions for case study 2.
Figure 8: Cost membership functions for case study 2.
Figure 9: Fitness membership functions for case study 2.
Smart Placement of Routers in Agricultural Crop Areas
103

Similarly, Figure 8 illustrates the “Cost”
membership functions. Finally, Figure 9 shows the
membership functions for the output (Fitness) of the
fuzzy system.
The Fuzzy Aggregator rules, as shown in Figure
10, are as follows:
1. If (NCS is low) and (Cost is low)
then (Fitness is poor)
2. If (NCS is low) and (Cost is medium)
then (Fitness is poor)
3. If (NCS is low) and (Cost is high)
then (Fitness is poor)
4. If (NCS is medium) and (Cost is low)
then (Fitness is poor)
5. If (NCS is medium) and (Cost is medium)
then (Fitness is poor)
6. If (NCS is medium) and (Cost is high)
then (Fitness is poor)
7. If (NCS is high) and (Cost is low)
then (Fitness is good)
8. If (NCS is high) and (Cost is medium)
then (Fitness is medium)
9. If (NCS is high) and (Cost is high)
then (Fitness is poor)
Figure 10: Fuzzy aggregator rules for case study 2.
It should be noted that the system is quite
interpretable from the 9 rules presented. In other
words, it is important to note that the 9 rules can be
reduced to just 5. Indeed, it is noted that when NCS is
low or medium, the Cost does not matter. No matter
the Cost, Fitness will be poor (2 rules). It only makes
sense to evaluate the Cost when NCS is high (3 rules).
Some tests were performed changing the values of
the parameters of the genetic algorithm and it was
observed that the same parameters of case study 1
also led to good results in case study 2.
Figure 11 shows the area, the location of
monitoring devices, and the regions with restrictions
on the installation of routers, where warehouses
restrict the placement of routers.
Figure 11: Routers’ positioning for case study 2.
Figure 12 shows the curve of the best individual and
the average fitness of the population. From the plots
it can be seen that the best individual reached the
maximum fitness around the 30th generation and the
average followed this evolution.
Figure 12: Fitness curve for case study 2.
The green square in Figure 11 represents the coverage
area (50 m x 50 m), the smaller blue circles are the
monitoring points, the larger blue circles represent the
area that each of the routers is covering. The red x are
the routers and the red squares are the regions of the
area where the cost of installing routers is high. In the
same figure it can be seen that the routers were
positioned according to the established criteria, since
each monitoring point is to be covered by a router and
no router was positioned in the area where the
installation cost is high. It can also be observed that,
with the restriction of positioning the routers in areas
ICEIS 2023 - 25th International Conference on Enterprise Information Systems
104
of higher cost, it was necessary to use one more router
to cover the area, totaling five routers. Such
additional cost of routers should obviously outweigh
installing a router rather than higher cost. The results
obtained in the simulations fulfilled their objective of
determining the positioning of routers in the network.
3.3 Third Case Study
In this case, restrictions closer to real scenarios were
proposed. Based on the same basic setup as the
previous ones, the restrictions in this one are a stream
that crosses the land (where, of course, you don't want
to place sensors, nor is it possible to install routers)
and a 10 m x 15 m tool shed, which also restricts the
installation of the routers. Sensors were repositioned
out of the waterway.
For comparison purposes, the same parameters as
in the previous case were kept in the Fuzzy
aggregator. It can be seen that the optimized
positioning suggested in this case is different from the
previous one, which was in fact expected, given the
changes in the restriction regions and sensor
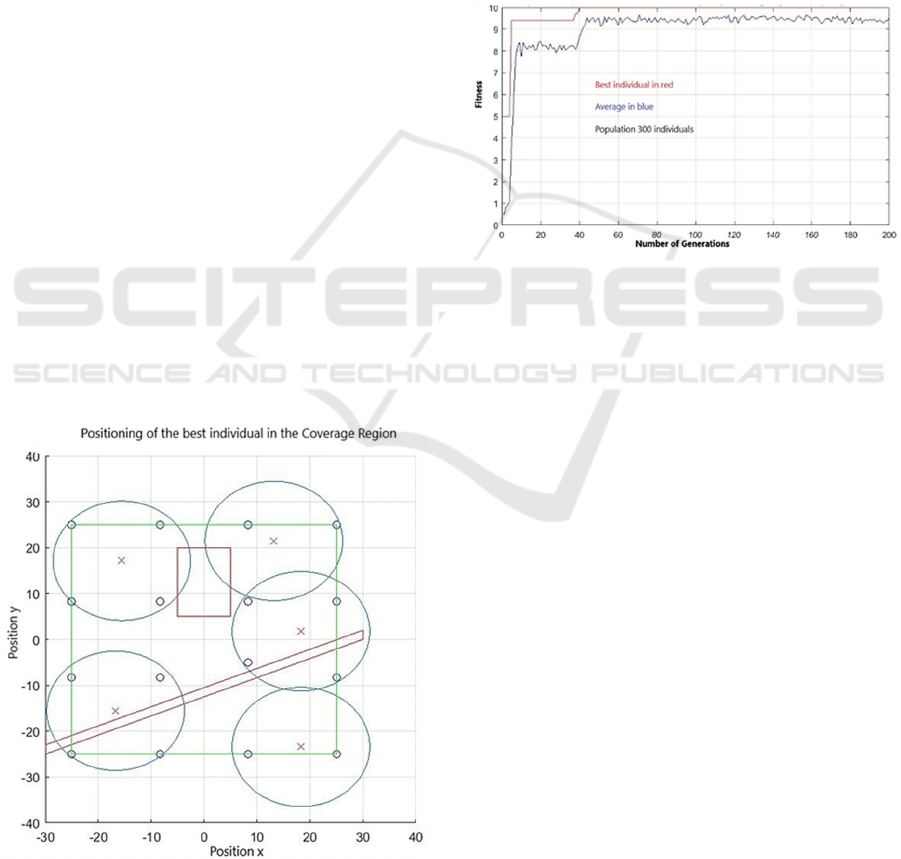
positioning. It can also be observed that it takes a few
more generations to reach the best individual, given a
greater difficulty in the scenario. Figure 13 shows the
final location of the routers including the area, the
location of monitoring points, and the regions with
restrictions on the installation of the routers, where a
stream and a shed restrict the placement of the
routers. Figure 14 shows the curve of the best
individual and the fitness average of the population.
Figure 13: Routers’ positioning for case study 3.
From the graphs it can be seen that the best individual
reached maximum fitness around the 40th generation
and the average followed this evolution.
In both case studies, the presented fuzzy
aggregator system simultaneously evaluates the two
objectives (maximize NCS - Number of Covered
Sensor monitoring devices and minimize Cost),
integrating designer’s preferences. It offers an
interesting advantage over multi-objective Pareto
optimization methods, since specifications are
entered in a simpler and more interpretable way
through fuzzy logic, and so the evolution is guided to
pre-established preferences.
Figure 14: Fitness curve for case study 3.
4 CONCLUSIONS
In this work, case studies were presented with
applications in mesh networks, whose objective is to
optimize the positioning of routers in a small rural
property to optimize the production of family
agriculture using sensors with automation for data
acquisition. In the scenario of the first case study,
with only one objective, a genetic algorithm
presented satisfactory solutions. In the other case
studies, a hybrid fuzzy-genetic evolutionary
technique was applied to a multi-objective system, in
which the cost objective was included in the routing
issue.
The fuzzy aggregator system makes it possible to
simultaneously evaluate all objectives, integrating
user preferences in relation to each objective and for
each situation. This proposed system offers a good
advantage over multi-objective Pareto optimization
methods, as it does not require user interference to
choose the best solution at the end of the process,
since preferences or specifications are entered before
evolution in a simpler and more interpretable way
through the use of fuzzy logic, so the evolution
Smart Placement of Routers in Agricultural Crop Areas
105

process is guided in the direction of pre-established
preferences.
For future work on precision agriculture, we plan
to run experiments with weighted-sum GA and Pareto
traditional methods for comparison’s sake. It is also
expected the inclusion of new targets for fuzzy
aggregation and possibly the design of a variable size
chromosome in the GA modeling so that evolution
can also determine the number of routers suitable for
field coverage. In addition, comparisons with other
algorithms such as Particle Swarm Optimization
(PSO)(Lin, 2013), Whale Optimization Algorithm
(WOA) (Mirjalili et al., 2016), Bat Algorithm
(BA)(Lin et al., 2014), African Vulture Optimization
Algorithm (AVOA) (Abdollahzadeh et al., 2021) etc.
are foreseen in future works.
ACKNOWLEDGEMENTS
This study was financed in part by the Coordenação
de Aperfeiçoamento de Pessoal de Nível Superior –
Brasil (CAPES) – Finance Code 001, and FAPERJ.
REFERENCES
Del Felipe, M.R., Vázquez, M.L. and Bermello, J.L.P.,
2022.Wireless sensor network applied to precision
agriculture: A technical case study at the technical
university of Manabí. in Communication, smart
technologies and innovation for society. Smart
innovation, systems and technologies, vol 252, Á.
Rocha, P.C. López-López, J.P. Salgado-Guerrero, Eds.
Singapore: Springer.
Dasig, D.D., 2020. Implementing IoT and wireless sensor
networks for precision agriculture, in Internet of things
and analytics for agriculture, vol 2. Studies in big data,
vol 67, P. Pattnaik, R. Kumar, and S. Pal, Eds.
Singapore: Springer.
Medici, M., Carli, G., Tagliaventi, M. R., and Canavari,
M., 2021. Evolutionary scenarios for agricultural
business models, in Bio-economy and agri-production,
D. Bochtis, C. Achillas, G. Banias, and Maria Lampridi,
Eds. Academic Press, 2021, pp. 43-63.
Sreeja, B.P. , Manoj Kumar, S. , Sherubha, P., Sasirekha,
S.P. , 2019. Crop monitoring using wireless sensor
networks, in Materials today, Proceedings.
Girgis, M. R. , Mahmoud, T. M., Abdullatif, A. B. , and
Rabie, A. M., 2014. Solving the wireless mesh network
design problem using genetic algorithm and simulated
annealing optimization method, International Journal
of Computer Applications, vol. 96, no. 11, pp. 1-10.
Rezaei, M., Sarram, M. A., Derhami, V., and Sarvestani, H.
M., 2011. Novel Placement Mesh Router Approach for
Wireless Mesh Network, Proceedings of the
International Conference on Wireless Networks.
Coelho, P. H. G., do Amaral, J. L. M., do Amaral, J. F. M.,
de Arruda Barreira, L F., and Barros, A. V., 2017.
Router nodes placement using artificial immune
systems for wireless sensor industrial networks, in
Lecture Notes in Business Information Processing, vol.
291, Springer International Publishing, pp. 155-172.
Coelho, P. H. G., do Amaral, J. L. M., do Amaral, J. F. M.,
de Arruda Barreira, L F., and Barros, A. V., 2015.
Applying artificial immune systems for deploying
router nodes in wireless networks in the presence of
obstacles, in Lecture Notes in Business Information
Processing, vol. 227, Springer International Publishing,
pp. 167-183.
Mekhmoukh Taleb, S. , Meraihi, Y. , Gabis, A. B., Mirjalili
S., Zaguia A., and Ramdane-Cherif, A. ,2022. Solving
the mesh router nodes placement in wireless mesh
networks using coyote optimization algorithm, in IEEE
Access, vol. 10, 2022, pp. 52744-52759.
Coelho, P., do Amaral, J. M., Guimarães, K., and Bentes,
M., 2019. Layout of routers in mesh networks with
evolutionary techniques, in Proceedings of the 21st
International Conference on Enterprise Information
Systems – vol. 1, pp. 438-445.
Lin, C.-C., 2013. Dynamic router node placement in
wireless mesh networks: A PSO approach with
constriction coefficient and its convergence analysis, in
Inf. Sci., vol. 232, pp. 294-308.
Mirjalili, S. and Lewis, A., 2016. The whale optimization
algorithm, Adv. Eng. Softw., vol. 95, pp. 51-67.
Lin C.-C., Li, Y.-S., and Deng, D.-J., 2014. A bat-inspired
algorithm for router node placement with weighted
clients in wireless mesh networks, in Proc. 9th Int.
Conf. Commun. Netw. China, pp. 139-143.
Abdollahzadeh, B., Gharehchopogh, F. S., and Mirjalili, S.,
2021. African vultures optimization algorithm: A new
nature-inspired Metaheuristic algorithm for global
optimization problems, Comput. Ind. Eng., vol. 158.
ICEIS 2023 - 25th International Conference on Enterprise Information Systems
106
