
Quizzes and Eggs: Exploring the Impact of Course Design Elements on
Students’ Engagement
Lisa Michael
a
and Irene-Angelica Chounta
b
Colaps Research Group, University of Duisburg-Essen, Duisburg, Germany
Keywords:
Online Learning, Course Design, Engagement, Exploratory Study, Logfile Analysis.
Abstract:
In this paper, we explored the impact of course design elements that aim to support and sustain students’
engagement during a 12-week online course. The course we analyzed targeted higher education, master-
level students of Computer Science and Educational Technologies, and took place fully online during the
COVID-19 pandemic. The course was facilitated by a Learning Management System (LMS), and due to the
circumstances, the instructor’s primary goal was to motivate students to actively participate during the course
duration. To that end, the instructor implemented a course design focused on integrating elements such as
interactive activities, short quizzes, hidden “easter eggs,” and real-time webinars. To study the impact of these
elements on students’ activity, we carried out an exploratory analysis of students’ activity as recorded by the
log files of the LMS and the qualitative feedback that students provided to the instructor. Our results suggest
that the course design supported sustaining students’ engagement. The level of students’ activity varied for
the learning materials and resources, but we confirmed a high usage of the quizzes over the course duration.
1 INTRODUCTION
Over the past semesters, we witnessed the attempts
of many higher education institutions to change their
classes from fully face-to-face to completely remote
(Bozkurt and Sharma, 2020) due to the COVID-19
pandemic. This switch to Emergency Remote Teach-
ing (ERT) had the primary goal of maintaining in-
struction quickly and reliably instead of replicating a
robust educational ecosystem (Hodges et al., 2020).
During ERT, students showed negative reactions to
the pandemic-related online learning (Besser et al.,
2022), and related research suggested that COVID-
19 had a negative impact on the mental health of col-
lege students (Copeland et al., 2021). In this work,
we present a case study where the instructor of a 12-
week-long, fully-online higher education course pre-
pared a course design with the aim of scaffolding stu-
dents’ motivation and sustaining student engagement.
For our research, we studied how students engaged
with digital learning materials (or else, “resources”)
over the course’s duration. Additionally, we explored
how the students interacted with game-like and fun
elements, in this case, a treasure hunt (where students
a
https://orcid.org/0000-0003-0197-7473
b
https://orcid.org/0000-0001-9159-0664
were asked to find hidden “easter eggs”, such as mu-
sic videos or mini web-based games) and voluntary
short quizzes in the form of fun trivia, that the instruc-
tor implemented to support students’ motivation and
self-reflection.
In this context, we formulated three research ques-
tions:
• RQ1: Are there differences in the usage of the dif-
ferent resources (for example, videos vs. reading
material), or are resources used in similar ways?
• RQ2: Is there a difference in students’ activity
over time (for example, do they lose interest or is
student engagement sustained)?
• RQ3: Is there a relationship between quiz and
treasure hunt activity, and how did students per-
ceive these design elements?
The remainder of this document is structured as
follows: In section 2, we present research related to
online learning in higher education and student en-
gagement. In section 3, we discuss the methodolog-
ical setup, and in section 4, we present the results of
our analysis. Finally, we conclude with a contextu-
alized discussion about the theoretical and practical
implications of this work, reflections, limitations, and
future work.
Michael, L. and Chounta, I.
Quizzes and Eggs: Exploring the Impact of Course Design Elements on Students’ Engagement.
DOI: 10.5220/0011745000003470
In Proceedings of the 15th International Conference on Computer Supported Education (CSEDU 2023) - Volume 1, pages 25-34
ISBN: 978-989-758-641-5; ISSN: 2184-5026
Copyright
c
2023 by SCITEPRESS – Science and Technology Publications, Lda. Under CC license (CC BY-NC-ND 4.0)
25

2 RELATED WORK
2.1 Online Learning in Higher
Education
The past two years (2020-2022) were marked by an
increase of studies and research works that tackle
topics on course design, facilitation, effectiveness,
and efficiency of online learning arguably due to
the COVID-19 pandemic and the emergency transi-
tion to remote teaching (Bozkurt and Sharma, 2020).
Nonetheless, online learning – especially in higher
education – has been relatively mainstream for – at
least – the past 20 years with academic leading in-
stitutions offering online learning courses in multiple
forms (Kentnor, 2015). Typical forms of online learn-
ing facilitation include Learning Management Sys-
tems (LMSs), Intelligent Tutoring Systems (ITSs),
Virtual Learning Environments (VLEs), Online Labs,
and Massive Open Online Courses (MOOCs).
The benefits of online learning are rather obvious:
providing access to quality materials and instruction
without the restrictions of physical presence and sup-
porting students to follow courses and learn at their
own pace. Additionally, online learning environments
like LMSs allow instructors to offer diverse course
designs with various types of learning materials and
learning resources, such as reading materials, videos,
and worked examples (Ziebarth et al., 2015); support-
ing students to engage with learning activities at their
own pace, thus maintaining a high degree of control,
and providing the framework and tools for highly-
structured learning management that minimize over-
head (Fadde and Vu, 2014).
At the same time, the lack of physical pres-
ence and in-person communication challenge struc-
tural and social aspects of learning: students experi-
ence feelings of isolation or boredom, lack of motiva-
tion, and attrition which potentially may lead to dis-
engagement and even dropouts (Hussain et al., 2018).
To minimize the negative impact that the lack of phys-
ical interaction may have on students’ learning, re-
lated research explores how students engage in mean-
ingful activities and in what ways students’ engage-
ment can support their performance. The core ratio-
nale is that a student who engages with learning ma-
terials and actively participates in learning activities
will perform better in terms of learning gains (Kuh,
2003).
2.2 Student Engagement in Online
Learning
According to (Kuh, 2003), student engagement is
“the time and energy students devote to education-
ally sound activities inside and outside of the class-
room, and the policies and practices that institutions
use to induce students to take part in these activities.”
(p. 25). In other words, student engagement describes
how and to what extent students get involved with
learning resources (activities and materials) within an
educational context. At the same time, (Bond et al.,
2020) discussed the struggle of finding a common
definition and terminology, which leads to inconsis-
tencies across the field. This struggle pinpoints that
student engagement is a complex construct. (Chiu,
2022) discussed the multidimensional nature of stu-
dent engagement that can be broken down into be-
havioral (students’ involvement in learning activities),
cognitive (students’ mental effort while carrying out
learning tasks), emotional (students’ affective state),
and agentic engagement (students’ initiative and con-
tribution). Similarly, (Groccia, 2018) elaborated on
the multidimensional perspective of student engage-
ment and the diversity of the meaning of student en-
gagement, pointing out that this is precisely why stu-
dent engagement can have a positive impact on learn-
ing. On the one hand, students who engage in produc-
tive learning activities expand their skillset for per-
sonal development (Kuh, 2003). On the other hand,
students’ lack of engagement can affect students’ per-
formance and retention (Staikopoulos et al., 2015).
Sustaining student engagement in online learning
for higher education is a challenging task, especially
due to the lack of the traditional communication chan-
nels that characterize in-person learning. To sustain
or to scaffold engagement instructors typically – and
among others – design activities that involve the use
of technologies (or else, tools) that support knowl-
edge or artifact construction, organization and sharing
(de Jong et al., 2021; Manske et al., 2015) and that
are non-disruptive (for example, related research sug-
gests that tools such as blogs, portfolios or social net-
working tools can be more disengaging than engag-
ing (Bond et al., 2020)), learning materials of diverse
types and for various purposes (Ziebarth et al., 2015),
integrate gaming, gamification, and fun elements into
the course design in order to enrich students’ learning
experience (Ab. Rahman et al., 2018). Nonetheless –
despite the rigorous research around online learning
and student engagement – during the emergency tran-
sition to remote teaching due to the COVID-19 pan-
demic, we still witnessed disruptions and challenges
that had to be addressed, for both students and instruc-
CSEDU 2023 - 15th International Conference on Computer Supported Education
26

tors. For example, instructors without experience in
online learning struggled to adapt to remote teaching.
Students, on the other hand, reported high levels of
stress and anxiety while others struggled to sustain
motivation and maintain engagement on similar lev-
els as in the in-person condition.
3 METHODOLOGY
3.1 Setup
Here, we present an exploratory analysis of the logfile
data from a master-level course on Learning Analytics
(LA) for students of Computer Science and students
of Educational Technologies in a Higher Education
Institution (HEI). The course was taught in the En-
glish language and there was no difference in terms
of instruction for students of different curricula. In
general, the student population was diverse in terms
of knowledge and cultural background. The course
took place fully online during COVID-19 and was fa-
cilitated by an LMS (Moodle). To maintain personal
contact with the students, the instructor offered four
webinars (one webinar per month) and also virtual
office hours (weekly). During office hours, students
were invited to drop in without notice and discuss the
course topics that interested them. Furthermore, the
course included video lectures and other digital learn-
ing materials, such as guest video talks, reading re-
sources (textbook chapters and articles), and coding
resources (for example, coding notebooks) (Table 1).
The course lasted for 12 weeks, from September 2020
until December 2020. Not all course weeks had the
same amount of days (see Table 1 caption). From
now, week 1, week 2 and so on, refer to the course
weeks as presented in Table 1.
Each week, the instructor suggested the order in
which the participants should engage with the ma-
terials. To support students’ self-assessment, the in-
structor created short quizzes and prompted students
to create knowledge resources, such as wiki articles or
forum discussions. Additionally, the forum was used
to motivate students to communicate questions and
reflections. To sustain student engagement over the
course duration, the instructor incorporated a ”trea-
sure hunt” into the course plan. Students were in-
formed at the very beginning of the course about the
treasure hunt and the possibility of finding hidden ob-
jects (so-called ”easter eggs” which we will refer to
as eggs below) within the learning materials. Never-
theless, students didn’t know in which course weeks
the eggs were hidden nor what they looked like (such
as, videos, mini web-based games). The instructor
awarded bonus points for participation in the quizzes
(a student could take a particular quiz only once), and
the treasure hunt. To give an example, one easter
egg was hidden in the presentation slides in the form
of a URL that directed the students to a YouTube
playlist. Students were asked to leave a comment
in the comments section of the playlist to earn the
bonus point for the easter egg. At the end of the
course, the instructor visited the comments section
and awarded bonus points to the students who left
comments. Within the course, students had to com-
plete and submit four graded assignments, where the
fourth was a ”revise-and-resubmit” of one of the three
previous assignments, aiming to improve students’
grades. The final exam was prepared as a quiz and
was administered on the last day of the course. The
final grade for the course was calculated in equal parts
from the final exam – formulated as a quiz – and the
average grade of the assignments. The bonus points
from the quizzes and the easter egg were awarded on
top of the final score. In total, 25 students took part
in the course and agreed to also participate in this re-
search by providing informed written consent. Stu-
dent population was balanced in terms of gender.
3.2 Method
To answer our research questions, we analyzed data
from two sources: log data of the LMS and qualita-
tive feedback from the students. We pre-processed
and tidied the data according to (Wickham, 2014) and
analyzed the data from two perspectives: a) materi-
als’ weekly usage, that is, how many times resources
were accessed every week; and b) individual student’s
behavior regarding materials’ usage, that is how of-
ten individual students engaged with the resources.
We started the exploratory analysis by studying the
data on the student level regarding the usage of dig-
ital learning material in general, and the usage di-
vided by the various types of resources. Here, us-
age is defined by the number of accesses (that is, how
many times a particular resource was accessed). To
determine potential patterns for different resources,
we grouped the resources into 8 main categories: as-
signments, quizzes, reading material, video lectures,
video talks, live webinars, Q&A forums, and coding
resources. The decision was led by the instructor of
the course and was based on the content of the dif-
ferent resources (Table 1). The exam was excluded,
as we wanted to concentrate on the usage of the re-
sources during the course. Next, we analyzed re-
source usage throughout the course duration. Here we
focused on the differences in usage patterns in the dif-
ferent weeks of the course. Finally, we took the quali-
Quizzes and Eggs: Exploring the Impact of Course Design Elements on Students’ Engagement
27

Table 1: Overview of the course structure and the course weeks (marked in bold). Week 1 to week 9 each lasted 7 days. Week
10 lasted 14 days, and week 11 lasted 5 days. Week 12 lasted 2 days (exam week). Below we present the weeks, the weekly
topic, whether this week’s materials contained a Quiz (“Q”) or an Easter Egg (“E”), and the resources that were provided
week by week. The resources’ abbreviations are: Lecture Video (LV), Reading Material (RM), Video Talk (VT), Consent
Form (CF), Webinar Video (WV), Webinar Link (WB), Slides for the Webinar (SL), Weblinks (URL), Assignment (AS),
Video Instruction (VI), Assignment of Research Articles (LST), Coding Notebook (NB), Download of the Coding Notebook
(DN), Question & Answer Forum (QA). The resources were grouped into the following main categories: 1 = Quizzes, 2 =
Videos Lectures, 3 = Reading Material, 4 = Video Talks, 5 = Live Webinars, 6 = Assignments, 7 = Coding Resources, 8 =
Q&A Forums.
Week 1 Week 2 Week 3 Week 4
What is Learning
Analytics?
Learning in Context Data: How do they look
like?
Extended focus on Data
E, Q
1
E, Q
1
E E
LV
2
, RM
3
, VT
4
, CF WV
2
, RM1
3
, RM2
3
,
WB
5
, SL
3
LV
2
, RM1
3
, RM2
3
,
URL, AS
6
VT
4
, VI
7
, URL
7
, URL
7
,
URL, URL
Week 5 Week 6 Week 7 Week 8
Data (part 2): The Data
Whisperer
Analytical Methods Applied Learning
Analytics (part 1)
Applied Learning
Analytics (part 2)
E E, Q
1
Q
1
E, Q
1
WV
2
, RM1
3
, RM2
3
,
RM3
3
, AS
6
, WB
5
, SL
3
VT1
4
, VT2
4
, LST
3
NB
7
, DN
7
, QA
8
, VL
2
NB
7
, DN
7
, RM
3
, QA
8
,
VL
2
Week 9 Week 10 Week 11 Week 12
Applied Learning Ana-
lytics (part 3)
FATE and Learning
Analytics
Revision Exam
E, Q
1
Q
1
n/a n/a
NB
7
, RM
3
, WV
2
RM1
3
, RM2
3
, VT
4
, AS
6
WB
5
, QA
8
, AS
6
exam
tative feedback of the course participants into consid-
eration to assess the effectiveness of the course design
elements.
4 RESULTS
4.1 Students’ Engagement with
Learning Resources of Different
Types
The first step of the analysis examined the usage of
the resources, per student and per resource type (that
is, reading material, videos, and so on). To measure
the resource usage we calculated the times a resource
was accessed. Here, we did not consider the dura-
tion of engagement with resources for two reasons:
a) the LMS provides limited information about time
on task. For example, the system logs when a re-
source is accessed but not for how long. Although one
could calculate the engagement duration as the dif-
ference between the timestamp the student accessed
the resource and the timestamp of the student’s next
action, this could be highly inaccurate (for example,
a student who leaves the browser open and calls a
friend on the phone); b) the LMS allows download-
ing resources, which consequently means that a stu-
dent may choose to download a pdf file and engage
with it ”offline.” The resource usage per student (Fig-
ure 1) ranges from 18 accesses (student 184) - that is,
student 184 accessed resources in general 18 times
throughout the course - to 593 (student 175) (M =
274.76 SD = 142.51). As the high standard devia-
tion suggests, we could not see a clear pattern for the
students’ individual engagement except for the two
students 133 and 184 who showed less engagement
compared to their peers.
Consequently, we explored whether the usage of
resources varied based on their type, for example,
whether students used video resources more than
reading resources. We saw high usage rates (that
is, a high number of accesses) for the assignments
(2668 accesses in total), closely followed by quizzes
(2518 accesses in total). The reading material (657
accesses in total), coding resources (347 accesses in
total), and video lectures (344 accesses in total) fol-
lowed. Furthermore, we saw even lower usage rates
for the guest video talks (161 accesses in total), Q&A
forums (128 accesses in total), and live webinars (46
accesses in total). It is important to point out that the
resource usage did not reflect the resource distribu-
tion over the lecture’s duration (Table 1). For exam-
ple, assignments were accessed more than video re-
CSEDU 2023 - 15th International Conference on Computer Supported Education
28

sources. However, over the duration of the course,
there were more video resources than assignments
available. Based on the high usage of the assignments
and quizzes, we looked in detail at the usage patterns
of these resources by the individual students (Table
2). We observed that students who demonstrated low
usage rates usually showed a higher usage of the as-
signments than of the quizzes. Depending on whether
usage rates were below or above the mean M=274.76
(SD = 142.51), we assigned the students to two differ-
ent groups. Out of 25 participants, 13 students who
belong to group II in Table 2 showed total usage rates
below the mean. Of these 13 students from group II,
10 students showed a higher usage of the assignments
rather than the quizzes. We assumed that students,
who used the resources less, prioritized their work in
a different manner. They might have set their prior-
ities according to the things that needed to be done
first before proceeding to the things that could be done
later. The submission of the assignments was manda-
tory to pass the course, whereas the quizzes were an
optional and additional offer. It was possible to earn
bonus points, but there was no obligation to take the
quizzes. In contrast to this observation, two-thirds of
the students in group 1 - who showed generally higher
usage rates than the mean usage - also showed higher
usage rates for the quizzes. The frequent usage of the
quizzes could be an indication that the quizzes were
popular and kept engagement high.
4.2 Students’ Engagement over Time
Next, we wanted to gain insight into resources’ us-
age over time. Figure 2 illustrates the total resource
usage per week during the course duration. Overall,
we saw that resource usage increased from week 1 to
week 2. In both weeks, a quiz and an egg were pro-
vided. In week 3, a week with an assignment and an
egg, the resource usage dropped. A possible expla-
nation could be the provision of the assignment, as
students had two weeks to complete it. From week 4
to week 7, the resource usage started increasing again
and dropped in week 8. The lowest point of resource
usage was shown in week 9. This was three weeks be-
fore the exam took place, students might have needed
a break. In week 10, which consisted of 14 days, the
usage rose steeply to the peak and dropped slightly in
week 11. In the week of the exam (week 12) the re-
source usage was still quite high. It is worth mention-
ing that week 12 only consisted of two days, it started
on Monday and the exam took place on Wednesday.
Additionally, we inspected the engagement pat-
terns of the individual students during the course
weeks (Figure 3). Comparing the resource usage of
the individual students in Figure 3 with the accumu-
lated resource usage in Figure 2, we could not find
the exact same pattern. Some students (e.g. students
160, 175, and 178) showed continuous resource us-
age with comparatively high resource usage around
week 6 and week 7 and around the end of the course.
Looking back at Table 2, most of the students who
showed a higher total resource usage than the mean,
also showed continuous resource usage in Figure 3. A
few students (such as students 161 and 163) showed
higher resource utilization at the end of the course
than continuously throughout the course. Addition-
ally, the differences in resource usage by students 133
and 184 as depicted in Figure 3 compared to the rest
of the students is striking. They engaged to a mini-
mum extent with the resources during the course. In-
deed these students dropped out.
4.3 Students’ Engagement with Quizzes
and Eggs
Finally, we looked in detail at how students interacted
with the quizzes and eggs (that is, how many students
took each quiz and how many students found an egg).
Our findings (Table 3) suggested that the participa-
tion was high for the first three quizzes in week 1 (17
students), week 2 (18 students), and week 6 (16 stu-
dents). About half of the students who attended the
course took the fourth quiz in week 7 whereas a little
more than one-third of the students participated in the
quizzes in weeks 8 and 9. For the last quiz in week
10, only 7 students out of 25 participated.
We discovered a similar pattern for students’ ac-
tivity in the treasure hunt. Students found more eggs
in the first three weeks than in the following weeks
(Table 4). The first egg was found by 15 students, the
second by 18 students, and the third by 20 students. In
week 4, 7 students detected the eggs, whereas the eggs
in weeks 5 and 6 were found by a few more students
(9 and 10 students). Only 2 students detected the egg
in week 8 whereas the egg in week 9 was found by 9
students.
With regard to the identified eggs, we need to take
into consideration that the numbers don’t reflect how
much time and effort students spent searching for the
eggs. For example, one may argue that some eggs
(such as the egg in week 3) were easier to find than
other eggs (such as in week 8).
Additionally, we explored whether there was a
correlation between the points students collected by
finding the eggs and the points students collected
by participating in the short quizzes. The corre-
lation analysis suggested that the points students’
scored from collecting eggs correlate statistically sig-
Quizzes and Eggs: Exploring the Impact of Course Design Elements on Students’ Engagement
29

Figure 1: Resource usage per student for the course’s duration. The resources are grouped into the categories Assignments,
Coding Resources, Live Webinars, Q&A, Quizzes, Reading Material, Video Lectures and Video Talks.
Table 2: Overview of the Student IDs, the Total Resource Usage, the usage of Assignments and the Usage of Quizzes for
the individual students. Based on the mean usage (M=274.76, SD=142.51), the students were assigned to group I - usage
rates higher than the mean - and group II (usage rates below the mean).In the columns Usage of Assignments and Usage of
Quizzes, the higher value of both is shown in bold.
Student ID Total Resource Usage Usage of Assignments Usage of Quizzes Group
175 593 142 216
160 517 191 232
178 466 190 154
171 450 128 225
174 414 129 166
185 358 170 135 group I
181 345 108 131
179 335 161 90
176 317 177 89
143 314 101 152
182 302 112 121
120 284 92 123
172 262 104 100
165 252 110 89
163 245 93 103
177 223 93 60
115 214 82 77
168 174 80 34
170 174 61 69 group II
173 164 81 40
169 153 80 36
161 138 76 41
167 124 89 19
133 33 18 9
184 18 0 7
CSEDU 2023 - 15th International Conference on Computer Supported Education
30
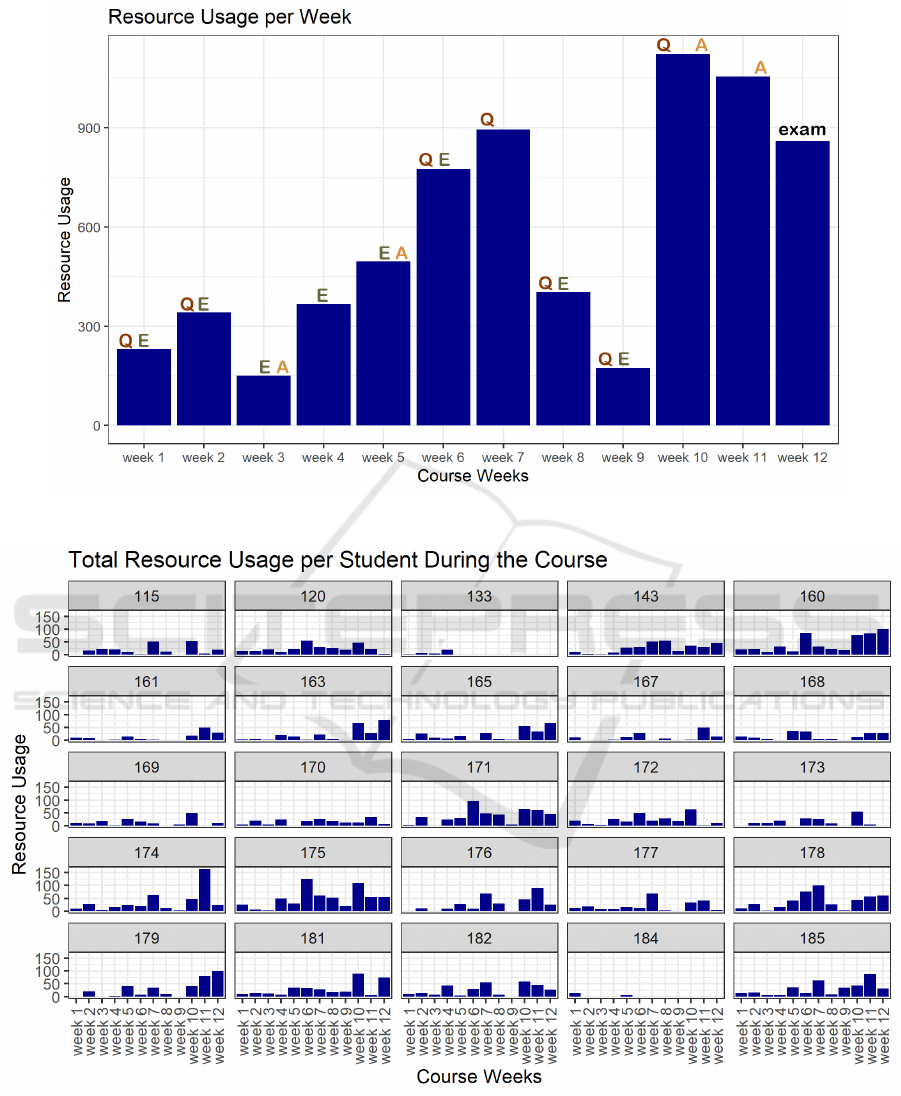
Figure 2: Resource Usage of all students during the Course Weeks. For each week which contained a Quiz (Q), an Egg (E),
an Assignment (A), or a combination of these resources, this is shown by the letters Q, E and A above the bars.
Figure 3: Students’ individual Resource Usage during the course.
nificantly and positively with the number of total in-
teractions they performed in Moodle (ρ = 0.41, p =
0.04 < 0.05). Similarly, the points students’ scored
from engaging with the course quizzes correlate sta-
tistically significantly and positively to a moderate
extent with the number of total interactions the stu-
dents performed in Moodle (ρ = 0.54, p = 0.006 <
0.01). These findings suggest that indeed the stu-
dents who were involved with the introduced course
design elements - that is, the eggs and the quizzes -
Quizzes and Eggs: Exploring the Impact of Course Design Elements on Students’ Engagement
31

Table 3: Overview of the Course Weeks and number of quizzes that were completed during the course. The first row shows
the Course Week of the quiz. The second row shows the number of students who completed the quiz.
Week 1 Week 2 Week 6 Week 7 Week 8 Week 9 Week 10
17 18 16 12 9 9 7
Table 4: Overview of the Course Weeks and number of eggs that were found during the course. The first row shows the
Course Week in which the egg was provided. The second row shows the number of students who found the egg.
Week 1 Week 2 Week 3 Week 4 Week 5 Week 6 Week 8 Week 9
15 18 20 7 9 10 2 9
also performed more actions on the platform. Fur-
thermore, the correlation analysis indicated a strong,
positive, and statistically significant correlation be-
tween the points students’ scored by collecting eggs
and the points scored by engaging with course quizzes
(ρ = 0.85, p = 9.1e
−08
< 0.001). This suggests that
the students who actively engaged in the treasure hunt
and located eggs are the same students who also en-
gaged with the course quizzes.
4.4 Students’ Feedback for the
Instructor
In addition to the log files, the instructor gathered
qualitative feedback from the students after the end
of the course. Students were asked to submit their
feedback by completing the form ”I like ..., I wish ...,
I wonder ...” - a popular method to gather feedback
in workshops or retrospectives. In total, 14 students
submitted their feedback. Of these, five people (st.01,
st.02, st.03, st.04, st.05) mentioned the eggs explicitly
and in a positive way below the ”I like” section. Two
of them additionally mentioned the quizzes (st.04,
st.05). In addition, one other student (st.06) men-
tioned the quiz below the ”I wish” feedback form. In
the following, we have listed some exemplary state-
ments:
• ”Easter Eggs (element of fun was brilliantly in-
troduced into the learning).” (st.01)
• ”Easter eggs and all other off-topic activities
which I wish were present in all other courses.”
(st.02)
• ”The easter eggs were a lot of fun, we all need
that in our lives.” (st.03)
• ”Egg-hunting made me back to child-heart as
well. Quiz were useful to refresh memory.” (st.04)
• ”Overall I really liked the structure of the course
especially the weekly quizzes that helped me to
keep up with the course and assess my learning.
[...] P.S. - I also enjoyed looking for the Easter
eggs!” (st.05)
• ”feedback was provided sooner...in some in-
stances/quizzes I didn’t know if I was on the right
track or completely off base.” (st.06)
In addition to the eggs and quizzes, all students - ex-
cept for one - either explicitly mentioned further re-
sources or the structure or atmosphere of the course in
the “I like” section. The other student directly com-
mented on the instructor (I like “Your enthusiasm and
passion for your subject”). Looking into the “I wish”
and “I wonder” categories, we noticed that three stu-
dents wished to receive more credits for the effort they
put into the course, and three students wished for an-
other similar course or a continuation of the course. It
is worth mentioning that the feedback was requested
after the students had gotten their grades. Further-
more, the feedback was not enforced but was a volun-
tary option.
5 CONCLUSION
Our results about resource usage showed that the ”as-
signment” was the most used resource, followed by
the resource ”quizzes.” All other resources were used
much less. When interpreting the resource usage,
we have to remember that some resources could have
been downloaded (e.g. reading material) or saved lo-
cally (e.g. URLs) and accessed without having any
action log data saved by the Moodle database. Fur-
thermore, it is important to note that the work on
and the submission of the assignments was a com-
pulsory task to complete the course. Opposite to this,
the quizzes were an additional offer to support self-
assessment and reflection. On the one hand, students
could collect bonus points for each quiz. On the
other hand, they did not have to expect any disad-
vantages when they didn’t complete one or multiple
quizzes. The high usage of the quizzes could mean
that the initial idea of the instructor to motivate the
students to engage with the learning material might
have worked for this specific resource. Considering
individual resource usage, we saw that two-thirds of
group I, according to Table 2, showed a higher us-
CSEDU 2023 - 15th International Conference on Computer Supported Education
32

age of the quizzes. In contrast, the other third showed
a higher usage of the assignments. The students in
group II (Table 2) showed lower usage rates on av-
erage than students in group I, and they used the as-
signment more than the quizzes. Our hypothesis was
that people who used little of the learning material
might have spent less time on the course and prior-
itized the tasks that needed to be done before they
interacted with optional resources. The other way
around, the students who used the learning materi-
als substantially, also showed higher usage rates for
the quizzes than for the assignments. With regards
to RQ 1, we established that there were differences
in the usage of different resources. Assignments and
quizzes were used considerably more frequently than
the other resources.
Concerning RQ 2, we could see differences in stu-
dent activity over time (Figure 2). We saw three no-
ticeable drops in the third week and in weeks 8 and 9.
Simultaneously, we observed high resource usage for
four weeks in the middle of the course and for three
weeks at the end of the course. We can’t provide a
clear answer to the question whether students lost in-
terest in the weeks with the decline of resource usage.
Apart from these two declines, we could see continu-
ous resource usage. This consequently could serve as
an indication that engagement was sustained over the
course.
In response to RQ3, we could show a relationship
between quiz and egg activity. Firstly, we saw a cor-
relation between the points students’ obtained when
identifying eggs and the total resource usage. Sec-
ondly, we observed a correlation between the points
students’ scored in the course quizzes and resource
usage. Thirdly, we found a strong correlation be-
tween the points students’ got by finding eggs and
the points they got by completing course quizzes.
These positive and statistically significant results sug-
gest that students who were involved with the eggs
and the quizzes also showed higher resource usage
in the course. The third correlation result suggests
that the students who actively engaged in the treasure
hunt and located eggs are the same students who also
engaged with the course quizzes. With regard to the
perception of the design elements, the instructor re-
ceived positive qualitative feedback. Many students
commented on the course design and the content of
the course. Additionally, students appreciated the fun
design elements (treasure hunt and quizzes).
We envision that our work contributes towards
sustainable student engagement in online learning for
higher education. Firstly, we established that stu-
dents interacted with the quizzes although they were
not mandatory learning resources. The students who
completed the quizzes are the same students who ac-
tively engaged in the treasure hunt. This could sug-
gest that the implementation of a treasure hunt and
the provisioning of quizzes is a good combination for
an active course design. This assumption is comple-
mented by the students’ positive feedback. Looking
at the chronological resource usage over the 12 weeks
we did not see a dominating pattern. One may argue
students started with high intrinsic motivation at the
beginning of the course. After the first two weeks,
the intrinsic motivation might have dropped and been
replaced by an extrinsic motivation to submit the as-
signments. This could explain why the weeks with
the assignments showed higher usage rates at the end
of the course.
However, we need to remember that we looked at
raw action log data and did not know the context of
each student and the circumstances in their personal
life - especially during a worldwide pandemic. When
interpreting our findings we need to consider this as a
first notable limitation. Additionally, we should bear
in mind that our course was a master-level course on
Learning Analytics, studied by students majoring in
Computer Science or Educational Technology. The
background of our student group might impact their
engagement and behavior throughout the course. It
could be interesting to replicate the course setup with
a different student population. The fact that we could
not include factors outside of our course setup and
the LMS environment also leads to another limitation.
We could not determine whether certain resources
were used outside of the platform, e.g. reading ma-
terial was downloaded, links were saved locally and
accessed outside of the Moodle course or students
searched for further resources online or offline. Ad-
ditionally, the application of gamification elements
can be discussed as well. The use of game design
elements has been explored in educational contexts
with studies suggesting beneficial effects on learn-
ing performance (de Marcos et al., 2016) or engage-
ment (Denny, 2013). Here, we did not use surveys
or other measures for the (self-)assessment of vari-
ables such as motivation or satisfaction and followed
an exploratory study design but one could consider
for future work to study in particular the impact of
fun, game-like elements (such as ”easter eggs”) on
the classroom’s environment. For future research, it
would be beneficial to get more contextual informa-
tion and insights into the students’ personal circum-
stances. For instance, one could follow up with qual-
itative interviews or integrate further questionnaires
which could survey motivation and personal well-
being.
Quizzes and Eggs: Exploring the Impact of Course Design Elements on Students’ Engagement
33

REFERENCES
Ab. Rahman, R., Ahmad, S., and Hashim, U. R. (2018). The
effectiveness of gamification technique for higher ed-
ucation students engagement in polytechnic muadzam
shah pahang, malaysia. International Journal of Ed-
ucational Technology in Higher Education, 15(41):1–
16.
Besser, A., Flett, G. L., and Zeigler-Hill, V. (2022). Adapt-
ability to a sudden transition to online learning during
the covid-19 pandemic: Understanding the challenges
for students. Scholarship of Teaching and Learning in
Psychology, 8(2):85–105.
Bond, M., Buntins, K., Bedenlier, S., Zawacki-Richter,
O., and M. Kerres, M. (2020). Mapping research
in student engagement and educational technology in
higher education: a systematic evidence map. Inter-
national Journal of Educational Technology in Higher
Education, 17(2):1–30.
Bozkurt, A. and Sharma, R. C. (2020). Emergency re-
mote teaching in a time of global crisis due to coro-
navirus pandemic. Asian Journal of Distance Educa-
tion, 15(1):i–iv.
Chiu, T. K. F. (2022). Applying the self-determination
theory (sdt) to explain student engagement in online
learning during the covid-19 pandemic. Journal of
Research on Technology in Education, 54(sup1):S14–
S30.
Copeland, W. E., McGinnis, E., Bai, Y., Adams, Z., Nar-
done, H., Devadanam, V., Rettew, J., and Hudziak,
J. J. (2021). Impact of covid-19 pandemic on col-
lege student mental health and wellness. Journal of
the American Academy of Child & Adolescent Psychi-
atry, 60(1):134–141.e2.
de Jong, T., Gillet, D., Rodr
´
ıguez-Triana, M. J., Ho-
vardas, T., Dikke, D., Doran, R., Dziabenki, O.,
Koslowsky, J., Korventausta, M., Law, E., Pedaste,
M., Tasiopoulou, E., Vidal, G., and Zacharia, Z.
(2021). Understanding teacher design practices for
digital inquiry–based science learning: the case of go-
lab. Educational Technology Research and Develop-
ment, 69(2):417–444.
de Marcos, L., Garcia-Lopez, E., and Garcia-Cabot, A.
(2016). On the effectiveness of game-like and social
approaches in learning: Comparing educational gam-
ing, gamification & social networking. Computers &
Education, 95:99–113.
Denny, P. (2013). The effect of virtual achievements on
student engagement. In Proceedings of the SIGCHI
Conference on Human Factors in Computing Systems,
page 763–772.
Fadde, P. J. and Vu, P. (2014). Blended online learning:
Misconceptions, benefits, and challenges. pages 33–
48.
Groccia, J. E. (2018). What is student engagement? New
Directions for Teaching and Learning, 2018(154):11–
20.
Hodges, C., Moore, S., Lockee, B., Trust, T., and Bond,
A. (2020). The difference between emergency remote
teaching and online learning. educause review.
Hussain, M., Zhu, W., Zhang, W., and Abidi, S. M. R.
(2018). Student engagement predictions in an e-
learning system and their impact on student course
assessment scores. Computational Intelligence and
Neuroscience, 2018:1–21.
Kentnor, H. (2015). Distance education and the evolution
of online learning in the united states. Curriculum and
Teaching Dialogue, 17(1&2):21–34.
Kuh, G. D. (2003). What we’re learning about student en-
gagement from nsse: Benchmarks for effective edu-
cational practices. Change: The Magazine of Higher
Learning, 35(2):24–32.
Manske, S., Chounta, I.-A., Rodr
´
ıguez-Triana, M. J., Gillet,
D., and Hoppe, H. U. (2015). Exploring deviation
in inquiry learning: Degrees of freedom or source of
problems? In Proceedings of the 23rd International
Conference on Computers in Education. Asia-Pacific
Society for Computers in Education.
Staikopoulos, A., OKeeffe, I., Yousuf, B., Conlan, O.,
Walsh, E., and Wade, V. (2015). Enhancing stu-
dent engagement through personalized motivations.
In 2015 IEEE 15th International Conference on Ad-
vanced Learning Technologies, pages 340–344. IEEE.
Wickham, H. (2014). Tidy data. Journal of Statistical Soft-
ware, 59(10):1–23.
Ziebarth, S., Chounta, I.-A., and Hoppe, H. U. (2015). Re-
source access patterns in exam preparation activities.
In Design for Teaching and Learning in a Networked
World. EC-TEL 2015. Lecture Notes in Computer Sci-
ence, pages 497–502. Springer International Publish-
ing.
CSEDU 2023 - 15th International Conference on Computer Supported Education
34
