
Algorithmic Fairness Applied to the Multi-Label Classification Problem
Ana Paula S. Dantas
a
, Gabriel Bianchin de Oliveira
b
, Daiane Mendes de Oliveira
c
,
Helio Pedrini
d
, Cid C. de Souza
e
and Zanoni Dias
f
Institute of Computing, State University of Campinas, Av. Albert Einstein, Campinas, Brazil
Keywords:
Fairer Coverage, Algorithmic Fairness, Multi-Label Multi-Class Classification.
Abstract:
In recent years, a concern for algorithmic fairness has been increasing. Given that decision making algorithms
are intrinsically embedded in our lives, their biases become more harmful. To prevent a model from displaying
bias, we consider the coverage of the training to be an important factor. We define a problem called Fairer
Coverage (FC) that aims to select the fairest training subset. We present a mathematical formulation for this
problem and a protocol to translate a dataset into an instance of FC. We also present a case study by applying
our method to the Single Cell Classification Problem. Experiments showed that our method improves the
overall quality of the qualification while also increasing the quality of the classification for smaller individual
underrepresented classes in the dataset.
1 INTRODUCTION
The use of algorithms for decision making is only in-
creasing. They are used in a wide range of fields,
such as the selection of university students (Waters
and Miikkulainen, 2014) and allocation of resources
during natural disasters (Wang et al., 2022). Decision
algorithms are even used on the justice system to aide
on trials, parole concession, and sentencing (Christin
et al., 2015). Although the usage of algorithms aims
to improve process by either making it faster or find-
ing a better solution, they are not exempt from societal
flaws like discrimination.
It has become apparent through several studies
that algorithms also have the potential to be dis-
criminatory. O’Neil (O’Neil, 2017) presented in her
“Weapons of Math Destruction” book several exam-
ples of how algorithms are being used in the deci-
sion making process and, more importantly, how they
affect society. The more concerning of these cases
is how a portion of the population can receive more
damage than others.
Many studies showcase how these algorithms
a
https://orcid.org/0000-0002-8831-0710
b
https://orcid.org/0000-0002-1238-4860
c
https://orcid.org/0000-0002-2398-1695
d
https://orcid.org/0000-0003-0125-630X
e
https://orcid.org/0000-0002-5945-0845
f
https://orcid.org/0000-0003-3333-6822
have negatively impacted the lives of minorities. One
example is the study presented by the ProPublica
news agency, showing that black defendants are two
times more likely to be given a score indicating high
risk of recidivism by the system used in Florida,
USA (Angwin et al., 2016). As per the study, these
scores result in harsher sentencing and a lesser chance
of parole. Another study points out the discrimina-
tion against minority neighborhoods by an online ser-
vice. The study indicated that the vast majority of
places not covered by a same-day delivery are inhab-
ited by black people or other ethnic minority in the
USA (Ingold and Soper, 2016). Discrimination based
on stereotypes is also presented in deployed robots,
showing racist and sexist actions (Hundt et al., 2022).
Cases such as the aforementioned are referred to
as algorithmic injustice or algorithmic racism, when
the discrimination perpetrated by the algorithm has
racial influence.
Silva (Silva, 2020) presented a compilation of
news coverage of algorithmic racism in the form o
a timeline. The first news report dates from 2010,
when a facial recognition software failed to identify
the eyes of a person of Asian decent as open and an-
other software failed to identify a black person and
their movement (Rose, 2010). The more recent report
in the same timeline is from 2020, which points to a
study that identified a large racial disparity in speech
recognition tools (Koenecke et al., 2020). The re-
searchers found that the average word error rate for
Dantas, A., Bianchin de Oliveira, G., Mendes de Oliveira, D., Pedrini, H., de Souza, C. and Dias, Z.
Algorithmic Fairness Applied to the Multi-Label Classification Problem.
DOI: 10.5220/0011746400003417
In Proceedings of the 18th International Joint Conference on Computer Vision, Imaging and Computer Graphics Theory and Applications (VISIGRAPP 2023) - Volume 5: VISAPP, pages
737-744
ISBN: 978-989-758-634-7; ISSN: 2184-4321
Copyright
c
2023 by SCITEPRESS – Science and Technology Publications, Lda. Under CC license (CC BY-NC-ND 4.0)
737

black speakers is more than double the average for
white speakers. They attributed this disparity to the
lack of diversity in the training dataset.
Silva’s timeline only covers the years 2010
through 2020, and it is notorious how much the num-
ber of reports has increased in the second half of the
decade. Although the timeline does not present more
recent cases, it is not hard to find more and more re-
ports about algorithmic racism such as the work of Gi-
choya (Gichoya et al., 2022), which determined that
standard machine learning models can determine with
accuracy the race of an individual based on medical
imaging such as X-ray and mammograms.
Chung (Chung, 2022) presented an in-depth study
on algorithmic racism with examples of how it has im-
pacted minorities. The study points out ways to rem-
edy algorithmic racism, including creating new rules
for algorithmic design and inserting sensitive data in
the auditing processes. The study concludes that we
should not only strive to design algorithms and sys-
tems that are not racist but to develop algorithms that
are anti-racist by improving equitable outcomes.
As response to this phenomenon, the field of Al-
gorithmic Fairness has been emerging in the literature
with growing interest. The field usually studies man-
ners in which algorithms can be modified to prevent
bias and subsequent discrimination.
Kleinberg et al. (Kleinberg et al., 2018) presented
a study that shows the benefits of considering sensi-
tive characteristics in a prediction algorithm. Galho-
tra et al. (Galhotra et al., 2020) introduced a method
for selecting features to obtain a fair dataset. Lin et
al. (Lin et al., 2020) showed methods to identify re-
gions of a dataset that have lower coverage and per-
formed experiments showing that explicitly including
these areas improved the overall accuracy of the meth-
ods. Roh et al. (Roh et al., 2021) presented a method
to pick a fair sample at the training batch level.
These works assume that the bias can be inserted
into the model via the dataset, and target different ar-
eas to treat this problem. Considering this assump-
tion, Asudeh et al. (Asudeh et al., 2022) developed
an optimization problem to select a fair sample of a
dataset. They considered that in a fair sample, every
class of attributes has the same coverage. This prob-
lem was called Fair Maximum Coverage (FMC) and it
models samples as subsets of attributes.
The objective the FMC problem is to find k sub-
sets of attributes such that the sum of the attribute’s
weights is maximum and each class of attributes is
equally represented. This problem was proven to be
NP-hard (Asudeh et al., 2022).
In this paper, we propose a method for selecting
a fair training sample based on the FMC and apply
this method to a cell classification problem. The main
difference of our method is that we consider justice
not as a restriction, but a goal to strive towards. For
this, we define a modified version of the problem and
use an Integer Linear Programming (ILP) model to
obtain an optimal solution. Through computational
experiments we show how our method has impacted
the classification process using a dataset of cell im-
ages provided by the Human Protein Atlas
1
(HPA).
We chose to work with this dataset as proof of concept
because of its size, variety of classes and disparity of
frequency of different labels, that will affect the level
of fairness we can achieve. We show that our method
has improved not only the classification of the smaller
and less frequent classes, but also the overall result.
Our main contributions are (i) to present a new
model based on ILP approach to cope with fairness
selection of subsets, and (ii) to assess our model on
a multi-label classification task, showing best results
compared to the random selection.
The remainder of this paper is organized as fol-
lows. In Section 2, we present the dataset, the nota-
tion, and concepts for our method, as well as the ex-
periments’ setup details. In Section 3, we report and
discuss our results. Lastly, in Section 4, we draw our
conclusions and discuss future work.
2 METHODOLOGY
In this section, we present our methods for generat-
ing a fair coverage, followed by a description of the
the dataset. and evaluation metric. We also describe
the setup details for generating a solution to the ILP
model, as well as the setup for the classification task.
2.1 Fairer Coverage
In this section, we present the Fair Maximum Cov-
erage and proposed problem, called Fairer Coverage.
We first introduce the notation and definitions neces-
sary for the discussion.
Suppose we have a universe set U formed by the
elements u
j
. A set composed of subsets S
ℓ
of the uni-
verse set U is called a family. We say an element u
j
of U is covered by a subset S
ℓ
of S if S
ℓ
contains u
j
.
A subset X of the family S is a cover of U if all the
elements of the universe set are covered by at least
one element of X. Moreover, if X has size k, then X is
called a k-cover of U. Now, given a set C of χ distinct
colors, such that C = {1,2, . . . , χ}, we call a coloring
of the universe set U a function that assigns one color
1
https://www.proteinatlas.org
VISAPP 2023 - 18th International Conference on Computer Vision Theory and Applications
738

c ∈ C to each element u
j
∈ U, that is, a coloring C is a
function C : U → C . We call a class a set of elements
colored with the same color.
Asudeh et al. proposed the Fair Maximum Cov-
erage (FMC) Problem to incorporate fairness in the
problems of covering (Asudeh et al., 2022). Given
a k-cover X and a coloring C, they defined a k-cover
X as fair if for each pair of colors c,d ∈ C the num-
ber of covered elements colored with the color c is
the same as the number of covered elements colored
with the color d. Given a universe set U, a family S ,
a coloring C, a positive integer k and a weight func-
tion w : U → R, Asudeh et al. defined the FMC as
the problem to find a fair k-cover such that the sum
of the weights of the covered elements is maximum.
This version of the problem has applications in Data
Integration and Facility Location and is proven to be
NP-hard (Asudeh et al., 2022).
The version of the fair coverage problem pre-
sented by Asudeh et al. has two critical assumptions.
Firstly, fairness is interpreted as equality among all
classes and, secondly, there is a restriction that forces
the cover size to be exactly k. These two character-
istics applied together might only be suitable in some
applications, as they create a very restricted solution
pool and define a problem that is NP-Hard even when
restricted to finding a feasible solution (Asudeh et al.,
2022).
In particular, this approach becomes undesirable
in the case of data integration with highly unbalanced
classes, such as the case of the HPA dataset. In data
integration, we are interested in selecting a fair set of
samples for the training, such that the training results
in a model with a reduced bias towards the smaller
classes. With this application, an element u
j
could
represent a label in multilabel classification problem,
a set would represent the group of labels attributed to
a single sample, and a family could represent a group
of samples from a dataset.
To better adapt the fair coverage problem for the
data integration, we present a modification of the FMC
presented by Asudeh et al.. We propose that fairness
can be treated as the objective of the problem and not
as a restriction. In this interpretation, we still assume
that a fair cover is a cover in which each class is rep-
resented equally, but admit that this might not always
be possible. For this version of the problem, we also
propose to remove the maximization of the covered
elements to avoid working with two potentially con-
flicting objectives. Instead, we add a new parame-
ter s that indicates the minimum number of elements
u
j
that need to be covered. We call this version the
Fairer Coverage Problem (FC). We present this ver-
sion of the problem in Definition 2.1.
Definition 2.1. Fairer Cover – FC
Input: A universe set U, a family S , a
coloring function C, a positive in-
teger s, and a positive integer k.
Objective: Find a k-cover that is as fair as
possible and covers at least s el-
ements.
To solve this problem, we present an Integer Lin-
ear Programming (ILP) model in Restrictions (1a) -
(1g). This model uses three types of decision vari-
ables. The first two are binary variables of the
form x
j
∈ {0,1} and y
ℓ
∈ {0,1} and represent the el-
ements u
j
of the universe U and the family S , re-
spectively. If x
j
= 1 in the ILP solution, then the ele-
ment u
j
is covered by the resulting k-cover. Similarly,
if variable y
ℓ
= 1 in the solution, then the subset S
ℓ
from the family S is part of the k-cover. The last de-
cision variable is z ∈ Z
χ,χ
+
, where χ is the number of
colors used in the coloring C. Let X
c
be the number
of covered elements colored with a color c. The pair
of variables z
c,d
and z
d,c
together indicate the absolute
value for the difference between X
c
and X
d
. Note that
if X
c
is greater than X
d
, then z
d,c
will be zero because
of the parameter k is positive. This model also uses
constants m and n to indicate the sizes of U and S , re-
spectively. Also, the constant C
c
denotes the number
of elements u
j
from U that are colored with c by the
coloring function C.
min
χ
∑
c=1
χ
∑
d=1
z
c,d
(1a)
s. t. x
j
≤
∑
ℓ | u
j
∈S
ℓ
y
ℓ
∀ j ∈ {1, 2, .. . ,m} (1b)
y
ℓ
≤ x
j
∀u
j
∈ S
ℓ
,∀S
ℓ
∈ S (1c)
n
∑
ℓ=1
y
ℓ
= k (1d)
m
∑
j=1
x
j
≥ s (1e)
∑
u
j
∈C
c
x
j
−
∑
u
i
∈C
d
x
i
≤ z
c,d
∀c,d ∈ C (1f)
x ∈ B
m
, y ∈ B
n
, z ∈ Z
χ,χ
+
(1g)
We consider the level of unfairness in a k-cover to
be the sum of the differences between the number of
elements of each pair of colors in said k-cover. As
such, a solution that is as fair as possible needs a level
of unfairness as small as possible. Considering this,
Equation (1a) denotes the objective of the problem,
which is to minimize the level of unfairness. The fol-
lowing two Restrictions ((1b) and (1c)) guarantee that
the solution is a cover. Restrictions (1b) define that if
an element u
j
is covered (x
j
= 1), then there needs to
be at least one subset S
ℓ
that contains u
j
that is part
Algorithmic Fairness Applied to the Multi-Label Classification Problem
739

of the of the solution (y
ℓ
= 1). On the other hand, Re-
strictions (1c) enforce that if a subset S
ℓ
is in the so-
lution (y
ℓ
= 1), then all elements u
j
∈ S
ℓ
are covered.
Restriction (1d) specifies that precisely k subsets S
ℓ
from the family S are part of the solution and, together
with the previous constraints, ensures that the solution
is indeed a k-cover. In Restriction (1e), the sum of x
j
will result in the number of covered elements, which
is then set to be at least the value of the parameter s.
In Restriction (1f), we can interpret each sum as the
number of covered elements of colors c and d, that is,
X
c
and X
d
. Therefore, the restriction defines that each
variable z
c,d
needs to be at least as big as the differ-
ence between X
c
and X
d
. If X
c
< X
d
, z
c,d
= 0 and the
inequality holds. Now, if X
c
> X
d
, then z
c,d
could be
any value greater than X
c
− X
d
, but we guarantee that
this will not be the case with the minimization in the
objective function (Equation (1a)). Lastly, Restric-
tion (1g) defines the domain of the decision variables.
2.2 Dataset
In order to train and evaluate our method, we used
a public image benchmark, which was presented by
Human Protein Atlas (HPA) program in the form of
a Kaggle challenge named “Human Protein Atlas -
Single Cell Classification”
2
. The challenge’s goal is
to classify and segment protein location labels on cell
images obtained by microscopes.
The dataset has 18 location labels that can be as-
signed to each image, and each one can have multiple
protein locations, making this task a multi-label clas-
sification. Each sample is composed of four differ-
ent images, representing channels of information: red
channel, highlighting the microtubules; blue channel,
indicating the nuclei; yellow channel, where the en-
doplasmic reticulum is shown; and lastly the green
channel shows the protein of interest.
The competition’s website provided two sets of
cell images, one for training and one for testing. As
the competition did not supply the labels of the testing
images, we split the original training set into training,
validation, and testing sets. We present in Table 1 the
number of images per set in our version of the dataset
(last row), as well as the number of images per label
in the different sets. From this table, we show the dif-
ference in coverage for specific classes. Note-worthy
cases are the Mitotic spindle label, which appear
in less than 100 images, and the Nucleoplasm label
that has the maximum presence in the dataset, with
almost 9000 appearances in total.
2
https://www.kaggle.com/competitions/
hpa-single-cell-image-classification
Table 1: Number of images per class (location label) on the
training, validation, and test set.
ID Name Train. Valid. Test
p
1
Nucleoplasm 5630 1418 1749
p
2
Cytosol 3631 952 1102
p
3
Plasma membrane 1991 488 632
p
4
Nucleoli 1587 386 478
p
5
Mitochondria 1307 309 397
p
6
Golgi apparatus 1164 281 401
p
7
Nuclear bodies 1137 291 364
p
8
Centrosome 1126 275 333
p
9
Nuclear speckles 903 248 274
p
10
Nucleoli fibrillar center 797 211 254
p
11
Nuclear membrane 705 168 222
p
12
Actin filaments 629 145 224
p
13
Intermediate filaments 608 149 207
p
14
Microtubules 521 144 153
p
15
Endoplasmic reticulum 488 118 169
p
16
Vesicles 359 113 121
p
17
Aggresome 160 39 53
p
18
Mitotic spindle 40 26 12
Number of images 13955 3489 4362
2.2.1 Obtaining a Fairer Training Subset from
the HPA Dataset
This section describes how we transformed the HPA
dataset into an instance of the Fairer Coverage prob-
lem and detail the protocol for obtaining the fairer
training dataset. We illustrate in Figure 1 a general
idea of the steps we followed.
To transform the training dataset into an instance
of FC, we defined that every identified protein in an
image is a distinct element u
j
of the universe set U,
totaling 22783 elements. Next, we determined that
the set of training images is the family S , and each
image is a subset S
ℓ
, totaling 13937 subsets. Since
the HPA dataset is also multi-class, we end up with
subsets of sizes varying from one to five. We also
defined 18 colors for the coloring function, one for
each label that indicates a protein in the image.
Since each element is a label representing a pro-
tein, the coloring function follows directly. We
defined six arbitrary values for the parameter k ∈
{1000,2000,3000, 4000, 5000, 10000}. To define the
value of s, we looked at the training dataset as a whole
and defined what are the maximum and minimum
number of elements that could be covered, regard-
less of fairness. To find the maximum number of el-
ements covered by k subsets, we considered a greedy
approach that adds to the cover first the images with
larger number of labels. Conversely, to find the min-
imum we used a greedy approach that favors first the
images with smallest number of labels. Given these
numbers, we calculated the average and use it as the
value for the parameter s. We show in Table 2 the val-
ues of maximum and minimum covered elements in
VISAPP 2023 - 18th International Conference on Computer Vision Theory and Applications
740

...
...
... ...
Transform dataset into
Fairer Cover instance
Solve Instance with
IBM's CPLEX
Train ResNet with
corresponding fair
subset
...
...
Fairer
Cover
...
...
Fairer
subset
Figure 1: Pipeline of the creation of a fair training data sub-
set for the HPA dataset.
the HPA training dataset. With these variations, we
created six instances for the FC that will result in dif-
ferent levels of fairness.
Table 2: Auxiliary data to define the values of parameter s
(Average) with the HPA dataset.
k Maximum Minimum Average
1000 3117 1000 2059
2000 5656 2000 3828
3000 7656 3000 5328
4000 9656 4000 6828
5000 11656 5000 8328
10000 18846 16745 17796
The next step illustrated in Figure 1 is to solve the
instances created for the FC problem. To find this so-
lution, we use an Integer Linear Programming model
described in Section 2.1, the implementation of which
is described in more detail in Section 2.5. Each solu-
tion of the FC will give us a k-cover, that is, a subset
of the family S . Note that this will correspond to a
subset of images of the HPA dataset. Therefore, we
save the reference to which images shall be used for
the training. We end up with six training datasets of
different sizes, which are not necessarily disjoint.
2.3 Classification Method
For the classification task, we used ResNet50 (He
et al., 2016) convolutional network. Based on the pre-
trained architecture on ImageNet dataset (Krizhevsky
et al., 2012), we fine-tuned this model on our
database.
As the most important information about the pro-
teins in this dataset is presented in the green image of
each data, we applied only this channel to our exper-
iments, considering images with 512 pixels of width
and 512 pixels of height.
To improve the results of our classification
method, we ran a grid search after the training step to
define a threshold. To do so, based on the prediction
of the validation set, we looked for the best value for
each label, that is, the threshold value that maximizes
the F
1
score for each label. In this search, we used
values ranging from 0.01 to 1.00 in steps of 0.01.
2.4 Evaluation Metric
Based on the F
1
Score of each label, we calculated the
mean of F
1
scores, called macro F
1
score, the official
metric on HPA dataset, to assess our method. Equa-
tion (2) presents the formula macro F
1
score, where i
represents the i-th label and N the number of labels.
Macro F
1
Score =
1
N
N
∑
i=1
F
1
Score
i
(2)
2.5 ILP Setup Details
The ILP model represented by the Equations (1a) -
(1g) was implemented using the programming lan-
guage C++ and compiled with g++ (version 11.3.0),
flags C++19, and -O3. The IBM CPLEX Studio
(version 12.8) was used as the integer programming
solver, with the multi-thread function turned off. The
experiments reported with the ILP model in the fol-
lowing section were executed in a laptop running a
Intel
®
Core™ i5-10210U CPU, with eight cores of
1.60GHz, 8GB of RAM, and Ubuntu 22.04.1 LTS as
the operating system. For each execution, we set a
time limit of 30 minutes.
2.6 Classification Setup Details
For the classification task, we fine-tuned each
ResNet50 during 200 epochs, with binary cross-
entropy loss function, Adam (Kingma and Ba, 2017)
optimizer with starter learning rate equal to 10
−5
,
early stopping technique per 20 epochs and reduced
learning rate by a factor of 10
−1
if the model did not
improve the validation loss in 10 epochs.
In all experiments, we employed TensorFlow
3
library and Google Colab virtual environment.
3
https://www.tensorflow.org
Algorithmic Fairness Applied to the Multi-Label Classification Problem
741
k=1000
k=2000
k=3000
k=4000
k=5000
k=10000
p
1
p
2
p
3
p
4
p
5
p
6
p
7
p
8
p
9
p
10
p
11
p
12
p
13
p
14
p
15
p
16
p
17
p
18
4
32
256
2048
4
32
256
2048
4
32
256
2048
4
32
256
2048
4
32
256
2048
4
32
256
2048
Number of covered elements
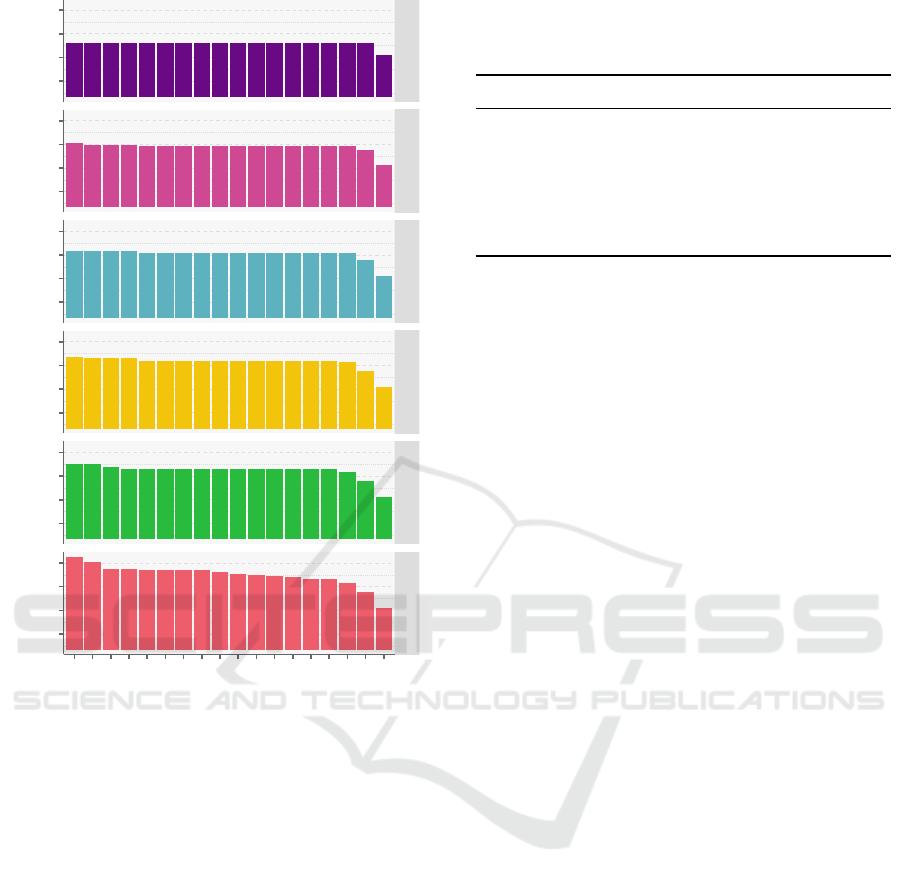
Figure 2: Number of covered elements by color class and
instance.
3 COMPUTATIONAL RESULTS
In this section, we present and discuss the experimen-
tal results obtained with our classification method.
ILP Results. We executed the implemented ILP
model with the six instances based on the HPA
dataset. All instances finished execution well before
the time limit, so the solutions are optimal. In Fig-
ure 2, we illustrate the solutions returned. Each graph
represents an instance with a different value for the
parameter k ∈ {1000, 2000, 3000, 4000, 5000,10000}.
The y-axes of the graphs in Figure 2 show the number
of elements of a given color covered by the k-cover.
Note that these axes are in logarithmic scale (base 2)
to improve readability, since some labels can be much
more frequent than others. The x-axis is shared by all
graphs and is labeled p
1
through p
18
indicating the
18 labels, such that p
1
represents the most frequent
label, p
2
denotes the second most frequent label, and
so on, until p
18
, which represents the least frequent
Table 3: Comparison between random and fair runs of dif-
ferent training subset. The best macro F
1
score of each ex-
periment is highlighted.
Training Size Random Fair
1000 0.393 ± 0.012 0.396 ± 0.009
2000 0.455 ± 0.013 0.457 ± 0.010
3000 0.481 ± 0.009 0.500 ± 0.008
4000 0.504 ± 0.009 0.505 ± 0.018
5000 0.519 ± 0.008 0.521 ± 0.010
10000 0.559 ± 0.011 0.570 ± 0.009
label. See Table 1 for more details on the labels, such
as name of the location and frequency in the dataset.
In an ideal case, each bar of the same color in
the graph from Figure 2 would have the same height.
However, this cannot happen due to the disparity
within the number of elements in each color class.
The smallest of the classes has only 40 elements,
while the largest has 5630 elements, which is over
one hundred times more. To satisfy the Restric-
tions (1d) and (1e) there will necessarily be a dif-
ference in the height of the bars between these two
classes, at least.
The reduction of unfairness will manifest more
prominently among the middle classes. By compar-
ing the intermediary classes, we can see they are al-
most the same height, except for instance k = 10000.
In this instance, a more significant number of color
classes are fully included in the cover, and yet they are
not able to match the frequency of the larger classes
to achieve a fairer coverage.
Classification Results. After solving the ILP model
and creating fair subsets of the original training set,
we employed the classification method. We also con-
sidered a random sub-sampling of the original train-
ing set without reposition of images, in order to com-
pare to our fair selection of training images.
We assessed our method considering the six dif-
ferent training subset sizes (1000, 2000, 3000, 4000,
5000, and 10000). For each size and type of subset,
we ran the classification method 10 times. In Table 3,
we present the mean and standard deviation results
on the test set considering the fair and random sub-
samplings of the original training set.
As seen, the fair subsets show the best out-
comes for all training sizes. Considering the sizes
of 1000, 2000, 4000, and 5000 training images, the
fair subset generation confirmed improvements on
macro F
1
score between 0.001 and 0.003. Consid-
ering the training sets of 3000 and 10000, fair selec-
tion surpassed random selection by a more significant
amount, 0.019 and 0.011, respectively.
VISAPP 2023 - 18th International Conference on Computer Vision Theory and Applications
742
1000
2000
3000
4000
5000
10000
p
18
p
17
p
16
p
15
p
14
p
12
p
13
p
11
p
10
p
9
p
8
p
6
p
7
p
5
p
4
p
3
p
2
p
1
0.0
0.2
0.4
0.0
0.2
0.4
0.0
0.2
0.4
0.0
0.2
0.4
0.0
0.2
0.4
0.0
0.2
0.4
Accumulated Macro F
1
fair random
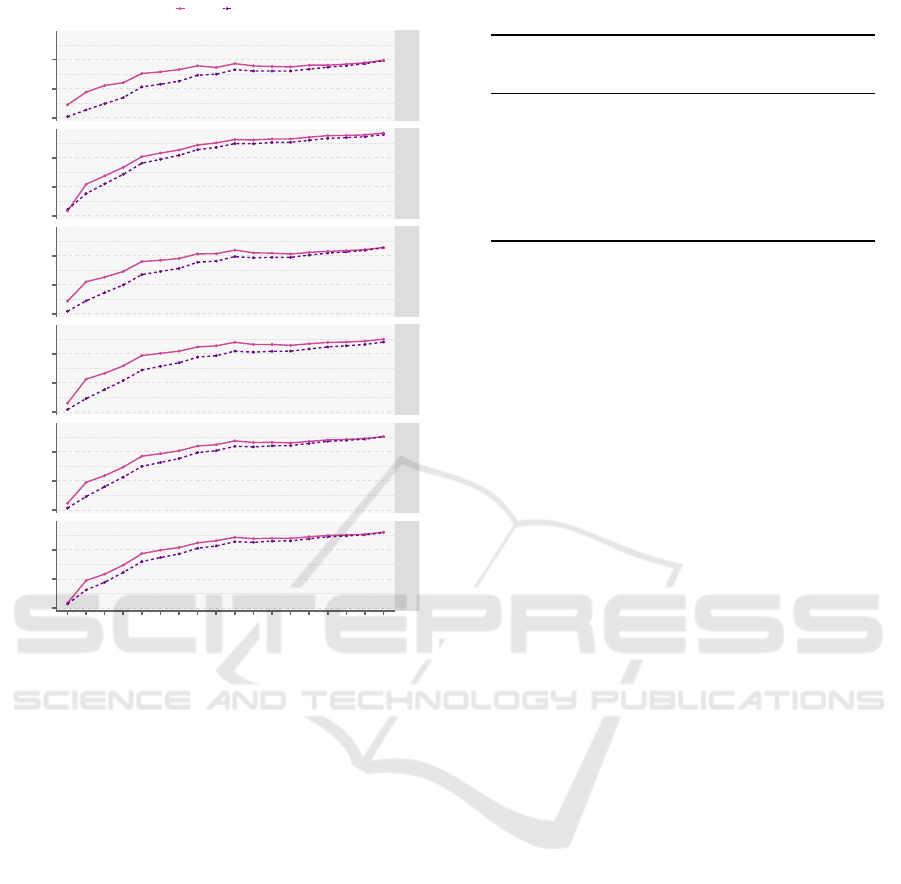
Figure 3: Accumulated macro F
1
score, from least to most
frequent class.
Fairness Analysis. In the previous section, we
showed that the training with our fair subset of im-
ages did not worsen the overall F
1
score of the clas-
sification model when compared to the random sam-
pling. We now expand the calculation of the macro
F
1
score to show the impact of our method on each
label. In Figure 3, we have six graphs, one for each in-
stance. The x-axis contains a reference to the classes
in reverse order of magnitude, from smaller to largest.
The y-axis of each graph represents the accumulated
macro F
1
score from the smallest class to the largest
class. That is, the first point from left to right is the
macro F
1
score of the smallest class; the second point
is the macro F
1
score of the two smallest classes, and
so on, until the last point, where we have the average
of all classes that represent a protein.
The graphs in Figure 3 have one line represent-
ing the results for the fair training subset and one for
the random training subset. The graphs reveal that the
fair subset improved the macro F
1
score for the small-
est classes. Since the final average is close in both
cases, we can infer from the graphs that the fair train-
ing subset resulted in a worse macro F
1
score than the
random training subset in the larger classes. We can
Table 4: Macro F
1
scores for larger and smaller classes.
k
Macro F
1
large
Macro F
1
small
Random Fair Random Fair
1000 0.486 0.446 0.300 0.346
2000 0.547 0.501 0.363 0.414
3000 0.575 0.546 0.387 0.455
4000 0.599 0.560 0.408 0.449
5000 0.612 0.579 0.427 0.463
10000 0.646 0.639 0.471 0.502
confirm this fact, though this was expected since the
number of samples in these classes reduces when the
fairness condition is considered. But, notably, the in-
dividual gain in macro F
1
score for the smaller classes
tends to be greater than the loss in the larger ones.
In Table 4, we show the macro F
1
scores for the
labels divided into two groups: large containing the
labels p
1
through p
9
(second and third columns) and
small containing p
10
through p
18
(fourth and fifth
columns). Each row in the table highlights the best
macro F
1
scores for the respective group. For ev-
ery training dataset size we can see a pattern where
the random training datasets have a greater macro F
1
score in the large group, whereas the fair training
datasets have a greater macro F
1
score in the small
group. This showcases the overall balancing of the
metric in the fair datasets, that can be seen as a reflec-
tion of the contrasts of fair and random datasets. We
tend to have more elements of the larger classes in the
random dataset, similar to the original distribution of
the HPA dataset (see Table 1). Contrarily, when cre-
ating the fair datasets, we cannot match the presence
of the smaller classes to that of the larger ones, due
to the limitations of the dataset. Thus, the fair dataset
reduces the number of covered elements of the large
group and increases that of the small group.
We present in Table 5 a summary of the results
shown in the graphs of Figure 3. The table has three
columns: the first indicating the size of the training
dataset, whereas the following two columns show the
standard deviation of the F
1
scores for all the 18 la-
bels, for the random and fair training dataset, respec-
tively. In the last column, we have the difference be-
tween the random and fair standard deviations. In
each row, we highlighted the smallest standard de-
viation. With the results in this table, we have that
the fairer training dataset also results in a more stable
classification. That is, the classification model does
not favor the dominant classes. Note that the smaller
training datasets are also fairer, and in these cases the
difference in standard deviations is more accentuated.
Algorithmic Fairness Applied to the Multi-Label Classification Problem
743

Table 5: Standard deviation of the F
1
scores for all the 18
labels, considering the two training sets (Random and Fair).
k Random Fair Difference
1000 0.194 0.157 0.037
2000 0.191 0.163 0.029
3000 0.193 0.163 0.030
4000 0.196 0.169 0.027
5000 0.191 0.171 0.020
10000 0.187 0.174 0.013
4 CONCLUSIONS
In this work, we present and discuss a new algorithm
to generate fair subsets from unbalanced datasets.
The results of ILP algorithm in the multi-label image
classification task showed consistent improvements
compared to the random sub-selection of the original
training set, considering both the global scope (macro
F1 score), and the F1 score of the less frequent labels.
As future research directions, we envision the in-
vestigation of the computational complexity of the
Fairer Coverage Problem and the application of our
method to different datasets. The HPA dataset is a
special case where we have a single characteristic for
each sample, but our method could easily be adapted
to select a fairer dataset from a more complex dataset,
i.e., containing more than one attribute. We also be-
lieve the method will be useful when applied to large
datasets that cannot be used in full for the training
phase due to computational limitations.
ACKNOWLEDGEMENTS
The authors would like to thank the S
˜
ao Paulo
Research Foundation [grants #2015/11937-9,
#2017/12646-3, #2020/16439-5]; Coordination for
the Improvement of Higher Education Person-
nel; and the National Council for Scientific and
Technological Development [grants #304380/2018-0,
#306454/2018-1, #309330/2018-1, #161015/2021-2].
REFERENCES
Angwin, J., Larson, J., Mattu, S., and Kirchner, L. (2016).
Machine Bias. ProPublica.
Asudeh, A., Berger-Wolf, T., DasGupta, B., and Sidiropou-
los, A. (2022). Maximizing coverage while en-
suring fairness: a tale of conflicting objective.
arXiv:2007.08069v3, pages 1–44.
Christin, A., Rosenblat, A., and Boyd, D. (2015). Courts
and predictive algorithms. In Data & CivilRight,
Washington, DC.
Chung, J. (2022). Racism In, Racism Out - A Primer on
Algorithmic Racism. Public Citizen.
Galhotra, S., Shanmugam, K., Sattigeri, P., and Varshney,
K. R. (2020). Causal Feature Selection for Algorith-
mic Fairness. arXiv:2006.06053v2, pages 1–12.
Gichoya, J. W., Banerjee, I., Bhimireddy, A. R., Burns,
J. L., Celi, L. A., Chen, L.-C., Correa, R., Dullerud,
N., Ghassemi, M., Huang, S.-C., et al. (2022). Ai
recognition of patient race in medical imaging: a mod-
elling study. The Lancet Digital Health.
He, K., Zhang, X., Ren, S., and Sun, J. (2016). Deep
residual learning for image recognition. In Conference
on Computer Vision and Pattern Recognition (CVPR),
pages 770–778. IEEE.
Hundt, A., Agnew, W., Zeng, V., Kacianka, S., and Gombo-
lay, M. (2022). Robots Enact Malignant Stereotypes.
In ACM Conference on Fairness, Accountability, and
Transparency, pages 743–756.
Ingold, D. and Soper, S. (2016). Amazon Doesn’t Consider
the Race of Its Customers. Should It? Bloomberg.
Available at http://bloom.bg/3p0DHKz.
Kingma, D. P. and Ba, J. (2017). Adam: A Method for
Stochastic Optimization. arXiv:1412.6980, pages 1–
15.
Kleinberg, J., Ludwig, J., Mullainathan, S., and Ram-
bachan, A. (2018). Algorithmic Fairness. AEA Papers
and Proceedings, 108:22–27.
Koenecke, A., Nam, A., Lake, E., Nudell, J., Quartey, M.,
Mengesha, Z., Toups, C., Rickford, J. R., Jurafsky,
D., and Goel, S. (2020). Racial disparities in auto-
mated speech recognition. Proceedings of the Na-
tional Academy of Sciences, 117(14):7684–7689.
Krizhevsky, A., Sutskever, I., and Hinton, G. E. (2012).
ImageNet classification with deep convolutional neu-
ral networks. In Advances in Neural Information
Processing Systems (NIPS), pages 1097–1105. Curran
Associates, Inc.
Lin, Y., Guan, Y., Asudeh, A., and Jagadish, H. V. J. (2020).
Identifying Insufficient Data Coverage in Databases
with Multiple Relations. Proceedings of the VLDB
Endowment, 13(12):2229–2242.
O’Neil, C. (2017). Weapons of math destruction: How big
data increases inequality and threatens democracy.
Crown.
Roh, Y., Lee, K., Whang, S., and Suh, C. (2021). Sam-
ple selection for fair and robust training. Advances in
Neural Information Processing Systems, 34:815–827.
Rose, A. (2010). Are Face-Detection Cameras Racist?
Time. Available at https://bit.ly/3A7lIsC.
Silva, T. (2020). Algorithmic Racism Timeline. Available
at http://bit.ly/3O6RJYC.
Wang, F., Xie, Z., Pei, Z., and Liu, D. (2022). Emer-
gency Relief Chain for Natural Disaster Response
Based on Government-Enterprise Coordination. Inter-
national Journal of Environmental Research and Pub-
lic Health, 19(18).
Waters, A. and Miikkulainen, R. (2014). GRADE: Machine
learning support for graduate admissions. AI Maga-
zine, 35(1):64–64.
VISAPP 2023 - 18th International Conference on Computer Vision Theory and Applications
744
