
Towards a Novel Edge AI System for Particle Size Detection in Mineral
Processing Plants
Fl
´
avio Wellb Cardoso
1,2
, Mateus Coelho Silva
3
, Nat
´
alia F. de C. Meira
3
,
Ricardo Augusto Rabelo Oliveira
1,3
and Andrea G. Campos Bianchi
1,3
1
Graduate Program in Instrumentation, Control and Automation of Mining Processes, Instituto Tecnol
´
ogico Vale,
Federal University of Ouro Preto, Ouro Preto, Brazil
2
VALE S.A., Nova Lima, Brazil
3
Department of Computer Science, Federal University of Ouro Preto, Ouro Preto, Brazil
fl
Keywords:
Edge AI, Particle Size Detection, Cloudlets, Mask R-CNN.
Abstract:
Monitoring and controlling the particle size is essential to reducing the variability and optimizing energy
efficiency in mineral process plants. The industry standard utilizes laboratory processes for particle size char-
acterization; the problems that arise here are obtaining representative sample from the bulk and finding a rapid
method of particle size assessment. We propose a machine vision concept based on Edge AI architecture and
deep convolutional neural algorithms to enable a real-time analysis of particle size, as an alternative to offline
laboratory process. The present paper is part of this proposed concept and aims exclusively to validate a deep
convolutional neural network algorithm trained from synthetic datasets. The proposed model reached a mean
Average Precision (mAP) of 0.96 and processing times of less than 1s. The results demonstrate the feasibility
of deep convolutional neural networks for real-time particle size segmentation and establishes the first step
towards a novel Edge AI system for particle size measurement in mineral processing plants.
1 INTRODUCTION
In mineral processing, analyzing the particle size
of products from operating units is fundamental for
determining the quality and optimizing energy effi-
ciency. In comminution
1
operations, for example, the
main objective is to release the valuable minerals from
their waste gangue
2
in the largest possible size to in-
crease energy efficiency and reduce fines (Wills and
Finch, 2015). Necessary plant operation and control
changes are made based on the particle size analy-
sis results, either by an operator or an automatic con-
troller (e.g., (Coetzee et al., 2009)).
There are several instruments and methods for lab-
oratory particle size analysis. Some examples of these
methods are sieving, laser diffraction, microscopy,
gravitational sedimentation, and centrifugal sedimen-
tation(Allen, 2013). However, the characterization
of particle sizes in the laboratory presents a range
of challenges in terms of time-consuming, expensive
bulk sampling equipment, and long response times,
1
comminution: the process of reducing the size of ore
particles by crushing or grinding.
2
gangue: mineral without economic value.
limiting the particle size analysis in all critical points,
especially in existing plants.
New methods, systems, and equipment have been
developed as an alternative to laboratory analysis for
particle size characterization. These applications aim
to allow real-time, non-intrusive, and low-cost analy-
Figure 1: Conceptual Architecture.
312
Cardoso, F., Silva, M., Meira, N., Oliveira, R. and Bianchi, A.
Towards a Novel Edge AI System for Particle Size Detection in Mineral Processing Plants.
DOI: 10.5220/0011748000003467
In Proceedings of the 25th International Conference on Enterprise Information Systems (ICEIS 2023) - Volume 1, pages 312-323
ISBN: 978-989-758-648-4; ISSN: 2184-4992
Copyright
c
2023 by SCITEPRESS – Science and Technology Publications, Lda. Under CC license (CC BY-NC-ND 4.0)

sis (Okada et al., 2020; Al-Thyabat et al., 2007; Thur-
ley and Ng, 2008).
Although significant advances have been made
in online particle size measurement by computer vi-
sion techniques, challenges to improve accuracy and
reduce prediction errors remain in the mineral pro-
cess due to irregular, noisy, and fuzzy particle ore
images caused by adverse environmental conditions,
e.g., dust and uneven lighting. Moreover, current
market solutions are costly and dependent on specific
embedded hardware and close-source software (e.g.,
(Guyot et al., 2004)).
As an alternative to overcome these previous re-
lated challenges, we propose a conceptual architec-
ture design to enable centralized processing of arti-
ficial intelligence algorithms, displayed in Figure 1.
This concept aims to enable online particle size analy-
sis, by computer vision and deep convolutional neural
networks, at all critical points of mineral processing
plants. This approach tends to reduce on-site hard-
ware, easily integrate with process control and qual-
ity management systems, reduce maintenance costs,
increase processing capacity, reduce vulnerability to
obsolete hardware, and simplify technology upgrades.
Toward the proposed concept, the present paper
aims to validate the deep convolutional neural algo-
rithm as the first step for online particle size analysis
based on Edge AI. The advances of this research will
include identifying hardware and software require-
ments to process real-time video images in a central-
ized cloudlet unit by these artificial intelligence algo-
rithms.
To investigate the feasibility of using a convolu-
tional neural algorithm to segment iron ore particles in
complex images, we deployed the Mask R-CNN(He
et al., 2017) algorithm, considered a state-of-the-art
algorithm for object detection and instance segmenta-
tion. The objective is to evaluate the model’s accuracy
to segment iron ore particles from primary crusher
system images. In addition, we propose a synthetic
dataset for training and model validation as an alter-
native to manually labeling data, an exhausting and
time-consuming operation needed to attend to a large
volume of data required for training.
This paper is organized as follows: Section 2
presents the theoretical references used to complete
this work. In Section 3, we overview the most rele-
vant related works recently found in the bibliography.
Section 4 presents the experimental methodology ap-
plied to validate the convolutional neural network al-
gorithm. In Section 5, we show the results obtained
by our approach. Finally, in Section 6 we discuss the
results achieved and future improvements.
2 THEORETICAL BACKGROUND
The fundamental concept for developing an applica-
tion with the desired features is Edge AI. This con-
cept relates to several authors’ practices in uniting
edge computing with artificial intelligence (AI) algo-
rithms to develop solutions for real-world problems
(Wang et al., 2020b). Thus, the theoretical references
initially cover understanding AI and edge computing
and how they can work together toward Edge AI ap-
plications.
2.1 Edge Computing
In this first subsection of the theoretical references,
we provide a definition and evaluation of the concepts
within edge computing. We start from the perspective
displayed by Khan et al. (Khan et al., 2019). Accord-
ing to these authors, edge computing is a computing
landscape concept that brings cloud utilities closer to
the edge. Both Khan et at. and Wang et al. (Wang
et al., 2020b) recognize three main edge computing
perspectives:
• Cloudlets: Within this perspective, infrastructures
with large computing power provide virtualization
of cloud-like services;
• Fog computing: This perspective describes the us-
age of distributed computing to virtualize cloud
services;
• Mobile Edge Computing: In this case, the services
run within isolated edge computing networks or
environments.
Although these concepts describe a set of het-
erogeneous applications, they provide the central
premise of edge computing: reducing the latency of
a provided service and bringing the processing power
closer to the edge. Shi and Dustdar (Shi and Dustdar,
2016) enforce that novel interconnected technologies
and perspectives such as the Internet of Things (IoT)
have impacted the need for novel edge-based solu-
tions.
2.2 Artificial Intelligence (AI)
While edge computing is a relatively new concept,
artificial intelligence (AI) has been discussed for
decades. McCarthy (McCarthy, 2007) describes AI as
the science and technology to create novel intelligent
machines. In his concept, intelligence is the ability
to learn how to solve a real-world problem through
algorithms.
Shinde and Shah (Shinde and Shah, 2018) concep-
tualize AI as the capability of creating what they de-
Towards a Novel Edge AI System for Particle Size Detection in Mineral Processing Plants
313

scribe as intelligent agents. These agents are capable
of maximizing their success opportunities by analyz-
ing environmental variables.
The set of algorithms described by these rules
is named machine learning (El Naqa and Murphy,
2015), while the latest set of algorithms within this
perspective is named deep learning (LeCun et al.,
2015).
2.3 Edge AI
There is an increasing interest in uniting the latest
deep learning applications within the context of edge
computing (Deng et al., 2020). Although AI often
uses all possible resources from the device, there is an
interest in bringing these services closer to the edge,
where computing resources can be limited.
This edge computing and machine learning con-
vergence is named Edge AI (Li et al., 2019). It is also
referred to in the literature as edge intelligence (Deng
et al., 2020), In-edge AI (Wang et al., 2019), or treated
without specific names in other works. This comput-
ing perspective requires aspects from edge comput-
ing, distributed computing, and AI. Some important
constraints in this case are hardware acceleration for
AI (Li et al., 2019) and communication (Shi and Dust-
dar, 2016).
2.4 Mask R-CNN
The Mask Regional Convolutional Neural Network
(Mask R-CNN) is a meta-algorithm concept proposed
by He et al. (2017) (He et al., 2017), a family mem-
ber of region-based methods for object detection. In
general terms, Mask R-CNN uses the framework of
Faster R-CNN (Ren et al., 2015), adding a branch
for object mask prediction, being executed in paral-
lel with the function of classification and delimitation
of this object by the bounding box. Figure 2 shows
the basic framework of Mask R-CNN.
The first stage of Mask R-CNN is structured with
convolution layers, using a backbone composed of a
ResNet101 (He et al., 2015) and a Feature Pyramid
Network (FPN) (Lin et al., 2016) that will output a
high-resolution feature map. Then, a Region Proposal
Network (RPN) is responsible for the Region of Inter-
est (RoI) from the Feature Map, ranking its relevance
according to the backbone results.
The result of the RPN is a variable number of
RoIs, which in turn will have different dimensions
between them, according to the quantity and size of
the detected objects. This way, Mask R-CNN re-
sizes the RoIs for the second stage, adjusting them to
the dimensions established by the following convolu-
Figure 2: Mask R-CNN Framework(He et al., 2017).
tion layers. At this point, the concept proposed by
Mask R-CNN brings an essential improvement over
the solution usually applied in Faster R-CNN, us-
ing the Region of Interest Align (RoIAlign)(Girshick,
2015) method instead of Region of Interest Pooling
(RoIPool)(Girshick, 2015) to resize the images. The
fundamental difference between the two methods is
that RoIAlign can maintain a spatial alignment rela-
tionship between the pixels of the input image and
the resized output image. This feature of RoIAlign
preserves important spatial information, which is re-
sponsible for improved mask accuracy from 10% to
50%.
The second stage then starts after the RoIAlign
layer, having two distinct branches—the first consists
of two Fully Convolutional Network (FCN) (Long
et al., 2014) layers being applied to each RoI. As the
output of this branch, we will have a binary mask
segmenting the object of interest at the pixel level.
The second branch performs the object classification
and generates the bounding boxes, using a regression
method, exactly as performed in Faster R-CNN. The
concept of separate branches for classification and
segmentation is somewhat of a paradigm break where
usually an object is first segmented to be classified.
However, He et al. consider this a critical point be-
cause, in the loss functions defined, the segmentation
process does not compete with the classification.
3 RELATED WORKS
In this section, we display some works related to the
solution proposed in this paper. Mainly, we study
techniques that employ novel computing technologies
to perform the same task. We concentrated this sec-
tion on understanding how other authors use the Mask
R-CNN in materials science and mining. Also, we
overviewed other deep learning techniques employed
in the same areas.
ICEIS 2023 - 25th International Conference on Enterprise Information Systems
314

3.1 Mask R-CNN Applied to Materials
Science and Mining
Huang et al. (Huang et al., 2020) implemented the
Mask R-CNN for stockpile aggregate segmentation.
The authors manually labeled 164 images (11,795 ag-
gregates) for training and 20 images for validation.
The dataset organized by these authors contained ag-
gregates of various geological origins and different
sizes, colors, textures, and viewing angles. Detection
precision was higher than 87% for all test instances.
Maxwell et al. (Maxwell et al., 2020) combined
LiDAR to obtain digital terrain data and the Mask
R-CNN algorithm to extract valley fill faces (VFFs),
which are a product of mountaintop removal (MTR)
coal mining. The precision, recall, and F1-score met-
rics were above 0.85.
Iyas et al. (Iyas et al., 2020) implemented the
Mask R-CNN algorithm to identify rock-forming
minerals in images. The authors tested four models,
modifying the backbone architecture (ResNet-50 and
ResNet-101) and the influence of the lighting on a po-
larizing microscope. The AP metric was higher for
model B (58.0%), which used the lighting on a polar-
izing microscope and ResNet-101 backbone.
Dong et al. (Dong et al., 2021) proposed a new al-
gorithm for segmenting mineral images of deep sea
nodules based on Mask R-CNN. The authors com-
pared it to other deep learning models such as U-Net
and Generative Adversarial Network. The experimen-
tal results showed that the method based on Mask R-
CNN obtained the best results for accuracy, recall,
and IoU. U-Net obtained the best result for the pre-
cision metric.
Yang et al. (Yang et al., 2021) developed a sys-
tematic tool to identify and evaluate images of parti-
cles and granular materials that the authors called im-
ages of cobble and ballast. First, they used the Mask
R-CNN to implement instance segmentation and ex-
tract the particle contour. Next, the authors used com-
putational techniques and statistical analysis to evalu-
ate these materials’ elongation, angularity, and rough-
ness.
Zhang et al. (Zhang et al., 2019) implemented the
Mask R-CNN to segment nanoparticle images from
images obtained from the Transmission Electron Mi-
croscope. Then the authors fit the contour of the
nanoparticles with a circle and measure the size based
on that fit.
3.2 Deep Learning Applied to Object
Segmentation in Materials Science
and Mining
Detecting and segmenting particles and agglomerates
is a challenge for several areas, especially in materials
science, mining and metallurgy. In addition to particle
detection, performing the granulometric distribution
of these materials is often necessary.
The work by Bukharev et al. (Bukharev et al.,
2018) sought to develop a method for segmenting
mineral grains in thin-section images of sandstone.
The images were obtained using an optical micro-
scope, and the authors implemented the model for a
training sample of 9,000 instances. The task consisted
of segmenting quasi-convex objects without occlu-
sions. The authors implemented an algorithm based
on a cascade of two fully-convolution neural networks
(FCNN). The authors used 10-fold validation to test
the model’s quality. The AP metric was above 76%.
Bamford et al. (Bamford et al., 2021) evaluated
the size of rock fragments from blast operations in
mines using deep learning strategies. The dataset con-
sisted of labeled images of dynamited rock fragments,
61,853 for training and 1263 for validation. The au-
thors implemented a base architecture of ResNet50.
When evaluated using the test suite, the percent error
for coarse feature size prediction ranges within ±25%.
Wang et al. (Wang et al., 2020a) used transfer
learning and implemented the Mask R-CNN algo-
rithm to monitor open pit mines. The images came
from satellite shots. The authors used the ResNet101
network as a backbone.
Frei and Kruis (Frei and Kruis, 2021) introduced
the new FibreR-CNN architecture that combines two
established R-CNN architectures (Mask and Keypoint
R-CNN) to automate the task of analyzing fiber-
shaped materials. FibeR-CNN surpassed Mask R-
CNN’s AP metric by 11 percentage points.
3.3 Section Remarks
These works describe applications similar to the pro-
posal of this article, emphasizing that implementa-
tions based on deep learning are intensely used as
an alternative to conventional methods of computer
vision in materials science, mining, and metallurgy.
However, they differ in application focus or technique
compared to our work. In addition, the industrial en-
vironment consists of a complex scenario, and the im-
ages present variability, such as occlusion, complex
background, rotation, lighting changes, image resolu-
tion, and noise (de C Meira et al., 2022).
Towards a Novel Edge AI System for Particle Size Detection in Mineral Processing Plants
315
Validating models and applications as proof of
concept in these case studies is still challenging. Our
work, therefore, contributes to the advancement of ap-
plications in this area.
4 EXPERIMENTAL
METHODOLOGY
This section presents the experimental methodology
suggested for validating the convolutional neural al-
gorithm. For this, we present the dataset develop-
ment method, the model training strategy, and the ap-
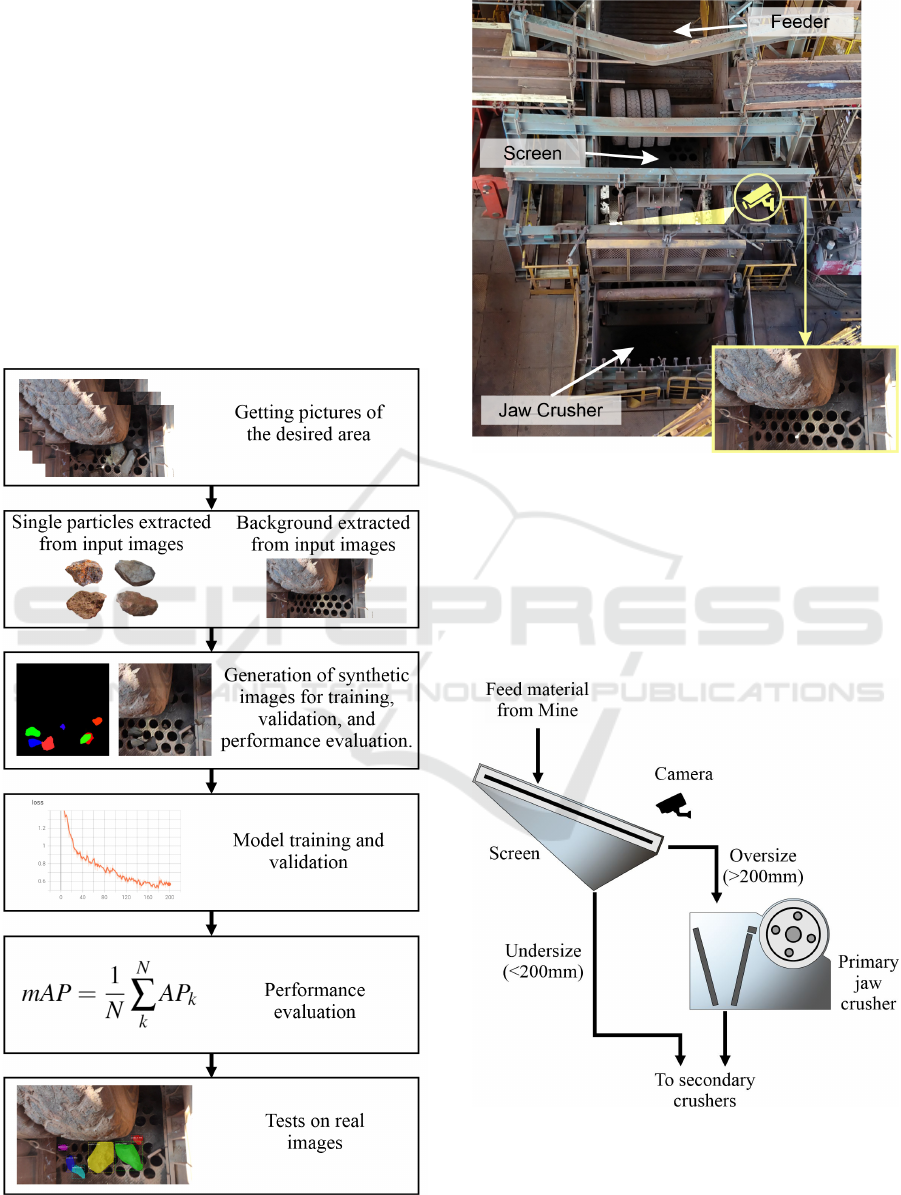
plied evaluation metrics. A schematic diagram of the
methodology is presented in Figure 3.
Figure 3: Experimental Methodology Flowchart.
Figure 4: Primary Crusher System.
The study was developed from digital images ob-
tained from a Primary Crushing System showed in
Figure 4. The images originate from the primary jaw
crusher feed screen, whose ore fragments are in the
granulometric range between 200mm and 1000mm.
Figure 5 displays a flowchart that represents this pro-
cess.
Figure 5: Primary Crusher System.
ICEIS 2023 - 25th International Conference on Enterprise Information Systems
316
4.1 Dataset
Particular attention was paid to dataset development.
As mentioned before, the large volume of data re-
quired for training a neural network usually has been
the cause of considerable difficulties in obtaining
models with high accuracy in the face of manually
labeling data.
The synthetic dataset for training the network was
developed from real images of the application, ob-
tained from videos recorded at the place of interest
and an algorithm
3
. We propose this approach as an
alternative to manually labeling data. The algorithm
randomly selected the objects from a defined set of
foregrounds (iron ore particles) and overlaid them at
random positions in the background. During the over-
lay, rotation, scale, and brightness transformations are
applied to the objects.
Using this approach, from a set of 100 objects
(fragments) and two backgrounds, the algorithm gen-
erated 7,000 images for training and 3,000 for valida-
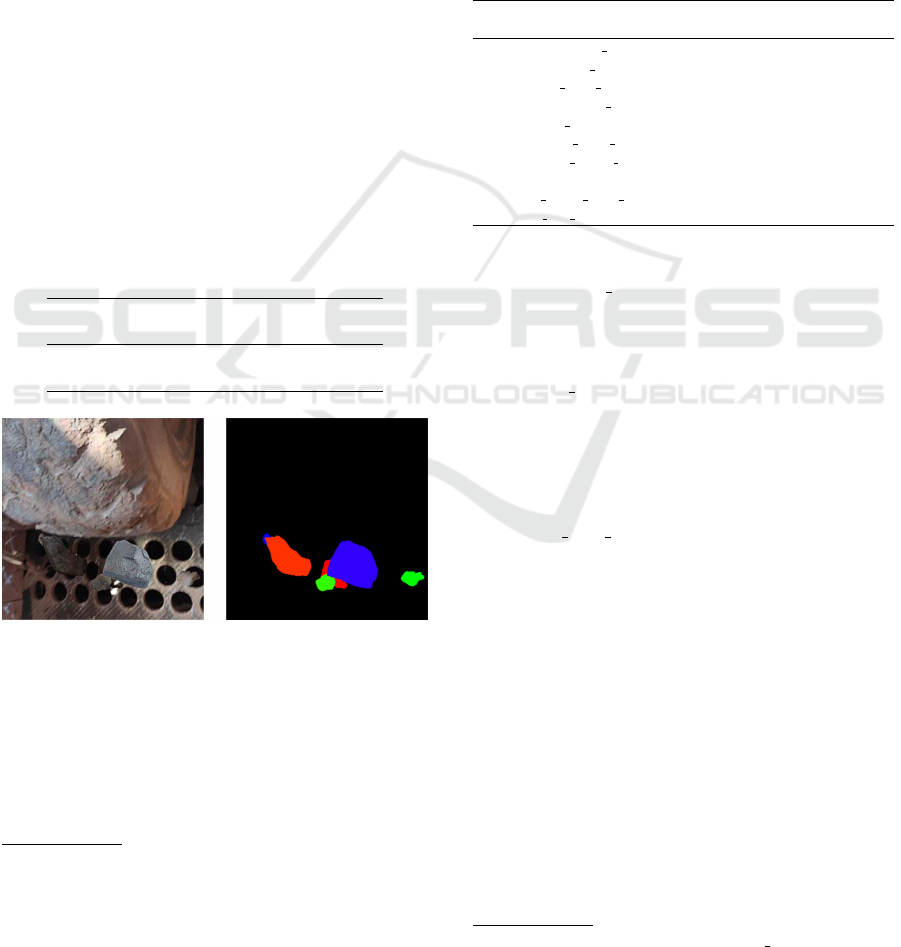
tion (Table 1). Figure 6 presents an example of the
synthetic image and its respective mask generated by
the algorithm.
Table 1: Dataset composition.
Number of
images
Annotated
regions
Training 7,000 31,406
Validation 3,000 13,379
Figure 6: Example of synthetic image and mask generated.
After composing the image, the algorithm gener-
ates the mask of the instantiated objects of each image
and the labelings in MS COCO
4
dataset format. This
technique makes it possible to generate a considerable
amount of synthetic images to be applied to the net-
work training and validation stages.
3
The algorithm mentioned is an adap-
tation from open-source code available at
https://github.com/akTwelve/cocosynth
4
Microsoft Common Objects in Context (MS COCO) is
a large-scale image dataset
4.2 Hyperparameters
The selection of hyperparameters holds a crucial sig-
nificance in determining the efficacy of the model.
The optimization of these values requires a compre-
hensive grasp of both the input data and the underly-
ing model architecture, as well as a clear comprehen-
sion of the desired outcome. The Mask R-CNN
5
was
implemented from the original repository available on
GitHub, and allow the customization of 48 hyperpa-
rameters. The Table2 summarizes the values applied.
Table 2: Hyperparameter values adjusted in Mask R-CNN.
Variable name in Matterport
Implementation
Train 1 and
Tain 2
Train 3 and
Train 4
LEARNING RATE 0.001 0.001
BATCH SIZE 1 1
STEPS PER EPOCH 100 100
VALIDATION STEPS 10 10
NUM CLASSES 2 2
IMAGE MIN DIM 320 320
IMAGE MAX DIM 320 320
BACKBONE resnet50 resnet101
TRAIN ROIS PER IMAGE 16 16
MAX GT INSTANCES 10 10
The main adjustments were:
• LEARNING RATE: The learning rate was kept at
its default value of 0.001. This value was deemed
suitable as it did not result in instability during
training, as demonstrated by the loss curves.
• BATCH SIZE: refers to the number of samples
utilized in a single training step. It was set to 1 to
accommodate the GPU’s memory constraints. A
small batch size typically requires less computa-
tional resources to complete an epoch but requires
a high number of epochs to converge.
• STEPS PER EPOCH: The number of steps per
epoch is typically determined by the size of the
dataset in relation to the batch size. In this case,
the dataset comprises 10,000 images and the batch
size is set to 1, resulting in a maximum of 10,000
steps per epoch. However, this is not a practi-
cal option as the loss value is only measured at
the end of each epoch, which makes it difficult
to track the progress of the model’s training. To
overcome this challenge and effectively monitor
the loss, the number of steps per epoch was re-
duced to 100. This change required an increase
in the number of epochs to ensure that the model
had sufficient training time to converge and reach
stability. With this adjustment, the model’s train-
ing progress could be monitored more effectively,
enabling fine-tuning for optimal performance.
5
https://github.com/matterport/Mask RCNN
Towards a Novel Edge AI System for Particle Size Detection in Mineral Processing Plants
317

• IMAGE MIN DIM and IMAGE MAX DIM: re-
sponsible for controlling the resolution of the in-
put image. The default value is 1024x1024. It
was adjusted to 320x320 according to the dataset
created in MS COCO format.
• BACKBONE: By default, Mask R-CNN uses
ResNet101 as its backbone. For comparison pur-
poses, training was done using ResNet101 and
ResNet50. Since ResNet101 is deeper, it does
have higher memory consumption, longer pro-
cessing time as well as longer trainning time,
however it reaches higher accuracy. On the other
hand, ResNet50 has lower memory consumption,
shorter processing time and shorter trainning time,
hence its accuracy is not as higher as ResNet101.
• TRAIN ROIS PER IMAGE: corresponds to the
number of regions of interest generated per im-
age. The default value is 32. It was reduced to
16 as the dataset used in this study only contains a
maximum of 16 fragments per image. This adjust-
ment was made with the aim of decreasing train-
ing time.
• MAX GT INSTANCES: corresponds to the max-
imum number of instances that can be detected in
one image and was set to 10. If the number of in-
stances in the images are limited, this can be set
to maximum number of instances that can occur
in the image to reduce false positives and training
time.
4.3 Training the Deep Learning Model
Two training sessions were performed for each back-
bone configuration (ResNet101 and ResNet50). The
initial training was done in 100 epochs (with 100
steps per epoch) using the transfer of learning weights
available in MS COCO. In this step, only the head lay-
ers were trained as a transfer learning strategy, keep-
ing the weights of the convolutional layers frozen.
After the initial training, a refinement was per-
formed, training the model for another 100 epochs.
The fine-tuning step performed the training of the en-
tire network, initializing with the weights obtained
from the initial training. Thus, the training of each
model was done in two steps, totaling 200 epochs,
with 100 steps per epoch. The hardware used was
an Intel Core i7-11800H@2.30GHz computer with
64GB RAM.
4.4 Evaluation Metrics
In order to generate a graphical representation of
the loss values, we used Tensorboard, a Tensorflow
toolkit that allows monitoring and visualization of
metrics such as loss accuracy. The Mask R-CNN uses
three different types of losses as defined in (1). The
total loss (L) is calculated as the sum of the classifi-
cation loss (L
cls
), bounding box loss (L
box
), and mask
loss (L
mask
) for each object instance in the input im-
age.
L = L
cls
+ L
box
+ L
mask
(1)
Where:
L
cls
= L
cls(RPN)
+ L
cls(mask)
L
box
= L
box(RPN)
+ L
box(mask)
L
mask
= L
mask
The mean Average Precision (mAP) metric was
used to calculate the model’s accuracy according to
(2), where N represents the number of classes. The
Average Precision (AP) corresponds to the area under
the Precision Vs. Recall curve and could be defined
as (3). In turn, the Precision p(k) and Recall r(k) val-
ues are calculated according (4) and (5), respectively.
Precision measures the accuracy of predictions, while
Recall measures the ability of a model to find all ob-
jects that should have been detected.
mAP =
1
N
N
∑
k
AP
k
(2)
AP =
N
∑
k=1
p(k) [r(k) − r(k + 1)] (3)
p(k) =
T P
k
T P
k
+ FP
k
(4)
r(k) =
T P
k
T P
k
+ FN
k
(5)
The classification of detections is defined ac-
cording to the Intersection over Union (IoU ) met-
ric, presented in (6). If the intersection between the
algorithm-generated bounding box and the labeled
bounding box is greater than 0.5, the detection will
be classified as True Positive (T P). If it is less than
0.5, the detection will be classified as False Positive
(FP), and if there is no detection by the algorithm for
any labeled bounding box, it will be classified as False
Negative (FN).
IoU =
Area of Overlap
Area of Union
=
A
T
B
A
S
B
(6)
ICEIS 2023 - 25th International Conference on Enterprise Information Systems
318
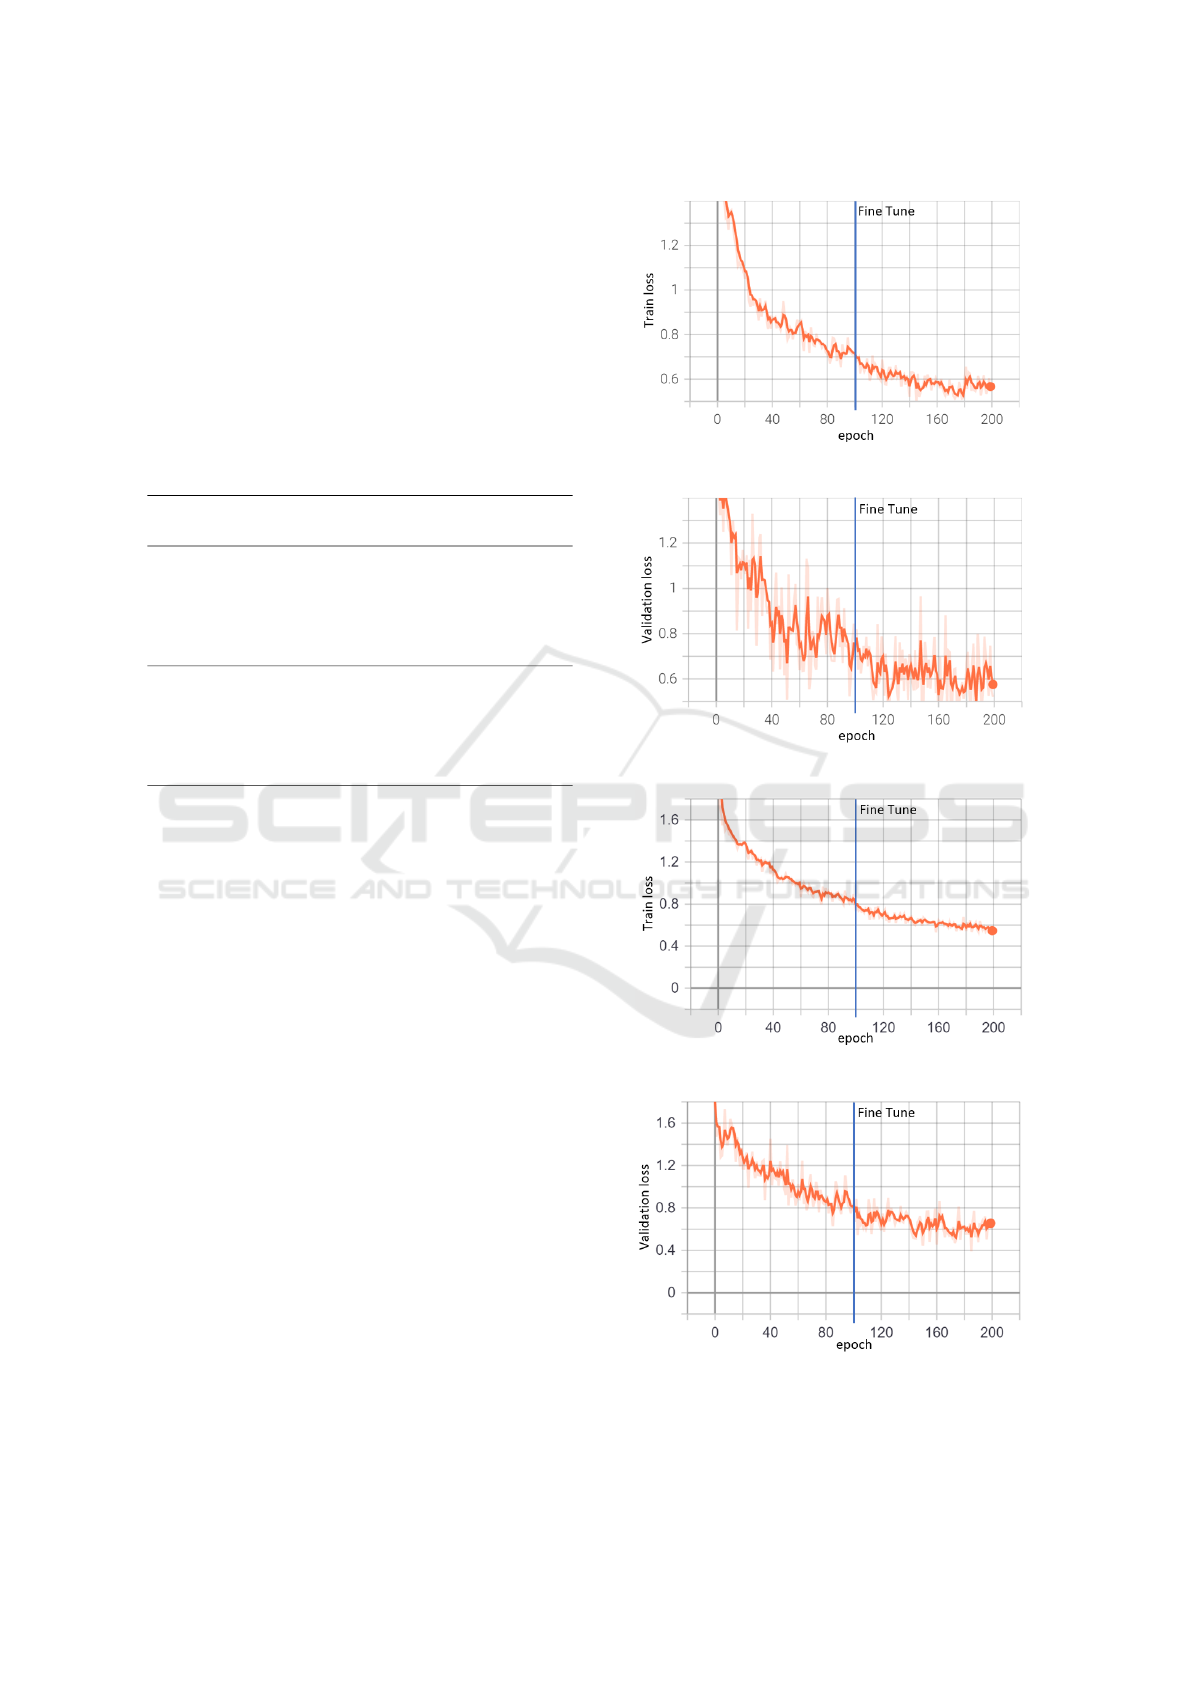
5 RESULTS
The results of the training sessions were categorized
as shown in Table 3, where the highlighted values
indicate the lowest value for the selected loss. The
overall loss of the model using ResNet50 as its back-
bone is depicted in Figures 7 and 8 for the training
and validation phases, respectively. The model using
ResNet101 as its backbone is presented in Figures 9
and 10.
Table 3: Loss values obtained in the training sessions per-
formed.
LOSSES ResNet50 ResNet101
Acronym Variable Name
100th
epoch
200th
epoch
100th
epoch
200th
epoch
Training
L loss 0,710 0,551 0,814 0,541
L
box(mask)
mrcnn bbox loss 0,144 0,106 0,148 0,107
L
cls(mask)
mrcnn class loss 0,086 0,063 0,085 0,056
L
mask
mrcnn mask loss 0,200 0,160 0,178 0,173
L
box(RPN)
rpn bbox loss 0,269 0,212 0,384 0,197
L
cls(RPN)
rpn class loss 0,012 0,010 0,019 0,056
Validation
L val loss 0,845 0,521 0,806 0,682
L
box(mask)
val mrcnn bbox loss 0,119 0,087 0,154 0,100
L
cls(mask)
val mrcnn class loss 0,120 0,081 0,085 0,115
L
mask
val mrcnn mask loss 0,246 0,118 0,216 0,198
L
box(RPN)
val rpn bbox loss 0,354 0,227 0,335 0,262
L
cls(RPN)
val rpn class loss 0,007 0,008 0,016 0,008
The effectiveness of the model can be evaluated
by analyzing the various losses calculated during the
training and validation phases, as described below:
• L
cls(RPN)
(rpn class loss): refers to the loss in-
curred by the Region Proposal Network’s incor-
rect labeling of anchor boxes as having or not hav-
ing an object. A low value indicates a high level
of accuracy in the model’s object detection.
• L
cls(mask)
(mrcnn class loss): refers to the loss in-
curred due to incorrect labeling of objects within
the proposed region. A low value indicates that
the detected objects are being accurately classi-
fied.
• L
box(RPN)
(rpn bbox loss): refers to the precision
of the RPN in placing the bounding box. A low
value indicates that the bounding box is accurately
positioned on the detected object.
• L
box(mask)
(mrcnn bbox loss): refers to the loss as-
signed to the placement of the bounding box for
a class, as determined by the mask branch. A
low value implies a high degree of accuracy in the
bounding box’s positioning.
• L
mask
(mrcnn mask loss): refers how precisely the
masks outline the objects at the pixel level. A
low value indicates that the mask accurately fits
around the object’s boundaries.
Figure 7: ResNet50 Backbone - overall training loss.
Figure 8: ResNet50 Backbone - overall validation loss.
Figure 9: ResNet101 Backbone - overall training loss.
Figure 10: ResNet101 Backbone - overall validation loss.
Towards a Novel Edge AI System for Particle Size Detection in Mineral Processing Plants
319
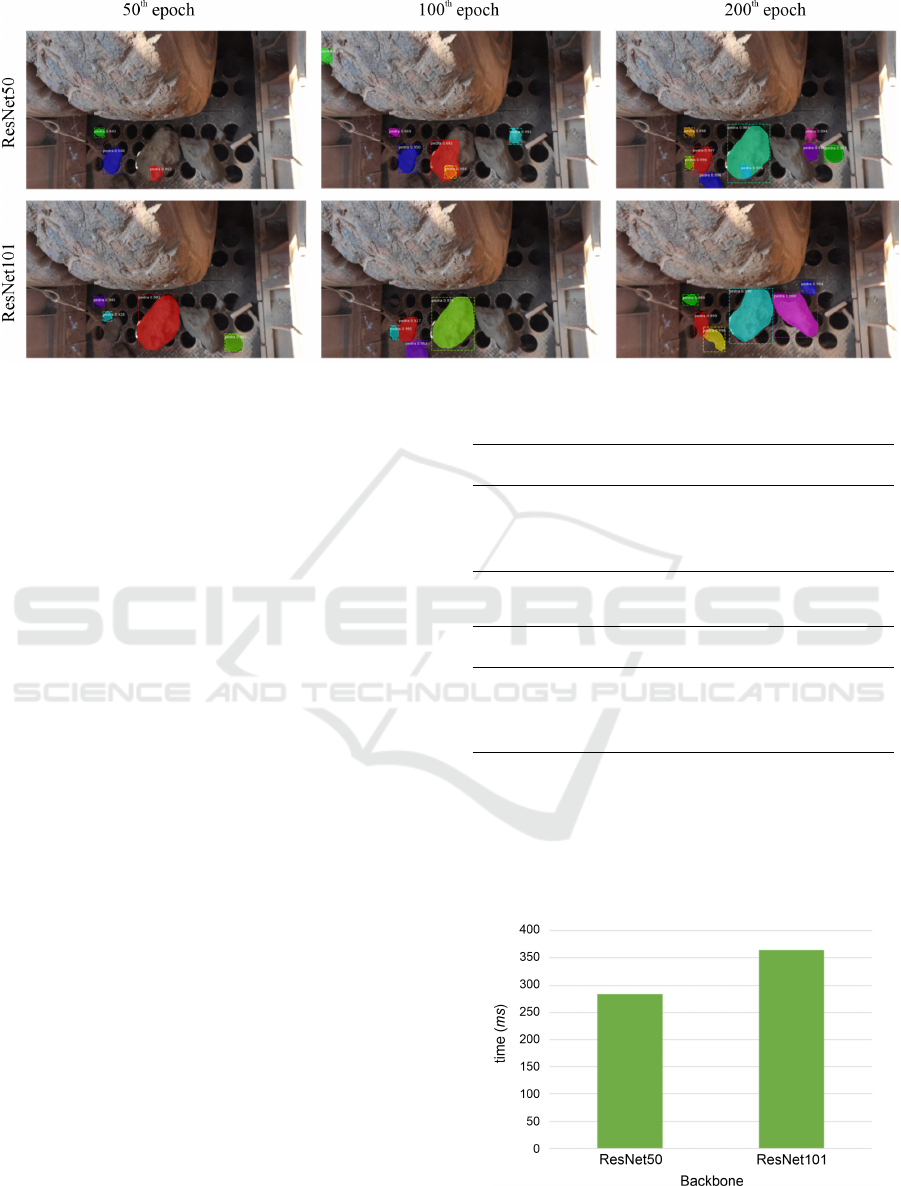
Figure 11: Segmentation performed by Mask R-CNN with ResNet50 and ResNet101.
The loss results presented in Table 3 show that
both models are nearly equivalent. Figures from 7 to
10 indicate that the total losses in the training and val-
idation phases converged without any signs of overfit-
ting or underfitting. Additionally, a reduction of ap-
proximately 20% in total losses was observed after
the 100th epoch, when all layers of the model began
training.
The model’s performance was evaluated using the
mAP metric with an IoU of 0.5, computed from a
dataset of 100 images. The results are presented in
Table 4 for the model using ResNet50 as a backbone,
and Table 5 for the model using ResNet101 as a back-
bone.
The mAP scores achieved by both models were
similarly close, with the best result achieved by the
model using ResNet50 as its backbone in the 200th
epoch.
An example of model prediction tests, conducted
at different training times and using actual images,
is presented in Figure 11. Despite the losses of
both models being very similar, the tests on actual
images revealed that the model utilizing ResNet101
as a backbone exhibited superior mask adjustment,
fewer false positives, and the ability to detect more
fragments. However, as shown in Figure 12, the
ResNet101 model has an average processing time
of around 350ms per image, whereas the ResNet50
model takes less than 300ms on average, resulting in
detection times that are 20% faster.
Souza (Souza, 2020) used several deep learning
methods, including SSD, Faster R-CNN, YOLOv3,
and U-Net, to detect and segment iron ore fragments.
Among these, U-Net achieved the best results, with a
total loss of less than 0.5 and an mAP metric close
to 0.92. However, our work demonstrated that the
Table 4: mAP metric obtained for model using ResNet50.
Epoch mAP
Precision
p(k)
Recall
r(k)
TP FP FN
50
th
0.951 0.82 0.95 437 95 23
100
th
0.947 0.90 0.93 428 45 30
150
th
0.960 0.91 0.95 438 43 21
200
th
0.962 0.92 0.96 438 38 20
Table 5: mAP metric obtained for model using ResNet101.
Epoch mAP
Precision
p(k)
Recall
r(k)
TP FP FN
50
th
0.846 0.85 0.84 383 68 75
100
th
0.917 0.91 0.91 415 39 43
150
th
0.960 0.90 0.95 437 48 21
200
th
0.961 0.93 0.95 436 33 22
Mask R-CNN algorithm outperformed the others on
the same dataset, achieving an mAP of 0.96. Figures
13a and 13b show the prediction results of U-Net and
our model, respectively. The superiority of Mask R-
CNN in bounding box accuracy and the segmentation
of iron ore particles is apparent.
Figure 12: Mean processing time per image.
ICEIS 2023 - 25th International Conference on Enterprise Information Systems
320

(a) Detection performed by Souza (Souza, 2020) using U-Net (b) Detection performed by Mask R-CNN with ResNet101
Figure 13: Comparative evaluation of results in real images.
6 CONCLUSIONS AND FUTURE
WORK
This study is a starting point towards a novel Edge
AI architecture based on cloudlets to perform particle
size detection in mineral processing plants. We pro-
posed this architecture based on the common comput-
ing infrastructure present in these plants and validated
the algorithm that performed this task.
Edge AI comes from the convergence of edge
computing methods and AI algorithms. Edge comput-
ing is usually more resource restrained than clouds,
while the latest AI algorithms are usually “resource-
hungry”. Nonetheless, there is an increasing interest
in developing solutions combining these concepts to
solve real-world problems.
We proposed using a Mask R-CNN algorithm to
detect and segment iron ore particles from Primary
Crusher System images. The method and results re-
vealed promising aspects for advancing of practical
applications for online particle size estimation in min-
eral processing plants. In a first analysis, we can high-
light some relevant points: the synthetic dataset and
Mask R-CNN’s accuracy.
The proposed dataset’s development proved fea-
sible in two aspects: agility in development and ca-
pacity dataset augmentation for training. The most
significant development of agility refers to traditional
image labelling processes, which are too exhaustive
in the face of a large amount of data necessary for
training convolutional networks.
The use of synthetic datasets in neural network
training has several advantages:
• Data Availability: synthetic datasets can be gener-
ated easily and in large quantities, even for tasks
where collecting real-world data can be challeng-
ing or expensive.
• Data Diversity: synthetic datasets can be gener-
ated to cover a wide range of scenarios, allowing
the model to generalize better to unseen data.
• Data Annotation: synthetic datasets come with
ground truth annotations, which makes it easier
to train the model and evaluate its performance.
• Data Consistency: the annotations in synthetic
datasets are consistent and free of human error,
making it easier to evaluate the model’s perfor-
mance objectively.
• Data Augmentation: synthetic datasets can be eas-
ily augmented with different variations, such as
lighting conditions, background noise, and object
deformations, allowing the model to learn from a
wider range of scenarios.
• Data Privacy: the use of synthetic datasets can
protect sensitive information, such as personal
data, that may be present in real-world datasets.
These strategy allowed generating a dataset with
10,000 synthetic images from 102 authentic images
in less than 6 hours. The results measured by mAP
metric as well as the tests on real images, indicates the
feasibility of training the model by a synthetic dataset.
The accuracy of applying the Mask R-CNN con-
sidering the mAP as a metric was 0.96. We can con-
sider a satisfactory result, considering the network’s
training in a 100% synthetic dataset. The difference
in the results presented by the evaluated backbones
(ResNet50 and ResNet101) was not significant in this
study.
To further our research, we plan to develop a new
synthetic dataset for training, considering the classi-
fication of particles in different granulometric ranges.
The objective of this new dataset is to enable the Mask
R-CNN to perform granulometric classification with-
out additional processing. We hope that further tests
will confirm our findings.
Towards a Novel Edge AI System for Particle Size Detection in Mineral Processing Plants
321

Future work will investigate the software perfor-
mance evaluation to establish the processing and stor-
age hardware requirements for edge computing archi-
tecture. Further aspects of this approach, such as in-
tegration with the process control system, depend on
the evolution of future steps mentioned.
ACKNOWLEDGMENTS
The authors would like to thank CAPES, Fapemig,
CNPq, and the Federal University of Ouro Preto for
supporting this work. Also, the authors would like to
thank Vale S/A for enabling the creation of a dataset
with real images.
This study was financed in part by the
Coordenac¸
˜
ao de Aperfeic¸oamento de Pessoal de
N
´
ıvel Superior - Brasil (CAPES) - Finance Code
001, the Conselho Nacional de Desenvolvimento
Cient
´
ıfico e Tecnol
´
ogico (CNPQ), the Instituto
Tecnol
´
ogico Vale (ITV) and the Universidade Federal
de Ouro Preto (UFOP).
REFERENCES
Al-Thyabat, S., Miles, N., and Koh, T. (2007). Estimation
of the size distribution of particles moving on a con-
veyor belt. Minerals Engineering, 20(1):72–83.
Allen, T. (2013). Particle size measurement. Springer.
Bamford, T., Esmaeili, K., and Schoellig, A. P. (2021). A
deep learning approach for rock fragmentation anal-
ysis. International Journal of Rock Mechanics and
Mining Sciences, 145:104839.
Bukharev, A., Budennyy, S., Lokhanova, O., Belozerov, B.,
and Zhukovskaya, E. (2018). The task of instance seg-
mentation of mineral grains in digital images of rock
samples (thin sections). In 2018 International Confer-
ence on Artificial Intelligence Applications and Inno-
vations (IC-AIAI), pages 18–23. IEEE.
Coetzee, L. C., Craig, I. K., and Kerrigan, E. C. (2009).
Robust nonlinear model predictive control of a run-of-
mine ore milling circuit. IEEE Transactions on con-
trol systems technology, 18(1):222–229.
de C Meira, N. F., Silva, M. C., Vieira, C. B., Souza, A.,
and Oliveira, R. A. (2022). Edge deep learning to-
wards the metallurgical industry: Improving the hy-
brid pelletized sinter (hps) process. In International
Conference on Enterprise Information Systems, pages
149–167. Springer.
Deng, S., Zhao, H., Fang, W., Yin, J., Dustdar, S., and
Zomaya, A. Y. (2020). Edge intelligence: The con-
fluence of edge computing and artificial intelligence.
IEEE Internet of Things Journal, 7(8):7457–7469.
Dong, L., Wang, H., Song, W., Xia, J., and Liu, T. (2021).
Deep sea nodule mineral image segmentation algo-
rithm based on mask r-cnn. In ACM Turing Award
Celebration Conference-China (ACM TURC 2021),
pages 278–284.
El Naqa, I. and Murphy, M. J. (2015). What is machine
learning? In machine learning in radiation oncology,
pages 3–11. Springer.
Frei, M. and Kruis, F. E. (2021). Fiber-cnn: Expand-
ing mask r-cnn to improve image-based fiber analysis.
Powder Technology, 377:974–991.
Girshick, R. (2015). Fast r-cnn. cite
arxiv:1504.08083Comment: To appear in ICCV
2015.
Guyot, O., Monredon, T., LaRosa, D., and Broussaud, A.
(2004). Visiorock, an integrated vision technology for
advanced control of comminution circuits. Minerals
Engineering, 17(11):1227–1235. Communition ’04.
He, K., Gkioxari, G., Doll
´
ar, P., and Girshick, R. (2017).
Mask r-cnn. cite arxiv:1703.06870Comment: open
source; appendix on more results.
He, K., Zhang, X., Ren, S., and Sun, J. (2015).
Deep residual learning for image recognition. cite
arxiv:1512.03385Comment: Tech report.
Huang, H., Luo, J., Tutumluer, E., Hart, J. M., and Stolba,
A. J. (2020). Automated segmentation and morpho-
logical analyses of stockpile aggregate images using
deep convolutional neural networks. Transportation
Research Record, 2674(10):285–298.
Iyas, M. R., Setiawan, N. I., and Warmada, I. W. (2020).
Mask r-cnn for rock-forming minerals identification
on petrography, case study at monterado, west kali-
mantan. In E3S Web of Conferences, volume 200,
page 06007. EDP Sciences.
Khan, W. Z., Ahmed, E., Hakak, S., Yaqoob, I., and Ahmed,
A. (2019). Edge computing: A survey. Future Gener-
ation Computer Systems, 97:219–235.
LeCun, Y., Bengio, Y., and Hinton, G. (2015). Deep learn-
ing. nature, 521(7553):436–444.
Li, E., Zeng, L., Zhou, Z., and Chen, X. (2019). Edge
ai: On-demand accelerating deep neural network in-
ference via edge computing. IEEE Transactions on
Wireless Communications, 19(1):447–457.
Lin, T.-Y., Doll
´
ar, P., Girshick, R., He, K., Hariharan, B.,
and Belongie, S. (2016). Feature pyramid networks
for object detection. cite arxiv:1612.03144.
Long, J., Shelhamer, E., and Darrell, T. (2014). Fully
convolutional networks for semantic segmentation.
cite arxiv:1411.4038Comment: to appear in CVPR
(2015).
Maxwell, A. E., Pourmohammadi, P., and Poyner, J. D.
(2020). Mapping the topographic features of mining-
related valley fills using mask r-cnn deep learning and
digital elevation data. Remote Sensing, 12(3):547.
McCarthy, J. (2007). What is artificial intelligence.
Okada, N., Maekawa, Y., Owada, N., Haga, K., Shibayama,
A., and Kawamura, Y. (2020). Automated identifica-
tion of mineral types and grain size using hyperspec-
tral imaging and deep learning for mineral processing.
Minerals, 10(9).
Ren, S., He, K., Girshick, R., and Sun, J. (2015). Faster
r-cnn: Towards real-time object detection with region
ICEIS 2023 - 25th International Conference on Enterprise Information Systems
322

proposal networks. cite arxiv:1506.01497Comment:
Extended tech report.
Shi, W. and Dustdar, S. (2016). The promise of edge com-
puting. Computer, 49(5):78–81.
Shinde, P. P. and Shah, S. (2018). A review of ma-
chine learning and deep learning applications. In
2018 Fourth international conference on computing
communication control and automation (ICCUBEA),
pages 1–6. IEEE.
Souza, L. E. R. (2020). Medic¸
˜
ao de granulometria de
min
´
erio de ferro atrav
´
es de imagens em circuito de
britagem prim
´
aria. 2020. Master’s thesis, Escola de
Minas, Universidade Federal de Ouro Preto, Ouro
Preto.
Thurley, M. J. and Ng, K. C. (2008). Identification and
sizing of the entirely visible rocks from a 3d surface
data segmentation of laboratory rock piles. Computer
Vision and Image Understanding, 111(2):170–178.
Wang, C., Chang, L., Zhao, L., and Niu, R. (2020a). Auto-
matic identification and dynamic monitoring of open-
pit mines based on improved mask r-cnn and transfer
learning. Remote Sensing, 12(21):3474.
Wang, S., Tuor, T., Salonidis, T., Leung, K. K., Makaya, C.,
He, T., and Chan, K. (2019). Adaptive federated learn-
ing in resource constrained edge computing systems.
IEEE Journal on Selected Areas in Communications,
37(6):1205–1221.
Wang, X., Han, Y., Leung, V. C., Niyato, D., Yan, X., and
Chen, X. (2020b). Edge AI: Convergence of edge com-
puting and artificial intelligence. Springer.
Wills, B. A. and Finch, J. (2015). Wills’ mineral process-
ing technology: an introduction to the practical as-
pects of ore treatment and mineral recovery, volume 8.
Butterworth-Heinemann.
Yang, D., Wang, X., Zhang, H., Yin, Z.-y., Su, D., and Xu,
J. (2021). A mask r-cnn based particle identification
for quantitative shape evaluation of granular materials.
Powder Technology, 392:296–305.
Zhang, F., Zhang, Q., Xiao, Z., Wu, J., and Liu, Y.
(2019). Spherical nanoparticle parameter measure-
ment method based on mask r-cnn segmentation and
edge fitting. In Proceedings of the 2019 8th interna-
tional conference on computing and pattern recogni-
tion, pages 205–212.
Towards a Novel Edge AI System for Particle Size Detection in Mineral Processing Plants
323
