
Analytical Model for Winter Road Maintenance Efficiency
Determination
Liva Deksne
1
, Viesturs Pavlovs
1
, Dainis Dosbergs
2
and Martins Zviedris
2
1
Dept. of Management Information Technology, Riga Technical University, Zunda krastmala 10, Riga, Latvia
2
ZZ DATS Ltd, Elizabetes street 41/43, Riga, Latvia
Keywords: Winter Road Maintenance, Cost-Efficiency Model, Data Source Sufficiency Evaluation.
Abstract: Analytical model to increase the Winter Road Maintenance (WRM) cost-efficiency has been developed. It
supports the planned WRM decision-support system and is a crucial element to plan, develop and maintain a
cost-efficient WRM system. The model emphasizes the indirect costs of WRM, and the importance level of
data sources used to define winter road conditions in a certain area. Multiple measurements of data provided
by data sources are carried out and are used as the main WRM cost-influencing factor. The model determines
steps and guidelines for the calculation of the WRM costs and the impact of data sources used to define road
and driving conditions.
1 INTRODUCTION
A decision support system for winter road
maintenance (WRM) is crucial to determine road and
driving conditions through data retrieval from real-
time sources. The use of Intelligent Transportation
Systems (ITS) in WRM has been adopted globally,
with various application methods being employed
(Deksne et al., 2021, October). To ensure valuable
information is provided, a capability-based WRM data
ecosystem has been designed (Deksne et al., 2021),
connecting both standard and non-standard data
sources from different stakeholders.
The decision-making process in WRM is heavily
reliant on the data obtained from sources, which
makes the sufficiency and reliability of the data
critical factors. Improper determination of road
conditions can lead to an increase in WRM costs due
to inefficient operations, and an analytical model of
winter road maintenance efficiency has been designed
to consider the impact of data sources based on
parameters such as data completeness, availability,
and variety (Deksne et al., 2021).
The objective of this paper is to develop an
analytical cost-efficiency model that evaluates the
importance of data sources in WRM decision-making
and assesses their reliability.
2 BACKGROUND
This research is part of an industry-sponsored project
aimed at developing an integrated decision-support
ERP system for WRM. The proposed system is based
on a data ecosystem that allows for data sharing
between parties to form valuable information. The
capability-based ecosystem model (Grabis et al.,
2022) is used to design the system's capabilities,
ensuring that business goals are met (Deksne et al.,
2021, September). The availability of timely
information is critical to WRM operations, and a
decision-support system that retrieves data from
various sources can increase WRM efficiency.
The architecture and technology selection of the
proposed system have been described in Deksne et al.
(2021, October). The main components of the
architecture include a data ingest framework, a
decision-making and interpretation module, and an
adjustment module. Additional services such as data
sharing, archiving, visualization, performance
indicator measurement, and knowledge management
will also be provided.
A rules engine, developed in close collaboration
with WRM field experts in Latvia (Jokste et al., 2022),
will be used to determine the road and weather
condition rules that trigger necessary WRM actions
based on retrieved data. The analytical cost-efficiency
model is a part of the proposed decision-support
Deksne, L., Pavlovs, V., Dosbergs, D. and Zviedris, M.
Analytical Model for Winter Road Maintenance Efficiency Determination.
DOI: 10.5220/0011761200003479
In Proceedings of the 9th International Conference on Vehicle Technology and Intelligent Transport Systems (VEHITS 2023), pages 171-178
ISBN: 978-989-758-652-1; ISSN: 2184-495X
Copyright
c
2023 by SCITEPRESS – Science and Technology Publications, Lda. Under CC license (CC BY-NC-ND 4.0)
171

2
system, enabling the evaluation of data sources used
in WRM decision-making and the assessment of
potential risks to increase cost-efficiency.
3 MODEL
3.1 Road Maintenance Costs
The direct costs of WRM are incurred from various
factors such as anti-slip material use and snow
removal activities, and are often calculated based on
the road distance traveled. However, direct WRM
expenses should not be considered the only measure
of total WRM expenses, as public interests and
macroeconomic goals must be considered in
increasing cost-efficiency of WRM services.
Ratkevicius et al. (2017) designed an economic effect
model of WRM that compares direct expenses with
societal expenses such as vehicle expenses, road
accidents, and travel time expenses, as well as
environmental expenses affecting the economic
effect.
The main goal of WRM is to provide safe driving
conditions by reducing the risks of inappropriate road
conditions caused by snow and ice. These risks should
be considered as indirect costs of WRM in
determining overall cost-effectiveness.
The relationship between weather conditions and
road accidents has been widely studied, with Bergel-
Hayat et al. (2013) reporting a correlation between
temperature and the number of injury accidents and
Malin et al. (2019) reporting a relative accident risk
more than two times higher in the case of snowfall
compared to weather conditions such us rain, sleet,
and no precipitation. Theofilatos et al. (2014) have
investigated more studies that have discovered a link
between traffic, weather conditions, and road safety.
Considering accident and speed reduction risks as
risks that correlate with weather and road conditions,
costs of these risks need to be included in the total cost
equation for a specific road section (1).
𝐶
𝐴𝐶
𝑆𝑅𝐶
𝐷𝑀𝐶
(1)
where 𝐶
– road section MN costs, where M is the road section
start point, and N – the endpoint,
𝐴𝐶
– accident costs of the road section MN,
𝑆𝑅𝐶
– speed reduction costs of the road section MN,
𝐷𝑀𝐶
- direct maintenance costs of the road section MN.
The total cost of WRM for a given road section (1)
is influenced by several factors, including the number
of accidents, traffic volume, and availability of data
sources. The availability of timely information on
weather and road conditions is crucial for WRM
service providers, as it enables them to make informed
decisions that can minimize the number of accidents
and reduce speed reduction costs. A prompt response
time and appropriate selection of WRM activities are
critical for ensuring an efficient maintenance process.
As a result, it is necessary to evaluate the data sources
used to assess their impact on cost-effectiveness.
The accuracy of information obtained about the
WRM actions required is influenced by the attributes
related to data source evaluation. Inaccurate
information can result in repeated maintenance work
for the same road section and inefficient decision-
making regarding driving routes, leading to increased
total travel distance for the service vehicle and thus
higher maintenance costs.
3.2 Road Accident Costs
The costs of road accidents have been widely analyzed
in previous studies. Salli et al. (2008) studied the
impact of different winter road conditions on accident
risk in passenger car traffic and found that the accident
risk for accidents resulting in physical damage or
injuries was 4.1 times greater on snowy or icy roads
compared to bare roads. Norrman et al. (2000)
established quantitative relationships between road
slipperiness, accident risk, and WRM activities.
Authors have reported accident risk for each type of
classified slipperiness level (2). The accident rate was
divided by the expected number of accidents,
assuming that all accidents in a month occurred
evenly.
𝐴
∑
𝐴
,
ℎ
𝐴
ℎ
,
(2)
where 𝐴
– accident risk for the road slipperiness type,
𝐴
,
– the number of accidents slipperiness type t, month
m,
ℎ – number of hours,
𝑁 – number of months.
Minimizing accident risk during winter by
reducing road slipperiness requires timely and
accurate information on weather and road conditions.
Accident costs, which are used as input in the cost-
efficiency model, are influenced by the available
information from data sources. The potential accident
costs increase when information on road conditions is
not available and decrease when it is available in a
timely manner. Other factors such as road pavement
type, driving speed, and tire quality can also contribute
to road accidents, but they are not analyzed in this
research with a focus on the WRM domain.
As reported by Partheeban et al. (2008), accident
costs can be used to calculate the expenditure on road
safety management and assess the impact of road
VEHITS 2023 - 9th International Conference on Vehicle Technology and Intelligent Transport Systems
172
safety improvements in an economic manner.
Different methods have been applied in previous
studies to calculate accident costs, which range from
0.5% to 5.7% of the gross national product, as reported
by Elvik (2000). Silcock et al. (2003) defined cost
components for calculating the cost of road crashes,
and Bougna et al. (2021) and the World Bank (2021)
described the main methodologies used to calculate
road accident costs, including restitution costs, human
capital, and willingness to pay.
Wijnen et al. (2016) analyzed the estimates of
social costs of road crashes in several countries, where
costs are calculated as a proportion of the gross
domestic product (GDP). Direct and indirect accident
costs have been studied, with total accident costs
defined by Partheeban et al. (2008) as the sum of
hospital expenses, future consumption costs in the
case of a fatal accident, gross loss of future output,
vehicle damage costs, and others. Accident costs are
mainly calculated as losses for the economy, as in the
case of fatal road accidents, those individuals cannot
contribute to the state's economy. Direct costs include
those incurred by vehicle owners, road exploitation
services, medical institutions, and the cost of road
accident investigation, while indirect costs cause a
subsequent negative impact but cannot be directly
calculated.
Wijnen et al. (2017) found that the total costs of
crashes vary between 0.4% and 4.1% of GDP due to
the different methodologies used and cost components
calculated for different countries that may not be in
accordance with international guidelines. The Latvian
Road Safety Directorate performed a cost-benefit
analysis to evaluate the effectiveness of road safety
improvement measures and found that the average
costs of road accidents without victims were 2215.78
EUR, while in the case of fatal road accidents, they
were 40457.29 EUR (2021). Most accidents in Latvia
occurred in cities or on main roads connecting cities.
(CAIS)
3.3 Impact of Data Sources
The proposed WRM decision-support system aims to
process various types of data from multiple sources in
order to enhance the efficiency of WRM operations.
The quality of each data source is assessed based on
indicators such as accuracy, timeliness, credibility,
and accessibility. These indicators are used to measure
the quality of each data source and thus determine its
importance. Not all data sources are equally important
when calculating necessary weather and road
conditions to generate tasks for WRM (Jokste et al.,
2022). Poor usage of data sources and low-quality
levels of data can increase maintenance costs because
necessary information will not be available in order to
perform WRM, which will result in inefficient WRM
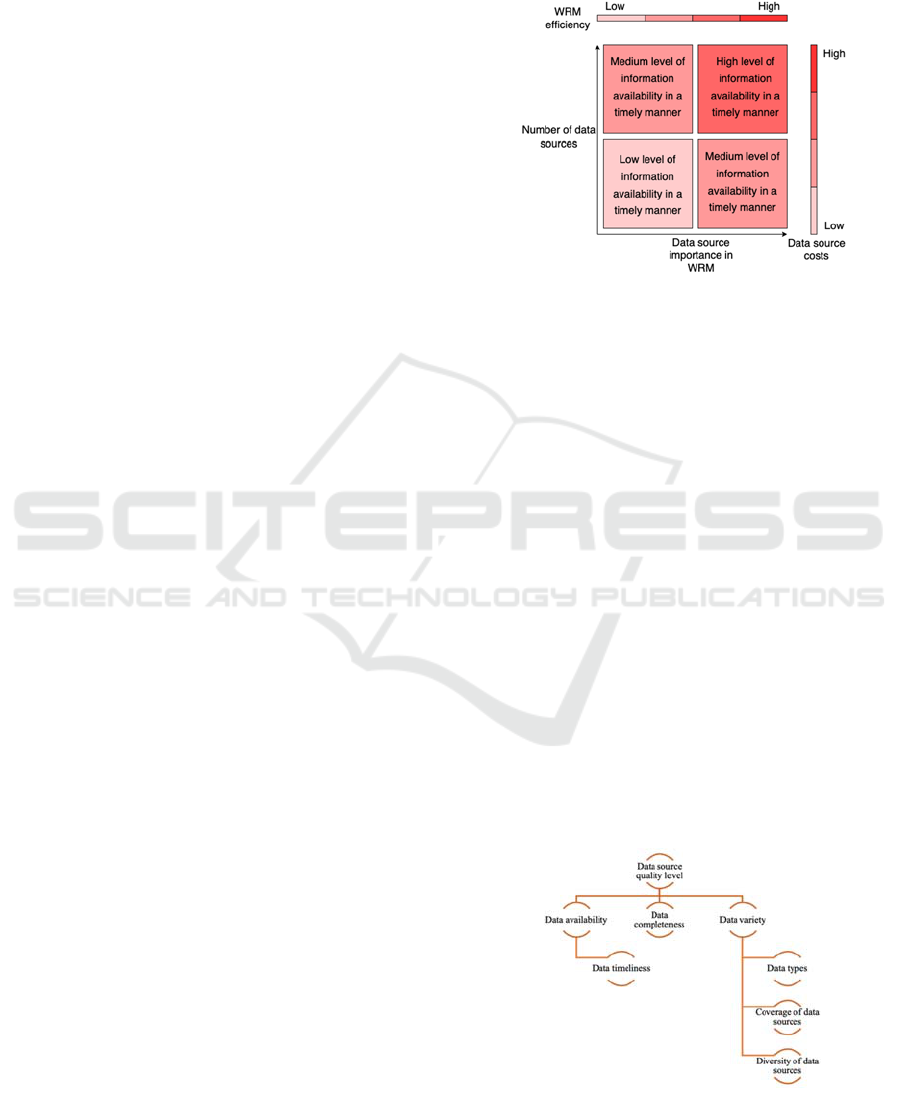
service and can increase accident risks (Fig. 1).
Figure 1: Impact of data sources and their importance.
The number and importance of data sources in
terms of their ability to describe relevant weather and
road conditions play a crucial role in determining
overall WRM efficiency (Fig. 1). The use of open data
and semi-open data sources, which are owned by
third-party companies, may increase the cost of data
sources.
It is necessary to evaluate the importance and
impact of data sources by considering road and
weather conditions to minimize data costs.
Furthermore, defining the importance of data sources
can assist WRM decision-makers in making informed
decisions regarding their usage and increasing the
number of data sources in areas where the risk of poor
quality or insufficient data is high.
The availability, completeness, and variety of data
are factors that affect the total maintenance costs and
WRM efficiency. Timeliness of road and weather
information is essential for effective WRM operations
and reducing accident risks. Data quality needs to be
evaluated to determine the reliability and importance
of each data source (Fig. 2).
Figure 2: Data quality and its indicators.
Analytical Model for Winter Road Maintenance Efficiency Determination
173

4
Data availability is determined by the time interval
after which necessary data is received and ready for
use. Given that road and weather conditions can
change rapidly, it is crucial to have timely access to
data to perform WRM activities effectively. Data
completeness refers to the validity of collected data
and its ability to provide reliable information to
decision-makers. Data variety is evaluated based on
the types of data, coverage of data sources, and
diversity of data sources. The importance of different
data types is determined by assigning weights to their
relevance in setting defined rules and context
elements. The coverage of data sources describes their
availability in a specific geographical location, while
the diversity of data sources minimizes the risk of data
unavailability or insufficiency and enhances accuracy.
4 APPLICATION
A specific section of road has been selected for the
purpose of calculating the costs associated with
WRM. This calculation involves determining the
direct maintenance costs, potential accident costs, and
the significance of data sources. The data used for this
calculation is obtained from meteorological and video
cameras operated by the Latvian State Road. The
significance of the data sources and the level of road
slipperiness are calculated based on the data received
from the two available meteorological stations. The
data period for this calculation is one month,
specifically December 2021. The chosen road section
has been precisely defined and the data from both
meteorological stations, provided by the Latvian State
Roads, is utilized to calculate the level of slipperiness
in the road and to determine the potential risk of an
accident.
4.1 Direct maintenance
The direct road maintenance costs are determined by
WRM service companies based on the extent of
cleared roads and the distance traveled. Therefore,
these costs are not included in the present study.
However, the planned WRM decision-support system
will enable the analysis of direct costs and ensure their
efficiency. Additionally, the analytical model will
facilitate the reduction of direct costs as outlined in
Section 3.
4.2 Accident Costs
Accident costs are considered as one of the metrics to
calculate the total WRM costs (1). There are numerous
factors that influence the number of accidents,
including road conditions and human behavior.
However, in this study, only the type of road
slipperiness is used to determine the weather-related
accident costs. The primary objective of calculating
the accident costs is to evaluate the cost-benefit in the
event that the accident risk is reduced. The type of
slipperiness is the main variable. The road slipperiness
types, the cost per road accident, and the location of
the road section are attributes that affect the outcome
(Fig. 3).
Figure 3: Inputs and outputs calculating potential road
accident costs and expected number of slipperiness type.
Table 1: Expected accident costs per slipperiness type for
the given case.
Slipperiness
type
Accident
risk
Slipperiness
hours, h
Expected
number of
accidents
Expected
accident
costs, EUR
Type 1
11,6 0
0,00
0,00
Type 2
6,1 114
10,62
13997,17
Type 3
3,4 14
0,72
958,10
Type 4
6,4 0
0,00
0,00
Type 5
1,5 22
0,50
664,23
Type 6
3,2 20
0,97
1288,21
Type 7
2,5 0
0,00
0,00
Type 8
4,5 0
0,00
0,00
N
on-slippery
0,7 573
6,1
8073,43
To calculate the road accident costs, the following
steps are defined:
Step 1 – The accident risk defined by Norrman et al.
(2000) is employed to describe the number of times
the average number of accidents is expected in T-
slipperiness conditions in comparison to the average
number of accidents estimated for all types of
slipperiness.
Step 2: Historical accident data (CAIS) is used to
calculate the average number of accidents per hour.
Step 3: The average number of fixed T-slipperiness
hours per month is calculated based on the rules
defined by Norrman et al. (2000).
VEHITS 2023 - 9th International Conference on Vehicle Technology and Intelligent Transport Systems
174

Step 4: The average number of accidents per month in
T-slipperiness conditions on the road section MN is
calculated.
Step 5: The average accident costs, based on research
conducted by the Latvian Road Safety Directorate, are
used to determine the average accident costs.
Step 6: The expected average road accident costs for
the road section due to the road slipperiness are
calculated (Table 1).
4.3 Impact of Data Sources
Multiple methods are employed to assign data
importance weights, which serve to determine the
quality of the data and its source. The expert
evaluation method is utilized to assign categories of
importance and weights for Data Availability, Data
Completeness, Coverage of Data Sources, and
Diversity of Data Sources. Field experts with
extensive experience in WRM decision-making and
operations planning in Latvia participated in this
evaluation. The machine learning method is utilized to
assign weights for data variety, while the best scenario
method is employed to determine the necessary
conditions for minimizing data risk and to inform
decision-making related to road, driving, and weather
conditions.
The importance weights are used to identify the
ideal scenario for utilizing data sources to produce
valuable information for a specific road section. If the
data is not readily available, or if its quality is low, the
risk of inaccurate information increases, leading to
inefficient WRM decision-making. The determination
of data risk levels provides opportunities to identify
strategies for reducing risk by improving data quality.
Data availability importance weights reflect the
accessibility of a specific data source and the
importance of its timeliness. For example, a higher
weight is assigned to data that is updated less
frequently than every 10 minutes, as this is considered
the most suitable frequency for accurately defining
weather and road conditions in close to real-time. The
availability levels of data sources are calculated for
each road section and determined by WRM field
experts. Data is considered highly available if its
timeliness is less than 10 minutes, medium-high if it
falls between 10 and 20 minutes, medium-low if it
falls between 20 and 60 minutes, and low if its
timeliness exceeds 60 minutes.
The machine learning method is utilized to
determine the importance of each data type for
creating a context element based on predefined rules
(Jokste et al., 2022). The data ecosystem model
(Deksne et al, 2021, September) includes measurable
properties that are used to generate valuable
information about road conditions, and historical data
is necessary to train the model and determine the
importance of these properties. Measurable properties
are included in the model to establish the confidence
level for each cascade (Fig. 4). The maximum
confidence level identifies the best scenario for
utilizing measurable properties to determine the
context element.
Figure 4: Machine learning cascade to define the importance
of measurable properties setting context element.
The objective of the machine learning model cascades
is to identify the set of measurable properties that offer
the greatest accuracy level. This serves as the best case
scenario for determining if the data types used in the
calculation of the context element for a specific road
section are of sufficient quality to reduce the risk of
data insufficiency. The machine learning approach is
used to assign importance weights to different data
types, allowing for the evaluation of the significance
of the data sources used. The model is trained using a
training data set provided by the Latvian State Roads
data ecosystem party, utilizing the XGBoost machine
learning algorithm.
Two model cascades are implemented, the first of
which is trained using meteorological station data.
The variables included in the model are selected based
on the rules established by the Rules Engine (Jokste et
al. (2022)). The second cascade encompasses the same
variables as well as video data.
The importance weights and accuracy levels
generated by the model are utilized as constants in the
algorithm, although further calibration may be
necessary when more training data becomes available.
Furthermore, as new data sources become available in
the future stages of the platform's implementation,
additional cascades may be established to
accommodate the expanded data availability.
Analytical Model for Winter Road Maintenance Efficiency Determination
175
6
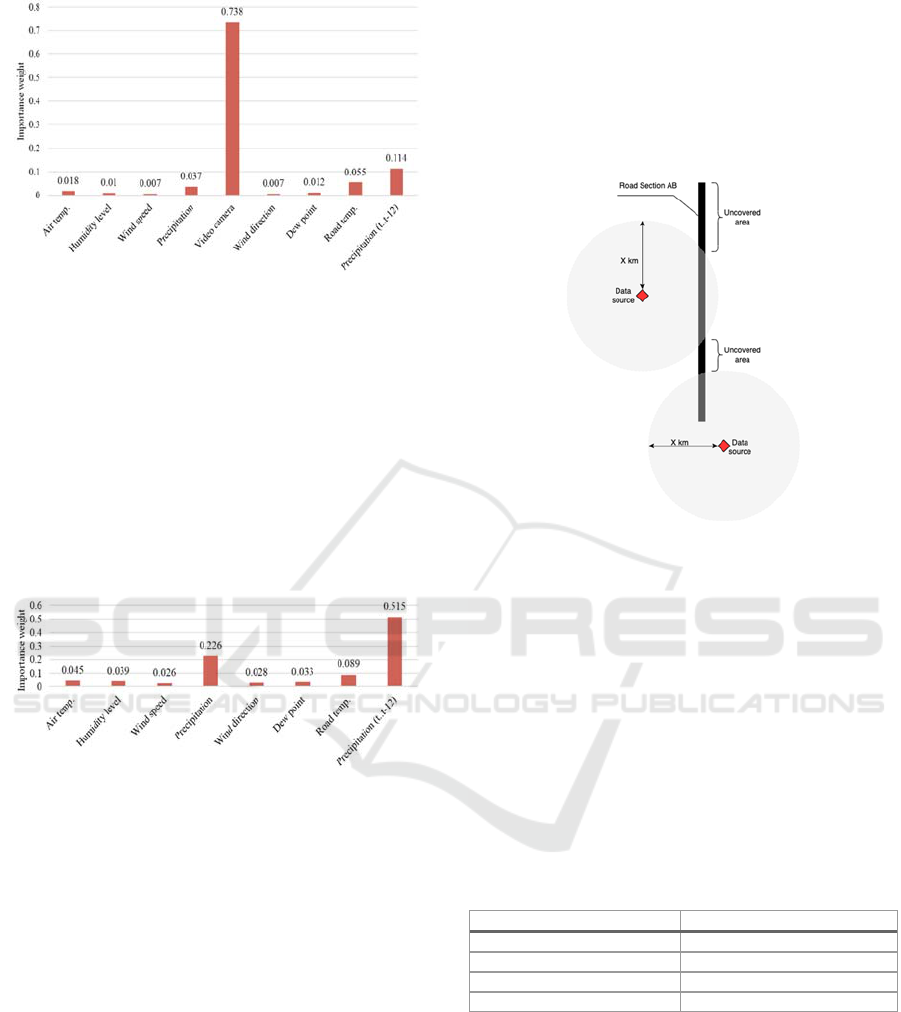
Figure 5: Importance weights set by machine learning
model.
The results of the machine learning model when using
meteorological station data and video camera data
(Fig. 5) indicate that video cameras are the most
critical data source in determining road conditions.
Additionally, the importance weights were calculated
in the scenario where only meteorological station data
is used (Fig. 6), and in this case, the actual
precipitation and precipitation from the previous 12
periods were found to have the highest impact on road
condition determination.
Figure 6: Importance weights set by machine learning
model.
The accuracy level for various attribute
combinations was calculated using a machine learning
model. A total of 511 combinations were formed, with
the highest accuracy achieved by combining the
following attributes: air temperature, air humidity
level, wind speed, video camera, dew point, road
temperature, and precipitation (t-1 to t-12). To
determine the importance and accuracy levels of the
specific data sources used to assess road conditions for
a given road section, they are compared to the best-
case scenario, which is the maximum output of the
machine learning model.
The level of data completeness is calculated by
evaluating the data obtained from sources used to
create context elements for a specific road section.
Incomplete data, anomalies, and errors can affect the
data reliability of a data source.
The coverage area defines the maximum region in
which data sources are deemed appropriate for
determining road and weather conditions for a specific
road section. To calculate the road area without
coverage (Fig. 7), the WRM experts first define the
reliable information coverage radius of the data
source, then the coverage is calculated.
Figure 7: Road area data coverage for the given road section.
The coverage area is simulated for all data sources
within a designated area and is contingent on the
distance between the road section and the data
sources. This information can be used to measure the
length of the uncovered road section and identify the
risk level, indicating if additional data sources should
be taken into consideration to determine road
conditions for a given road section. Additional
coverage levels, defined by WRM experts, indicate
the extent to which the data obtained from available
sources covers the necessary road section area (Table
2).
Table 2: Coverage levels of data sources.
Coverage of data sources Coverage level
70 - 100% High coverage level
50
–
70% Medium high coverage level
30
–
70% Medium low coverage level
Less than 30% Low coverage level
The coverage of data sources for a particular road
section is calculated based on the maximum distance
of 10 km from the data source to the road section
which is deemed a reliable source for weather and
road condition data by WRM experts.
The diversity of data sources is assessed through a
best-case scenario where data from meteorological
stations, video cameras, and crowd-sourced
applications is used to determine the road and weather
conditions for a specific road segment. The three main
VEHITS 2023 - 9th International Conference on Vehicle Technology and Intelligent Transport Systems
176

data source types are distinguished due to their
differing methods of processing and data capture:
meteorological stations use sensor-based data capture,
video cameras employ visual data capture for image
recognition road condition evaluation, and crowd-
sourced applications provide real-time data from
dynamic locations regarding road conditions.
5 RESULTS AND CONCLUSION
An analytical cost-efficiency model has been
developed to assess the data source availability and the
associated risks due to data insufficiency. The
emphasis on data availability as a crucial factor in
minimizing risk and maintenance costs has been
established as the main objective in increasing the
cost-efficiency of the WRM. The calculation of
accident risks based on road slipperiness types also
serves as an evaluation factor in WRM efficiency.
In collaboration with WRM field experts in Latvia,
various levels of data source-specific attribute values
have been established to enable the assessment of data
sources from the WRM perspective. This information
can be utilized to determine the need for additional
data sources to minimize data insufficiency risks and
potential accident risks and maintenance costs for a
specific road section.
The specific case was used to calculate the
different aspects of data insufficiency and accident
risks, with the results presented in Table 3.
Table 3: Calculation results of the given case.
Measure The given case results
Potential accident risk
level
(Table 1)
Potential accident costs 16
907,22 EUR
Data availability Medium-low level of data availability
Data types Medium level of data type accuracy
High level of data type importance
Data completeness 83,33%
Data source coverage High coverage level
Diversity of data sources Low level of diversity
Both expert evaluation and machine learning were
employed to set the output levels for the data source
evaluation criteria, with the latter determining the
weights of data type accuracy and importance.
However, the machine learning model requires further
training and data collection to increase its accuracy.
The results provide the option to evaluate the
available information for a given road section and
prioritize maintenance processes based on potential
accident costs. The quality of available data and data
sources is significant in WRM as decisions strongly
rely on timely accessible information. The introduced
model allows the determination of data source impact
to reduce WRM risks and costs. WRM expert
assessment is utilized to set the expected levels of
different data sufficiency measurements from the
WRM viewpoint, with calibrations made as necessary
when actual data is used over an extended period.
ACKNOWLEDGMENT
This research is funded by European Regional
Development Fund Project Nr.1.1.1.1/20/A/053
“IWiRoM: Development of a new type of Intelligent
Winter Road Maintenance information system and
ERP integration solution for improving efficiency of
maintenance processes” Specific Objective 1.1.1
“Improve research and innovation capacity and the
ability of Latvian research institutions to attract
external funding, by investing in human capital and
infrastructure” 1.1.1.1. measure “Support for applied
research” (round No.4)
REFERENCES
Bergel-Hayat, R., Debbarh, M., Antoniou, C., Yannis, G.
(2013). Explaining the road accident risk: Weather
effects, Accident Analysis & Prevention, vol. 60, pp.
456-465, ISSN 0001-4575, doi: https://doi.org/10.1016/
j.aap.2013.03.006. https://www.sciencedirect.com/
science/article/pii/S0001457513000948
Bougna, T., Hundal, G., & Taniform, P. (2021). Quantitative
analysis of the social costs of road traffic crashes
literature. Accident Analysis & Prevention, 106282. doi:
https://doi.org/10.1016/j.aap.2021.106282
CAIS, A tool for the analysis of the scene of traffic
accidents, violations and crimes in the field of traffic.
Ministry of Internal Affairs of Latvia. Available:
http://gis.ic.iem.gov.lv/giswebcais/
Deksne, L., Grabis, J., & Žeiris, E. (2021, September).
Towards Data Ecosystem Based Winter Road
Maintenance ERP System. In International Conference
on Business Informatics Research (pp. 69-83). Springer,
Cham.
Deksne, L., Vempers, J., & Kampars, J. (2021, October).
Technology Selection for Development of Intellectual
Road Maintenance Platform. In 2021 62nd International
Scientific Conference on Information Technology and
Management Science of Riga Technical University
(ITMS) (pp. 1-9). IEEE.
Elvik, R. (2000). How much do road accidents cost the
national economy?. Accident Analysis & Prevention,
32(6), 849-851.
Grabis, J., Deksne, L., Roponena, E., & Stirna, J. (2022). A
Capability-Based Method for Modeling Resilient Data
Analytical Model for Winter Road Maintenance Efficiency Determination
177

8
Ecosystems. In Domain-Specific Conceptual Modeling
(pp. 339-363). Springer, Cham.
Jokste, L., Jeļisevs, B., Dosbergs, D., Zviedris, M. (2022)
Formalization and Automated Enactment of Winter
Road Maintenance Regulatory Requirements.
Latvian Road Safety Directorate. Road Traffic Accidents.
Damage caused to the state as a result of road traffic
accidents [Online]. Available: https://www.csdd.lv/
celu-satiksmes-negadijumi/celu-satiksmes-negadijumu-
rezultata-valstij-raditie-zaudejumi
Malin, F., Norros, I., Innamaa, S. (2019). Accident risk of
road and weather conditions on different road types.
Accident Analysis & Prevention, vol. 122, pp. 181-188,
ISSN 0001-4575, doi: https://doi.org/10.1016/j.aap.
2018.10.014.https://www.sciencedirect.com/science/art
icle/pii/S0001457518308455
Norrman, J. (2000). Slipperiness on roads – an expert system
classification. Meteorological application, 7(1), 27 –
36.
Norrman, J., Erikkson, M., Lindqvist, S. (2000).
Relationships between road slipperiness, traffic accident
risk and winter road maintenance activity. Climate
Research, 15(3), 185-193. https://www.int-res.com/
abstracts/cr/v15/n3/p185-193/
Partheeban, P., Arunbabu, E., & Hemamalini, R. R. (2008).
Road accident cost prediction model using systems
dynamics approach. Transport, 23(1), 59-66.
Ratkevicius, T., Laurinavicius, A. (2017). Assessment
model of levels for winter road maintenance. The Baltic
Journal of Road and Bridge Engineering. https://bjrbe-
journals.rtu.lv/article/download/bjrbe.2017.15/1783
Salli, R., Lintusaari, M., Tiikkaja, H., & Pöllänen, M.
(2008). Wintertime road conditions and accident risks in
passenger car traffic. TUTKIMUSRAPORTTI,
RESEARCH REPORT, (68).
Silcock, R., TRL (2003). Guidelines for estimating the cost
of road crashes in developing countries. London:
Department for International Development. The World
Bank
The World Bank (2021). Socio-Economic Costs and Human
Impacts of Road Accidents in Azerbaijan. URI:
http://hdl.handle.net/10986/35986
Theofilatos, A., Yannis, G. (2014). A review of the effect of
traffic and weather characteristics on road safety.
Accident Analysis & Prevention, vol. 72, pp. 244-256,
ISSN 0001-4575, doi: https://doi.org/10.1016/j.
aap.2014.06.017.
Wijnen, W., & Stipdonk, H. (2016). Social costs of road
crashes: An international analysis. Accident Analysis &
Prevention, 94, 97-106. doi: http://dx.doi.
org/10.1016/j.aap.2016.05.005
VEHITS 2023 - 9th International Conference on Vehicle Technology and Intelligent Transport Systems
178
