
Probability Distribution as an Input to Machine Learning Tasks
Karel Macek
1 a
, Nicholas
ˇ
Capek
1 b
and Nikola Pajerov
´
a
2 c
1
AI Center of Excellence, Generali
ˇ
Cesk
´
a poji
ˇ
s
ˇ
tovna, Na Pankr
´
aci 1720, Prague, Czechia
2
Department of Technical Mathematics, Faculty of Mechanical Engineering, CTU, Resslova 307, Prague, Czechia
Keywords:
Machine Learning, Classification, Regression, Random Sample, Vectorization, Image Similarity, Hip Bone,
3D Scans.
Abstract:
Machine Learning has been working with various inputs, including multimedia or graphs. Some practical
applications motivate using unordered sets considered to be samples from a probability distribution. These
sets might be significant in size and not fixed in length. Standard sequence models do not seem appropriate
since the order does not play any role. The present work examines four alternative transformations of these
inputs into fixed-length vectors. This paper demonstrates the approach in two case studies. In the first one,
pairs of scans as coming from the same document based were classified on the distribution of lengths between
the reference points. In the second one, the person’s age based on the distribution of D1 characteristics of the
3D scan of their hip bones was predicted.
1 INTRODUCTION
Supervised machine learning has been the most fruit-
ful application of artificial intelligence in regression
and classification tasks where some input is modeled
to predict a quantity or a class, respectively. Both ma-
chine learning practice and theory worked not only
with vectors of numbers but also (time) series (Ahmed
et al., 2010), multimedia (Camastra and Vinciarelli,
2015), graph (Chami et al., 2022). This article dis-
cusses the possibility of using a set of measurements
as input from a probability distribution. The follow-
ing examples motivate the topic:
• To model the Gross Domestic Product of a coun-
try based on the age structure of its population.
• To identify the type of production machinery’s
fault based on the distribution of produced prod-
uct deviations.
• To model a person’s age based on the distribution
of all points coming from a 3D scan (Kot
ˇ
erov
´
a
et al., 2018).
• To predict if two images are the same or not -
based on the distribution of distances among the
pairs of identified reference points (
ˇ
Capek, 2022).
a
https://orcid.org/0000-0002-3914-447X
b
https://orcid.org/0000-0002-8513-9540
c
https://orcid.org/0000-0002-7515-3082
According to our knowledge, only a few publica-
tions examined the possibility of using a set of mea-
surements from a probability distribution as an input.
For example, the authors of (Vinyals et al., 2015) deal
with unordered data sets as input for Machine Learn-
ing. However, they narrowly focused on sequence-
to-sequence mapping and only restricted to Recurrent
Neural Networks.
This article provides a general approach to using
samples from record-specific probability distribution
as input to machine learning tasks. First, we start with
the formal problem definition in Section 2. Then,
Section 3 proposes the methods to solve it that are
demonstrated in two case studies in Section 4 and 5.
Finally, Section 6 concludes the article.
2 PROBLEM STATEMENT
2.1 Supervised Machine Learning
Problems
The supervised machine learning can be concisely
formulated as optimization of parameters of a model
to minimize the prediction error on the training data
set (Murphy, 2012, page 179).
More formally, we assume a model
p(y|x, θ)
Macek, K.,
ˇ
Capek, N. and Pajerová, N.
Probability Distribution as an Input to Machine Learning Tasks.
DOI: 10.5220/0011766500003467
In Proceedings of the 25th International Conference on Enterprise Information Systems (ICEIS 2023) - Volume 1, pages 123-129
ISBN: 978-989-758-648-4; ISSN: 2184-4992
Copyright
c
2023 by SCITEPRESS – Science and Technology Publications, Lda. Under CC license (CC BY-NC-ND 4.0)
123

and a training set of input-output pairs (x
i
, y
i
) where
x
i
∈ R
n
and
• for binary classification y
i
∈ {0, 1} for i =
1, 2, . . . , m
• and for regression y
i
∈ R for i = 1, 2, . . . , m.
The goal of supervised machine learning is to find
such a parameter θ that the model predicts based on
the available x the output y as precisely as possible:
in our experiments, accuracy for binary classification
and mean absolute percentage error were considered.
2.2 Distributional Input
This article addresses a related, yet different problem:
x
i
is not a vector but a sample from a probability dis-
tribution. Therefore, it has not a fixed length, and the
order does not matter, thus x
i
= {x
i,1
, x
i,2
, . . . , x
i,n
i
},
where n
i
is the number of observations for record i.
No additional assumptions on the distribution and
the proposed approaches expect only the fact that the
input has the above-described properties, i.e., it is an
unordered set of numbers.
3 METHODOLOGY
The methodology combines suitable informative vec-
torization, i.e., the transformation of the sets of mea-
surements x
i
for i = 1, . . . , m into vectors. Subse-
quently, this vectorized representation can work with
standard machine learning models and related evalu-
ation mechanisms.
3.1 Vectorization Approaches
Thus, we need to transform the sets of observations x
i
to a fixed-length summary. We propose four alterna-
tive ways.
3.1.1 Mean Only Vectorization
In this case, we calculate only the empirical mean of
observations for each record:
z
avg
i
=
"
1
n
i
n
i
∑
j=1
x
i, j
#
(1)
The vectorization is one-dimensional. We will use it
as a dummy benchmark to indicate that taking the av-
erage only implies a loss of discriminative informa-
tion in the raw data.
3.1.2 Vectorization Based on Empirical Statistics
An extension of the previous approach is to calculate
more than one statistic. We consider:
• mean ˆµ(x
i
),
• standard deviation
ˆ
σ(x
i
),
• variance
ˆ
σ
2
(x
i
),
• minimum min x
i
,
• maximum max x
i
,
• sum
∑
x
i
,
• kurtosis
d
Kurt(x
i
),
• skewness
[
skew(x
i
),
• and quantiles for levels 10%,
25%, 50%, 75%, and 90% , i.e.
ˆq
.1
(x
i
), ˆq
.25
(x
i
), ˆq
.5
(x
i
), ˆq
.75
(x
i
), ˆq
.9
(x
i
).
We represent these values as the following vector:
z
stats
i
=
ˆµ(x
i
),
ˆ
σ(x
i
),
ˆ
σ
2
(x
i
), minx
i
, maxx
i
,
∑
x
i
,
d
Kurt(x
i
),
[
skew(x
i
),
ˆq
.1
(x
i
), ˆq
.25
(x
i
), ˆq
.5
(x
i
), ˆq
.75
(x
i
), ˆq
.9
(x
i
)] (2)
3.1.3 Binning Vectorization
Another way to represent the distribution in a fixed
length form is binning, for example, in (Kot
ˇ
erov
´
a
et al., 2018). We define the number of observations in
a bin like n
k
(x
i
) = #
x
i, j
|l
k
≤ x
i, j
< u
k
where l
k
, u
k
are lower and upper bound of a bin, respectively, and
k denotes the bin’s number k = 1, . . . , K.
z
bin
i
= [n
k
(x
i
)]
K
k=1
(3)
We propose the quantile-based approach for defin-
ing the bins, i.e., the data set x
i
= {x
i, j
} cut based on
quantiles.
3.1.4 Vectorization Based on Likelihood
Projections
The following method is motivated by Radial Basis
Functions with Gaussians (Scholkopf et al., 1997)
where x
i
gets a list of features that correspond to the
value of normal probability density function with a
specific center and variance.
Assuming that some probability distributions are
characteristic of some values of the Machine Learn-
ing output y, we can consider how much the values
in x
i
match or do not match a probability distribution.
More formally, we consider a set of distributions f
d
ICEIS 2023 - 25th International Conference on Enterprise Information Systems
124

for d = 1, 2 . . . , D. The level to which the data match
is quantified as log-likelihood:
z
lik
i,d
= log L
f
d
(x
i
) = log
n
i
∏
j=1
f
d
(x
i, j
) (4)
This method generalizes the binning approach if we
consider the bins as uniform distributions.
The question is how to define the set of character-
istic distributions f
d
for d = 1, 2 . . . , D. We propose
the following approach that generates a rich space of
them - to consider four normal distributions for each
i = 1, . . . , n:
• N (ˆµ(x
i
),
ˆ
σ(x
i
))
• N
ˆµ(x
i
),
ˆ
σ(x
i
)
2
• N
ˆµ(x
i
) −
ˆ
σ(x
i
)
2
,
ˆ
σ(x
i
)
2
• N
ˆµ(x
i
) +
ˆ
σ(x
i
)
2
,
ˆ
σ(x
i
)
2
Thus, we generate an abundance of D = 4 · m dis-
tributions, which requires a robust regularization ap-
proach.
The motivation for this choice of distributions is
to capture the each-other matches between i and j
records for i, j ∈ {1, . . . , n
i
} and whether record i has
values bellow or above the record j.
3.2 Note on Comparison
When using the introduced vectorizations in machine
learning tasks, we considered two approaches:
• Approach 1: To combine the vectorization with
min-max scaler and a simple model with robust
regularization. For example, the logistic regres-
sion can be applied with cross-validation to select
the right regularization parameter (Golub et al.,
1979). Similarly, we can use Lasso for regres-
sion. The essential advantage of this approach
is the interpretability of coefficients. The robust
regularization makes it applicable to all vectoriza-
tion methods, even if they significantly differ in
the number of features.
• Approach 2: To use an auto ML library that can
handle nonlinearity as well as interaction of fea-
tures. We consider this for the comparison as the
only way due to the different numbers of features.
We adopted TPOT (Le et al., 2020).
To obtain a statistically sound comparison of vari-
ous vectorizations, we adopt CV 5x2 test (Alpaydm,
1999) that is broadly adopted as a tool for comparison
of machine learning in general.
4 CASE STUDY: IMAGE
MATCHING
4.1 Case Study Statement
Our selected classification problem is motivated by a
document-processing pipeline, which requires opera-
tors to check if a pair of scans correspond to the same
underlying physical document. In this document-
processing pipeline
1
, physical documents are scanned
twice:
• once using a mobile phone scanning application
• and a second time on standard office scanners.
We call these mobile scans and standard scans, re-
spectively. Therefore, mobile and standard scans re-
sult in near-duplicate but not pixel-perfect, identical
scans. Minor differences arise due to lighting, an-
gle, cropping, and differing devices. An example of
matching image pairs may be seen in Figure 2a, and
non-matching image pairs may be seen in Figure 2b.
The task is to determine whether a given pair of a mo-
bile scan, and a standard scan are of the same under-
lying physical document, i.e., a binary target y
i
corre-
sponding to a classification task.
More formally, given two images s(d
a
) and s
′
(d
b
),
where s(d
a
) is a mobile scan s of document d
a
, and
s
′
(d
b
) is a standard scan s
′
of document d
b
, determine
if a = b:
y
i
=
(
1, if a = b
0, otherwise
(5)
Features are extracted using the ORB algo-
rithm (Rublee et al., 2011). The ORB algorithm iden-
tifies key points in the image, and each key point has a
corresponding feature vector, also known as a descrip-
tor. Keypoints are then matched by pairing key points
with the lowest calculated distance between their re-
spective descriptors.
Figure 2 displays key points and their correspond-
ing matches for matching and non-matching image
pairs. The top 20 matches are shown. Notice that
in Figure 2a, keypoints are matched well but not per-
fectly, while in Figure 2b understandably, they cannot
be matched well. Tendency, but still not sharp clar-
ity, is also evident from Figure 1 where we compare
two histograms - one for a case where the scans come
from the same document and one where they do not.
Every identified match thus results in a distance
based on the quality of the match. The number of
identified matches n
i
in each image pair may vary, re-
sulting in a set of observed distances x
i
. Therefore,
1
More details and business context is described in
(
ˇ
Capek, 2022).
Probability Distribution as an Input to Machine Learning Tasks
125

Figure 1: Histogram of x
i
for one case where the scans cor-
respond to the same document (white) and when they differ
(black).
we obtain from a pair of images a sample of obser-
vations from a distribution and can apply methods in
Section 3.
4.2 Experimental Results
We worked with 963 pairs of scans from a real-
world scanning process in an insurance company.
After applying all vectorizations defined in Sec-
tion 3.1 together with min-max scaling and L1-
regularized logistic regression optimized using 5-fold
cross-validation, we compared them using the CV
5x2 F-test as introduced in Section 3.2. The results
are summarized in Table 4. The columns are the
tested approaches. Then, we used also TPOT and the
results are in Table 2. The TPOT parameters are in
the Appendix.
Table 4 shows that the mean method is outper-
formed by all others that contain more information
about the distribution. The same also holds for Ta-
ble 2. Additionally, the advanced TPOT models prove
this case study to be more successful with stats than
with lik. This might be interpreted as the ability of
advanced models to interpret the compressed infor-
mation about the distribution.
Table 1: Results for Image Matching - Logistic Regression.
The first part summarizes the results of 10 experiments for
CV 5x2, the second part show the results of the pairwise CV
5x2 tests: p-values bellow significance level α = 5% are in
bold.
mean stats bins lik
Mean 63.43% 76.28% 74.35% 74.39%
Std 2.15% 2.01% 1.82% 1.50%
mean - 0.14% 2.01% 0.48%
stats 0.14% - 44.03% 12.59%
bins 2.01% 44.03% - 71.46%
lik 0.48% 12.59% 71.46% -
Table 2: Results for Image Matching - TPOT. The first part
summarizes the results of 10 experiments for CV 5x2, the
second part show the results of the pairwise CV 5x2 tests:
p-values bellow significance level α = 5% are in bold.
mean stats bins lik
Mean 62.51% 79.15% 75.97% 77.22%
Std 1.59% 2.15% 1.21% 1.40%
mean - 0.01% 0.00% 0.01%
stats 0.01% - 6.25% 1.04%
bins 0.00% 6.25% - 54.54%
lik 0.01% 1.04% 54.54% -
5 CASE STUDY: HIP BONE AGE
PREDICTION
5.1 Case Study Statement
For this case study, the data were taken from the opti-
cal scanning of hip bones (the collection of 153 scans
of female hip bones is taken from (Kot
ˇ
erov
´
a et al.,
2022)). Concretely, the part of the hip bone called
symphysis was considered for the comparison since
it is one part of the hip bone that is used for age de-
termination. Data were in STL format, which means
the obtained file is in the form of triangular mesh with
face normals (i.e., ordered list of face vertices coordi-
nates followed by the face normal vector). Examples
of two female symphyses of ages 21 and 87 are de-
picted in Figure 3. The detailed structure of the trian-
gular surface for 25-year-old symphysis is depicted in
Figure 4. These meshes’ parts were aligned into the
same position and size (symmetrical according to X-
and Y-axis).
The comparison and age estimation are currently
done only visually. However, the difference in surface
shapes of different ages can be demonstrated on these
two meshes from Figure 3, where the younger bone
surface has ”furrows” and the older one is more worn.
So the task is to find a sound computer estimation
procedure of the age-at-death of the scanned symph-
ysis. To obtain it, the shape function D1 (mentioned
in (Osada et al., 2002)) was used, where the function
was modified into the discrete version for vertices in
this form:
x
i, j
= sign(v
i, j,1
)
q
v
2
i, j,1
+ v
2
i, j,2
+ v
2
i, j,3
(6)
where v
i, j
= (v
i, j,1
, v
i, j,2
, v
i, j,3
) is the jth vertex in ith
sample with three components that correspond to X,Y,
Z axes in 3D. This function measures the oriented dis-
tance of mesh vertex from the origin. Note this defi-
ICEIS 2023 - 25th International Conference on Enterprise Information Systems
126

(a)
(b)
Figure 2: (a) Image pair with matching physical document with displayed matches (b) Image pair with non-matching physical
document with displayed matches.
Probability Distribution as an Input to Machine Learning Tasks
127
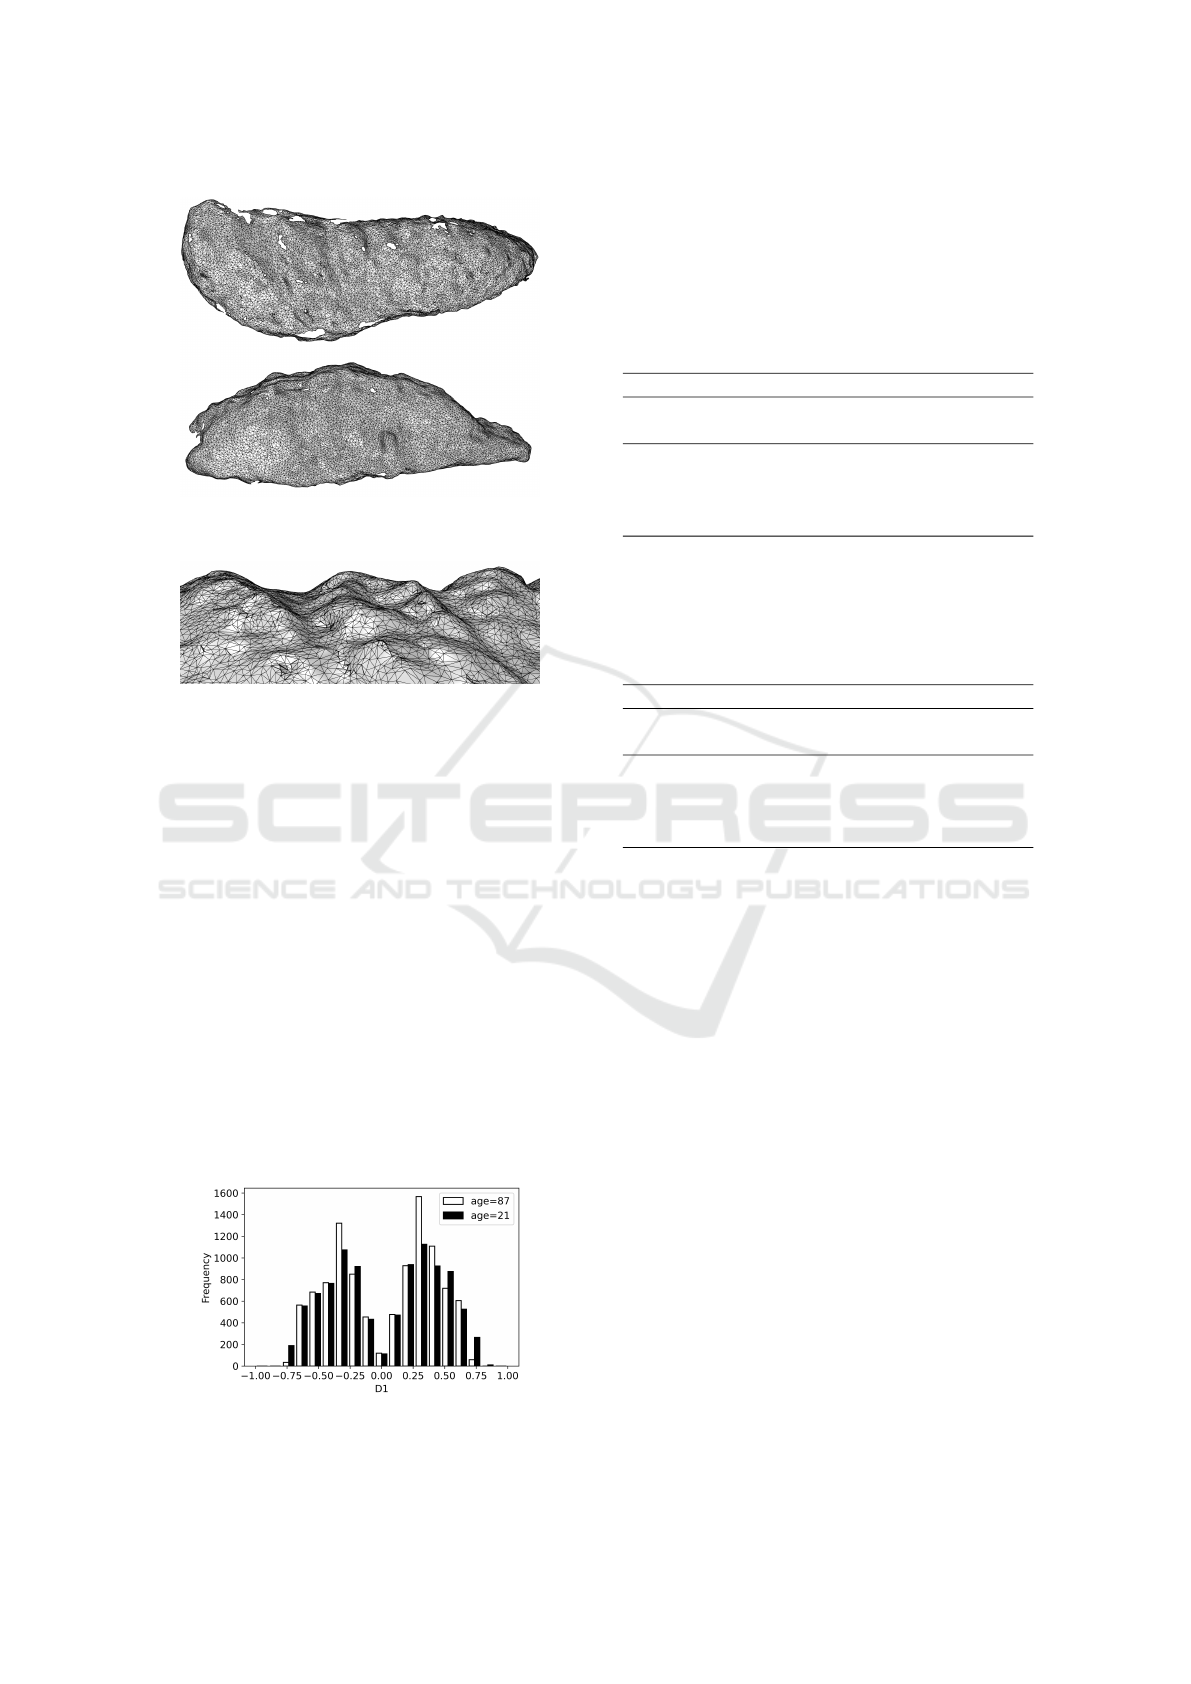
Figure 3: Hip Bone Scan - triangularized vertices.
Figure 4: Hip Bone Scan - a detail.
nition of the sign function:
sign(v
i, j,1
)
(
1, if v
i, j,1
≥ 0
−1, otherwise
(7)
Using this function, we can compare the differ-
ence of histograms for these two meshes in Figure 5.
First, the histogram values are calculated for the given
mesh from the resulting data after applying the D1
function. Then the frequencies are normalized to
eliminate the effect of a different number of vertices.
5.2 Experimental Results
The experimental results are summarized in Table 3
and Table 4 for Lasso regression and TPOT regres-
sion, respectively. As we can see, the approaches do
not differ significantly, and the more informative vec-
torizations did not outperform the simple method that
Figure 5: Histogram of x
i
for one woman of 87 years
(white) and one of 21 years (black).
uses mean. The configuration of TPOT is in the ap-
pendix.
Table 3: Results for Age Prediction with Lasso. The first
part summarizes the MAPE (Mean Absolute Percentage Er-
ror) results of 10 experiments for CV 5x2, the second part
show the results of the pairwise CV 5x2 tests: no p-values
are bellow the significance level α = 5%.
mean stats bins lik
Mean 31.49% 31.64% 31.46% 31.25%
Std 2.24% 2.06% 2.17% 2.26%
mean - 48.99% 36.05% 10.82%
stats 48.99% - 47.51% 52.59%
bins 36.05% 47.51% - 51.26%
lik 10.82% 52.59% 51.26% -
Table 4: Results for Age Prediction with TPOT. The first
part summarizes the MAPE (Mean Absolute Percentage Er-
ror) results of 10 experiments for CV 5x2, the second part
show the results of the pairwise CV 5x2 tests: no p-values
are bellow the significance level α = 5%.
mean stats bins lik
Mean 28.00% 30.43% 28.71% 32.43%
Std 1.68% 2.70% 1.77% 2.26%
mean - 55.17% 10.32% 79.72%
stats 55.17% - 30.42% 41.19%
bins 10.32% 30.42% - 10.46%
lik 79.72% 41.19% 10.46% -
6 CONCLUSION
We have examined the supervised machine learning
problem with samples from record-specific probabil-
ity density as an input. We proposed four approaches
and compared them to each other in two real-world
case studies. Methods that work with a richer rep-
resentation (empirical statistics, bins, likelihood) out-
performed the naive method based on empirical mean
statistically in one of the case studies. Moreover,
these methods do not differ when used with penalized
linear methods (Lasso, Logistic Regression). When
using more advanced modeling with the TPOT li-
brary, the method based on likelihoods has been out-
performed by the method with empirical statistics.
The positive result motivates further research in
the area. The vectorization methods can be tested
to see significant features, and the possibilities to in-
terpret the models can be further investigated. An-
other dimension can be examining methods related
to Long Short-Term Memory (LSTM) Networks or
Probabilistic Graphical Models.
ICEIS 2023 - 25th International Conference on Enterprise Information Systems
128

REFERENCES
Ahmed, N. K., Atiya, A. F., Gayar, N. E., and El-Shishiny,
H. (2010). An empirical comparison of machine learn-
ing models for time series forecasting. Econometric
reviews, 29(5-6):594–621.
Alpaydm, E. (1999). Combined 5× 2 cv f test for com-
paring supervised classification learning algorithms.
Neural computation, 11(8):1885–1892.
Camastra, F. and Vinciarelli, A. (2015). Machine learning
for audio, image and video analysis: theory and ap-
plications. Springer.
ˇ
Capek, N. (2022). Digital Document Analysis Using Ma-
chine Learning Methods. Master’s thesis, Masaryk
University, Fakulty of Informatics, Brno, Czechia.
Chami, I., Abu-El-Haija, S., Perozzi, B., R
´
e, C., and Mur-
phy, K. (2022). Machine learning on graphs: A model
and comprehensive taxonomy. Journal of Machine
Learning Research, 23(89):1–64.
Golub, G. H., Heath, M., and Wahba, G. (1979). General-
ized cross-validation as a method for choosing a good
ridge parameter. Technometrics, 21(2):215–223.
Kot
ˇ
erov
´
a, A., Navega, D.,
ˇ
Stepanovsk
´
y, M., Buk, Z.,
Br
˚
u
ˇ
zek, J., and Cunha, E. (2018). Age estimation of
adult human remains from hip bones using advanced
methods. Forensic Science International, 287:163–
175.
Kot
ˇ
erov
´
a, A.,
ˇ
Stepanovsk
´
y, M., Buk, Z., Br
˚
u
ˇ
zek, J.,
Techataweewan, N., and Velem
´
ınsk
´
a, J. (2022). The
computational age-at-death estimation from 3d sur-
face models of the adult pubic symphysis using data
mining methods. Nature, Scientific Reports 12.
Le, T. T., Fu, W., and Moore, J. H. (2020). Scaling
tree-based automated machine learning to biomedical
big data with a feature set selector. Bioinformatics,
36(1):250–256.
Murphy, K. P. (2012). Machine Learning: A Probabilistic
Perspective. The MIT Press.
Osada, R., Funkhouser, T., Chazelle, B., and Dobkin, D.
(2002). Shape distributions. ACM Transactions on
Graphics (TOG), 21(4):807–832.
Rublee, E., Rabaud, V., Konolige, K., and Bradski, G.
(2011). Orb: An efficient alternative to sift or surf.
In 2011 International conference on computer vision,
pages 2564–2571. Ieee.
Scholkopf, B., Sung, K.-K., Burges, C. J., Girosi, F.,
Niyogi, P., Poggio, T., and Vapnik, V. (1997). Com-
paring support vector machines with gaussian kernels
to radial basis function classifiers. IEEE transactions
on Signal Processing, 45(11):2758–2765.
Vinyals, O., Bengio, S., and Kudlur, M. (2015). Order mat-
ters: Sequence to sequence for sets. arXiv preprint
arXiv:1511.06391.
APPENDIX
TPOT Configuration
TPOT an auto-ML Python library
2
that was used in
the experiments for more advanced modeling. For the
classification, the following configuration was used:
TPOTClassifier(generations=5,
population_size=20,
cv=5,
random_state=42,
verbosity=2)
For the regression, the following configuration was
used:
TPOTRegressor(
generations=5,
population_size=20,
cv=5,
random_state=42,
verbosity=2,
scoring=make_scorer(
mean_absolute_percentage_error,
greater_is_better=False))
2
http://epistasislab.github.io/tpot/
Probability Distribution as an Input to Machine Learning Tasks
129
