
ResNet Classifier Using Shearlet-Based Features for Detecting Change in
Satellite Images
Emna Brahim
1
, Sonia Bouzidi
1,2
and Walid Barhoumi
1,3
1
Universit
´
e de Tunis El Manar, Institut Sup
´
erieur d’Informatique d’El Manar, Research Team on Intelligent Systems in
Imaging and Artificial Vision (SIIVA), LR16ES06 Laboratoire de Recherche en Informatique,
Mod
´
elisation et Traitement de l’Information et de la Connaissance (LIMTIC), 2080 Ariana, Tunisia
2
Universit
´
e de Carthage, Institut National des Sciences Appliqu
´
ees et de Technologie,
1080 Centre Urbain Nord BP Tunis Cedex, Tunisia
3
Universit
´
e de Carthage, Ecole Nationale d’Ing
´
enieurs de Carthage,
45 Rue des Entrepreneurs, 2035 Tunis-Carthage, Tunisia
Keywords:
Change Detection, CNN, ResNet152, Shearlet Transform.
Abstract:
In this paper, we present an effective method to extract the change in two optical remote-sensing images.
The proposed method is mainly composed of the following steps. First, the two input Normalized Difference
Vegetation Index (NDVI) images are smoothed using the Shearlet transform. Then, we used ResNet152 ar-
chitecture in order to extract the final change detection image. We validated the performance of the proposed
method on three challenging data illustrating the areas of Brazil, Virginia, and California. The experiments
performed on 38416 patches showed that the suggested method has outperformed many relevant state-of-the-
art works with an accuracy of 99.50%.
1 INTRODUCTION
In this work, we deal with the detection of the change
in two remote sensing images acquired in the same
area and at different times. In fact, change detection
in remote sensing images is used in many approaches:
Classification based on difference, difference based
on classification, or only classification. In this frame-
work, deep learning is among the most efficient tools
in remote sensing and image interpretation, and it has
shown its effectiveness in several connected domains
such as change detection (Brahim et al., 2021), im-
age classification (Mittal et al., 2022), and object de-
tection (Bortoloti et al., 2022). Within the context
of the first approach (classification based on differ-
ence), there are many methods used in change detec-
tion in optical remote sensing images such as: (Shi
et al., 2021) who utilized a Deeply Supervised Atten-
tion Metric-based Network (DSAMNet). This tech-
nique allowed the treatment of large amounts of data
with a recorded accuracy rate of 93.69%. However,
(Brahim et al., 2021) employed the same techniques
introduced by (Shi et al., 2021), but the input data
were the subtract of the preprocessing images. Then,
the authors used the Convolutional Neural Network
(CNN) to detect the change. This method gave better
results for all types of data compared to those pro-
vided by (Shi et al., 2021). Likewise, (Zhang et al.,
2020) generated the Resnet to determine the features
of the two input images, before identifying the dif-
ference between them in order to detect the change.
This method did not give a better result (=96%), com-
pared to that employed by (Brahim et al., 2021), and
this is mainly due to the fact that (Zhang et al., 2020)
did not utilize a performant Resnet type. However,
(Wang et al., 2022) used a dual-path denoising net-
work (DPDNet). The authors generated the difference
image to extract the labels. Subsequently, they uti-
lized the difference image to extract the features and
applied a supervised classifier to extract the change
in the studied images. This method showed higher
efficiency and provided better accuracies (=98, 50%)
than those presented in (Shi et al., 2021), (Zhang et
al., 2020), and (Chen et al., 2022) where a multi-
scale supervised fusion network (MSF-Net) was in-
vestigated in order to detect the change. In fact, de-
spite the precise generation of the difference between
the features, the detection of the change in the two
input images is quite inaccurate. Indeed, the used
network gave an accuracy equal to 71% to detect the
change. Regarding the methods used in the second
approach (difference based on classification), (Dong
Brahim, E., Bouzidi, S. and Barhoumi, W.
ResNet Classifier Using Shearlet-Based Features for Detecting Change in Satellite Images.
DOI: 10.5220/0011781200003417
In Proceedings of the 18th International Joint Conference on Computer Vision, Imaging and Computer Graphics Theory and Applications (VISIGRAPP 2023) - Volume 4: VISAPP, pages
427-434
ISBN: 978-989-758-634-7; ISSN: 2184-4321
Copyright
c
2023 by SCITEPRESS – Science and Technology Publications, Lda. Under CC license (CC BY-NC-ND 4.0)
427
et al., 2020) utilized the network DADNN to classify
the two input images and generate the difference be-
tween the obtained results. Although the execution of
this method was very complex, it gave a 96% satisfac-
tory accuracy rate. But, (Seyd et al., 2022) used the
DNN-Net deep neural network (DNN-Net). This net-
work gave a 91.15% accuracy which is low compared
to that provided by the methods used in the first ap-
proach because in the first approach when we gener-
ated the difference before the classification, the infor-
mation about the two images was detailed. Regarding
the methods applied in the last approach (Only clas-
sification), (Zhang et al., 2022) employed SMD-Net
to detect the change in the two input images. This
method gave a 97.15% accuracy result, which is not
better than that provided by the first approach.In this
paper, we try to ameliorate the efficiency of of the
first approach technique proposed by (Brahim et al.,
2021), through developing a more efficient method
and determining the efficacity of the subtract features
compared with the subtract of the two input images.
The method is applied following the two steps de-
scribed below: Smoothing the two input NDVI im-
ages using the Shearlet transform decomposition and
K-means. Then, detecting the binary change by us-
ing ResNet152 to detect the final change. This paper
is organized as follows: Section 2 defines the sug-
gested method. Section 3 presents the conducted ex-
periments and illustrates the obtained results. Finally,
Section 4 concludes the paper and presents some fu-
ture perspectives.
2 PROPOSED METHOD
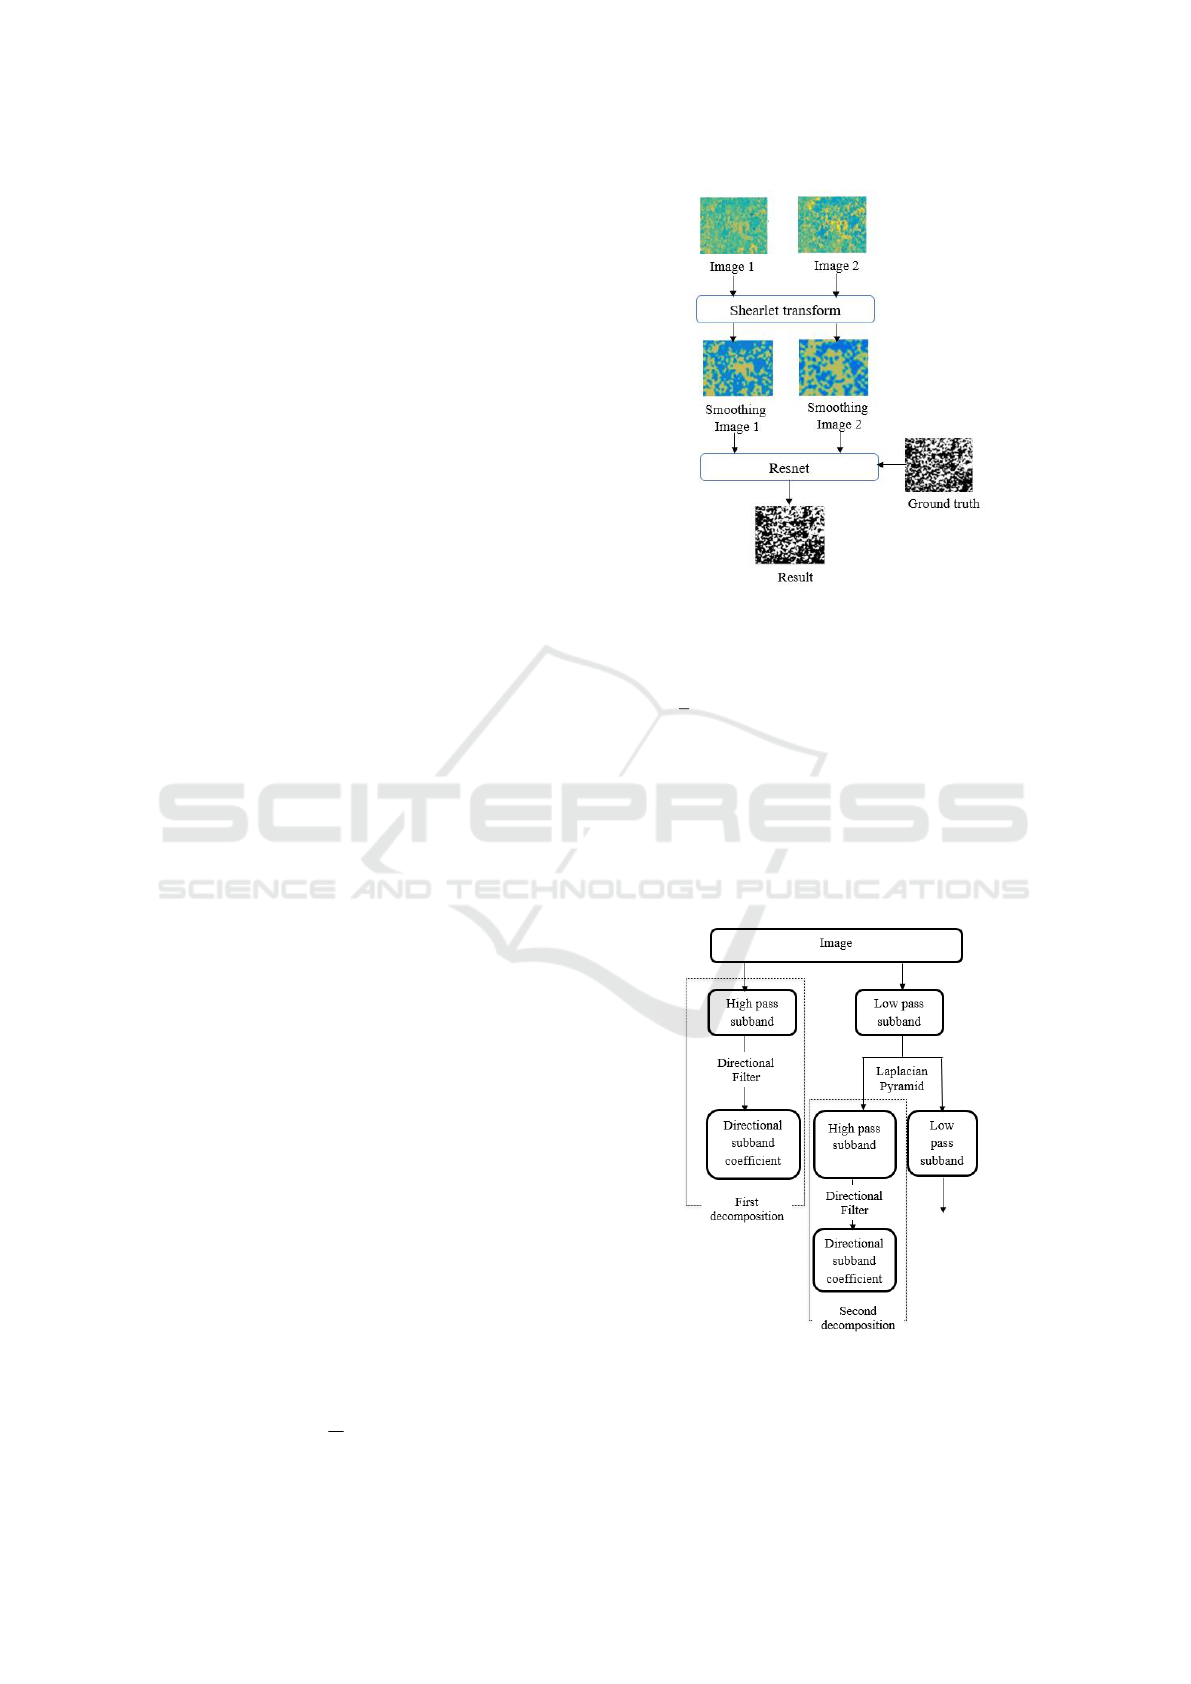
The proposed method is presented in (Figure 1). The
Shearlet transform was used to smooth the two input
images by dividing them into high and low frequen-
cies. Then, classifying them using K-means and re-
constructing them to obtain the two smoothed images.
After that, ResNet152 was used to extract the final re-
sult of the change.
2.1 Shearlet Transform
The shearlet transform, which is the 2D-Multiscale
Geometric Decomposition (MGD) employed to
smooth the two input NDVI images and detect the low
and high coefficients of the two input images. In 2 di-
mension (ξ = (ξ
1
, ξ
2
) ∈
b
R
2
), the Shearlet transform
represents a frequency domain with dilations using
the following function:
ϕ
j,s,k
(x) = a
−3
4
ϕ[U
−1
s
V
−1
a
(x −k)]
(1)
Figure 1: Flowchart of the proposed method.
Where ϕ
j,s,k
is a shearlet, j is the scale, s ∈ R is the
shear direction, k is the translation parameter, V
a
=
a 0
a
√
a
is the dilation matrix, U
s
=
1 1
0 1
is the
shear matrix, with a≥ 0.
The coefficients were computed using several
functions stated in the research work of (Brahim et al.,
2021). The steps of image decomposition are as fol-
lows: First, applying the Laplacian Pyramid and di-
rectional filter to decompose the two images into low
and high frequencies (Brahim et al., 2021) at scale j
(Figure 2).
Figure 2: Exemple of illustration of the decomposition in
two scales using Shearlet transform.
Classifying the low and high frequencies of each
image and in each scale, using K-means with this al-
VISAPP 2023 - 18th International Conference on Computer Vision Theory and Applications
428
gorithm:
1. Identifying the number of clusters K. repeat (2, 3)
when the cluster K does not change.
2. Assigning each coefficient to the closest partition.
3. updating the mean of each cluster.
After classifying the coefficient, we employed the
inverse Fast Fourier Transform (FFT) to reconstruct
the two smoothed input images.
Finally, ResNet152 was used to extract the bi-
nary change (0: Unchanged, 1: Changed) of the two
smoothed images.
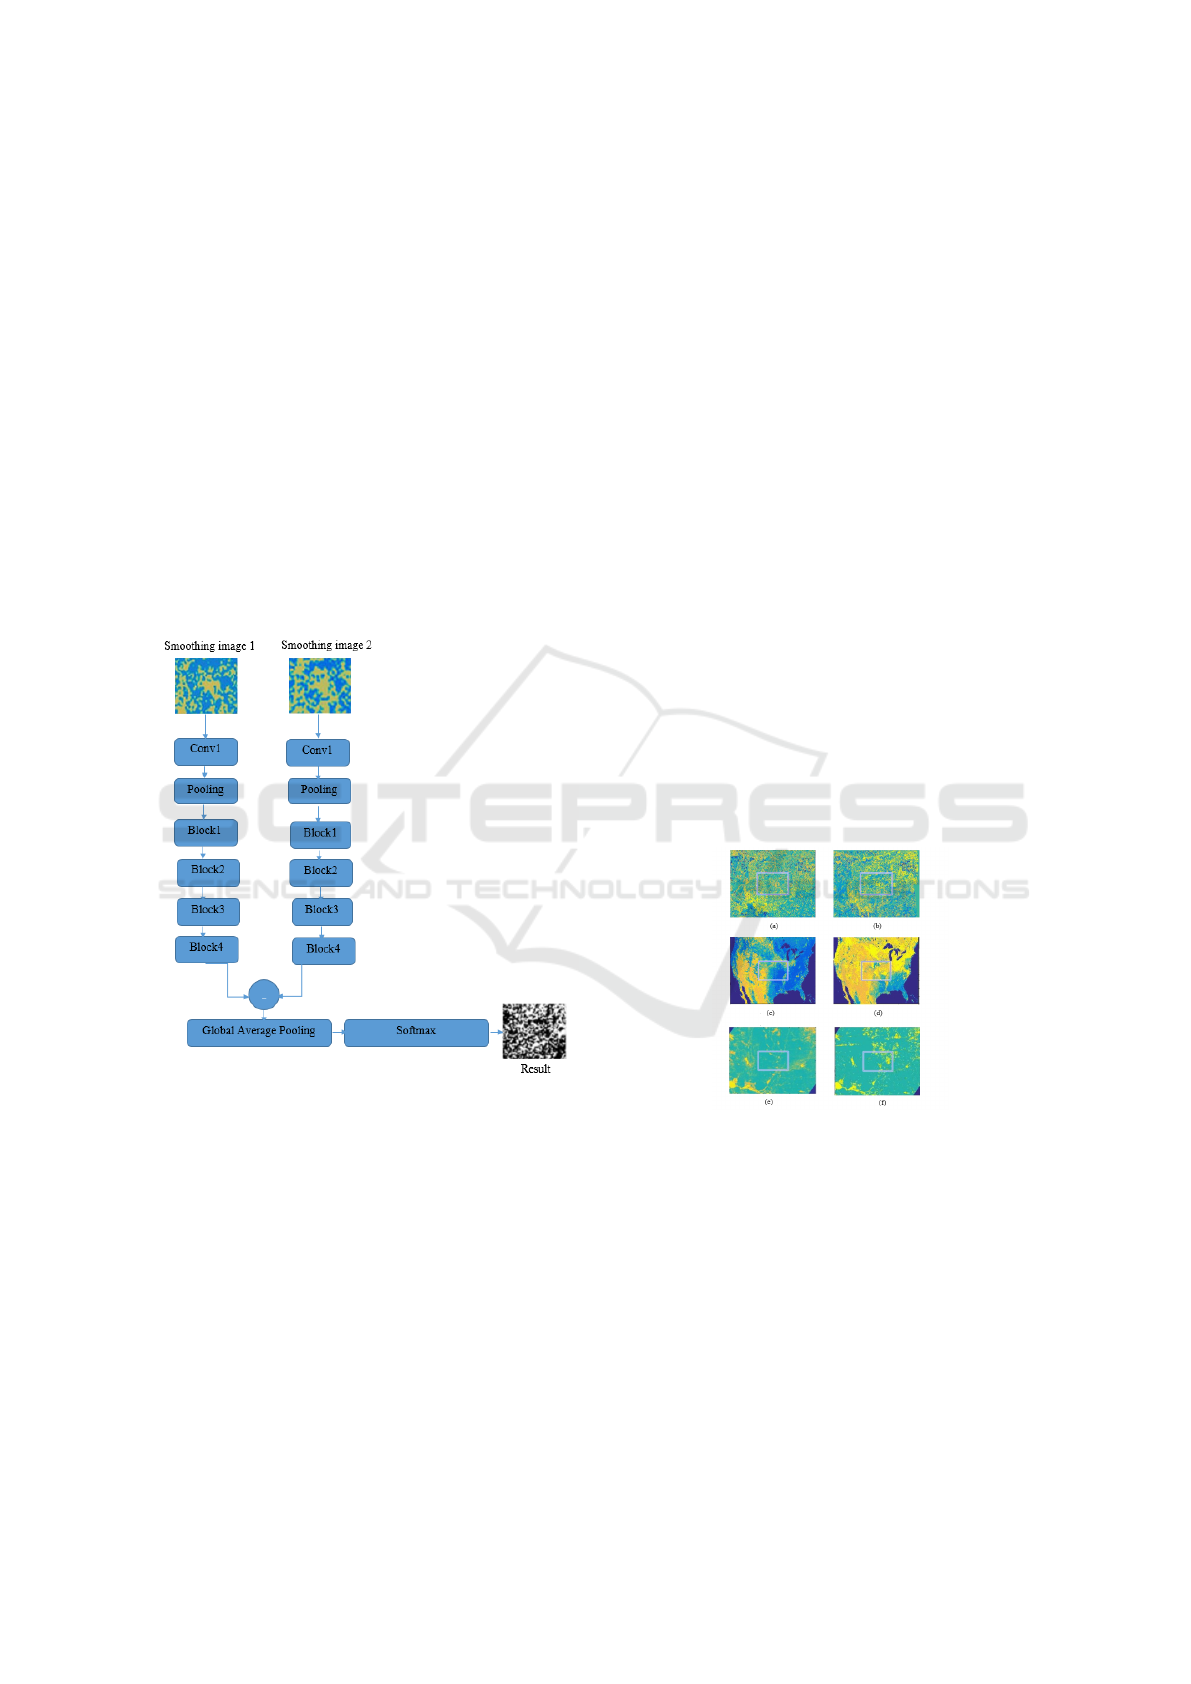
2.2 Residual Neural Network
The Residual neural network (ResNet152) includes
several block layers and pooling layers used to detect
the change (Figure 3).
Figure 3: Flowchart of Resnet.
In fact, the adopted Resnet152 contains many con-
volutional layers. The first convolutional layer uti-
lizes a kernel size equal to (5,5), while the other con-
volutional layers are composed of four blocks. Each
block is made up of four convolutional layers having
kernel sizes equal to (3,3) and the outputs of the chan-
nel in each block are respectively equal to 64, 128,
256, 512. After extracting the features of the first con-
volutional layers, the pooling layers were generated
into (2, 2) sizes. Then, the four blocks were utilized
to detect and subtract the features of the two images.
Then, we generated the Average Pooling function into
(2, 2). Finally, Softmax was used to detect the change
in the two images.
3 RESULTS
In this section, we describe the data areas and the
choice of the parameters of each technique applied
in the introduced method. We also demonstrate and
evaluate the obtained results and we show the effi-
ciency of the developed method.
The treated data are multispectral NDVI images in
order to facilitate the analysis and the treatment of the
two images.
In the first data, the two images represented the re-
gion of Brazil having the following coordinates: (17
° 10’S, 53 ° 10’N) and (19 ° 45’S, 55 ° 10’W). They
were captured by the Landsat satellite between Au-
gust 2000 and September 2001. The second data,
are the two images representing the region of Vir-
ginia having the following coordinates: (31 ° 07’S,
23’N) and (081 ° 37’S, 44’W). They were captured
by the Modis satellite between June 2021 and July
2022 and characterized by low spatial resolution. The
third data, represent two images captured by Landsat
satellite between March 2021 and April 2022. They
show the region of California with the following co-
ordinates: (34 ° 45’S, 29’N) and (084 ° 07’S, 51’W).
The dimensions of the two images of the three data
were 400×400. These images had low spatial resolu-
tion and were captured using two different satellites,
as shown in Figure 4.
Figure 4: NDVI original images: (a) and (b) NDVI images
captured in two periods 2000 and 2001. (c) and (d) NDVI
images captured in two periods 2020 and 2021. (e) and (f)
NDVI images captured in two periods 2021 and 2022.
The input original images were smoothed using
the Shearlet transform. The latter has 5 scales and 5
orientations (0, 10, 10, 10,18), which allow the good
smoothing of the two images. To show the high per-
formance of the used Shearlet, a part of the two im-
ages (Figure 5) was framed and the Shearlet trans-
form was decomposed. Then, the obtained coeffi-
cients were classified using k-means. The latter is bet-
ter than the OTSU because it does not yield data loss.
After classification, the inverse Shearlet was gener-
ResNet Classifier Using Shearlet-Based Features for Detecting Change in Satellite Images
429
ated to reconstruct the two smoothed images in each
data (Figure 5). To enhance the results given by the
Shearlet transform, we examined an area framed in
the two input images.
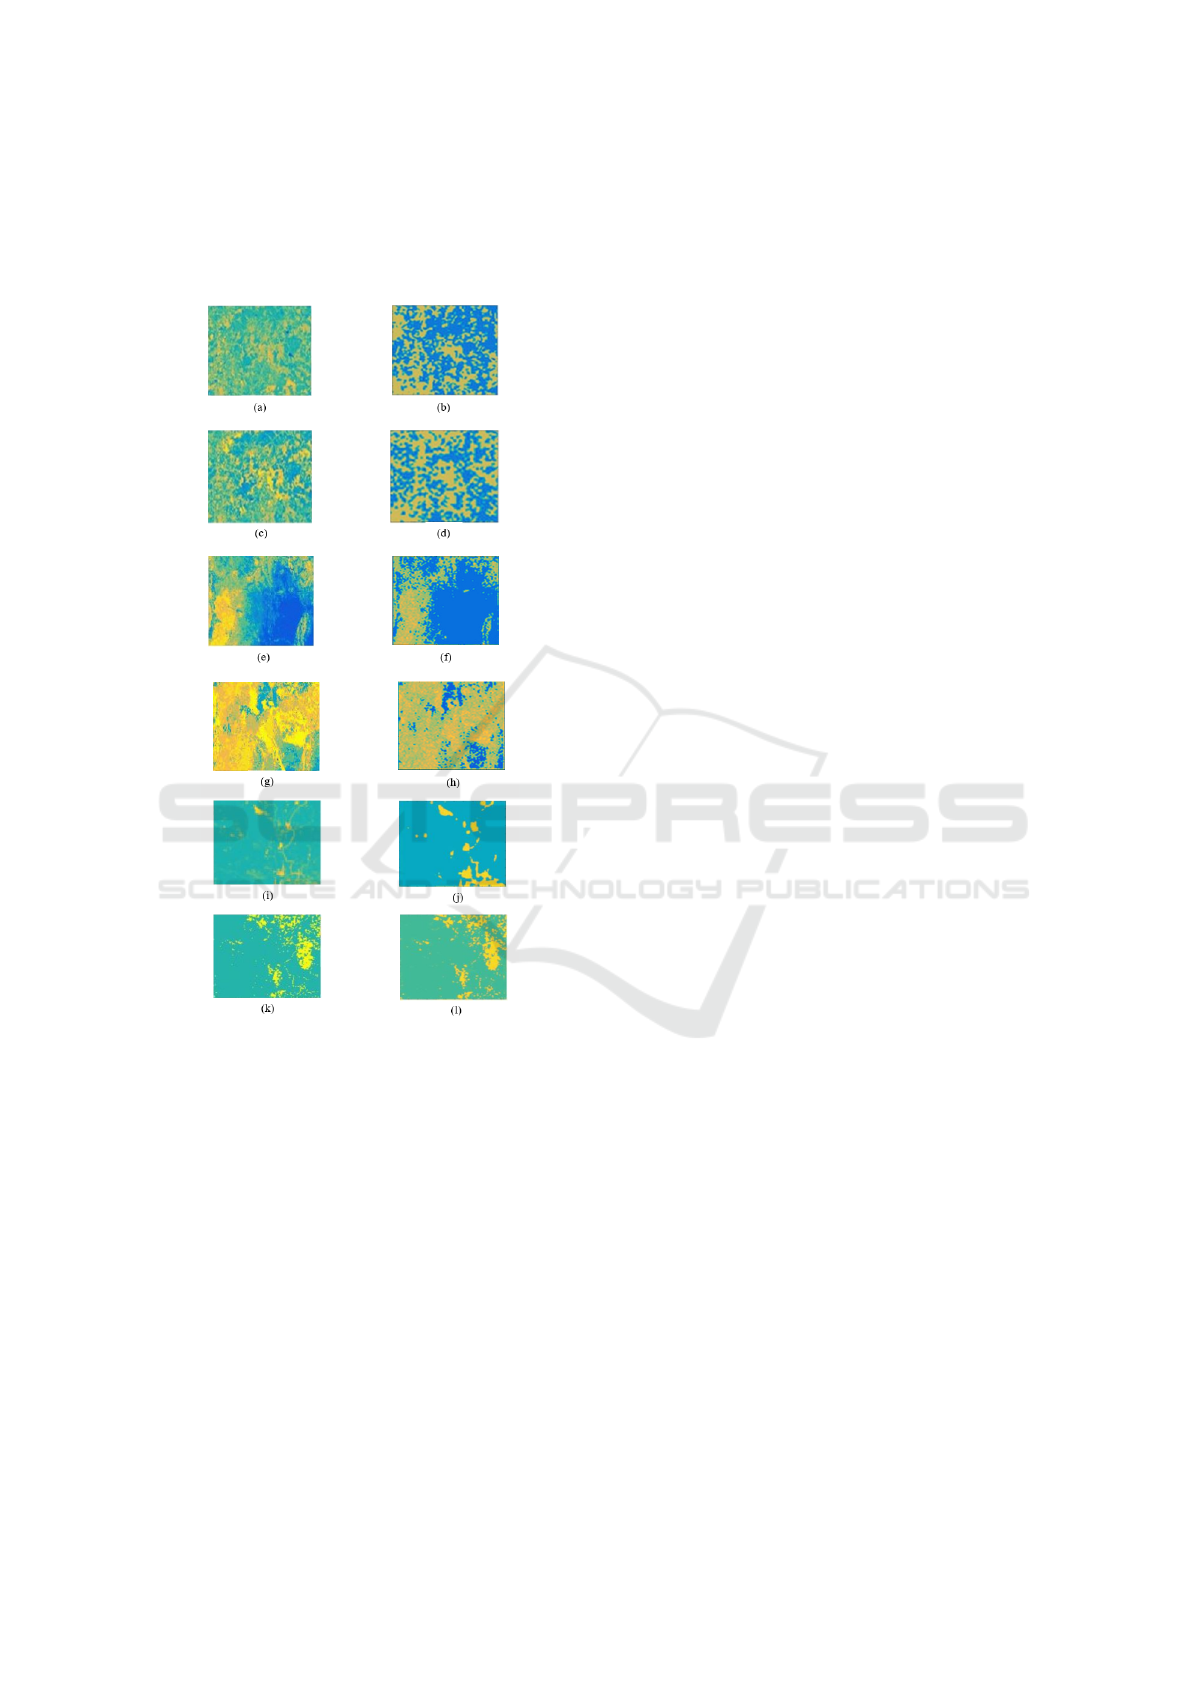
Figure 5: Smoothing area of the two images captured in
August 2000 and September 2001 using Shearlet transform:
(a) and (c) the area in August 2000 and September 2001,
(b) and (d) Shearlet transform. (e) and (g) the area in June
2021 and July 2022, (f) and (h) shearlet transform. (i) and
(k) the area captured in March 2021 and April 2022, (j) and
(l) Shearlet transform.
Figure 5, shows that the smoothing of the images
using Shearlet transform without employing other
methods, such as Wavelet, etc., provided very satis-
factory results. This method generated the multi-scale
decomposition to smooth the images.
After smoothing, the two images were classified
by ResNet152 using the CNN result of each pixel
(changed or unchanged labels) as a ground truth. The
convolutional neural network was employed to extract
the labels. It contains nine convolutional layers where
the first kernel size (3, 3) and other kernel sizes (5, 5)
were used. CNN used the value 10 in the first chan-
nel because the studied data is an optical multispec-
tral remote sensing. When we augmented the chan-
nel of the feature, the results became detailed. For
the two first convolutional layers, the pooling func-
tion was transformed into (2, 2) size to extract the
features. Then, the subtraction features and the three
fully connected layers were determined to calculate
the probability of the labels. Afterward, Softmax was
applied to extract the labels in a binary form (0: Un-
changed, 1: Changed). This classifier performed bet-
ter than the others because it gave better classification
results. The ground truth of the network CNN is the
subtraction between the two smoothing input images.
If the subtraction is equal to 0, the pixel is unchanged
otherwise it is changed. The network was created us-
ing 200 epochs to detect the label of each pixel. In
this step, we extracted in each data (Brazil, Virgina,
California) a single area in each two input smoothing
images with the same position which contains sev-
eral changes in the ground truth. This area includes
38416 patches to better perceive the efficiency of the
network. To evaluate our network, we tested three pa-
rameters: The training data, testing data, and the val-
idation data. The three data are different. Concerning
the training data, we used this data to know the hid-
den features of the network. However, we used the
testing data to test the network after training. Then,
the validation data was used to validate our proposed
network. So, from the 38416 patches, we extracted
(60% = 23050) in the training data, (20% = 7683) in
the validation data, and (20% = 7683) in the testing
data with the size (5, 5) for each patch.
The results obtained using CNN are the ground
truth of the ResNet152 network. The latter was
trained using the ‘Adam’ optimizer because it was the
most widely used in the state of the art and gave good
results. The findings provided by each data are illus-
trated in Figure 6, Figure 7, Figure 8, and Figure 9.
In Figure 6, the results illustrated in (A), (B), and
(C) correspond to the labels of the two images in
the three data. In fact, (a), (b), (c), and (d) repre-
sent respectively the first image, the second image,
the benchmark, and the result of the CNN. The ac-
curacy results obtained by the first, second, and third
data were equal to 99.50%, 99.42%, and 99.46%, re-
spectively. This network was validated using differ-
ent types of data to validate the efficiency of the net-
work by employing many convolutional layers to de-
tect more details about the features. The second data
was of Modis type, where the network gave the best
results. The labels (changed and unchanged) of each
pixel were determined by this network utilized in our
previous work (Brahim et al., 2021). After this step,
VISAPP 2023 - 18th International Conference on Computer Vision Theory and Applications
430
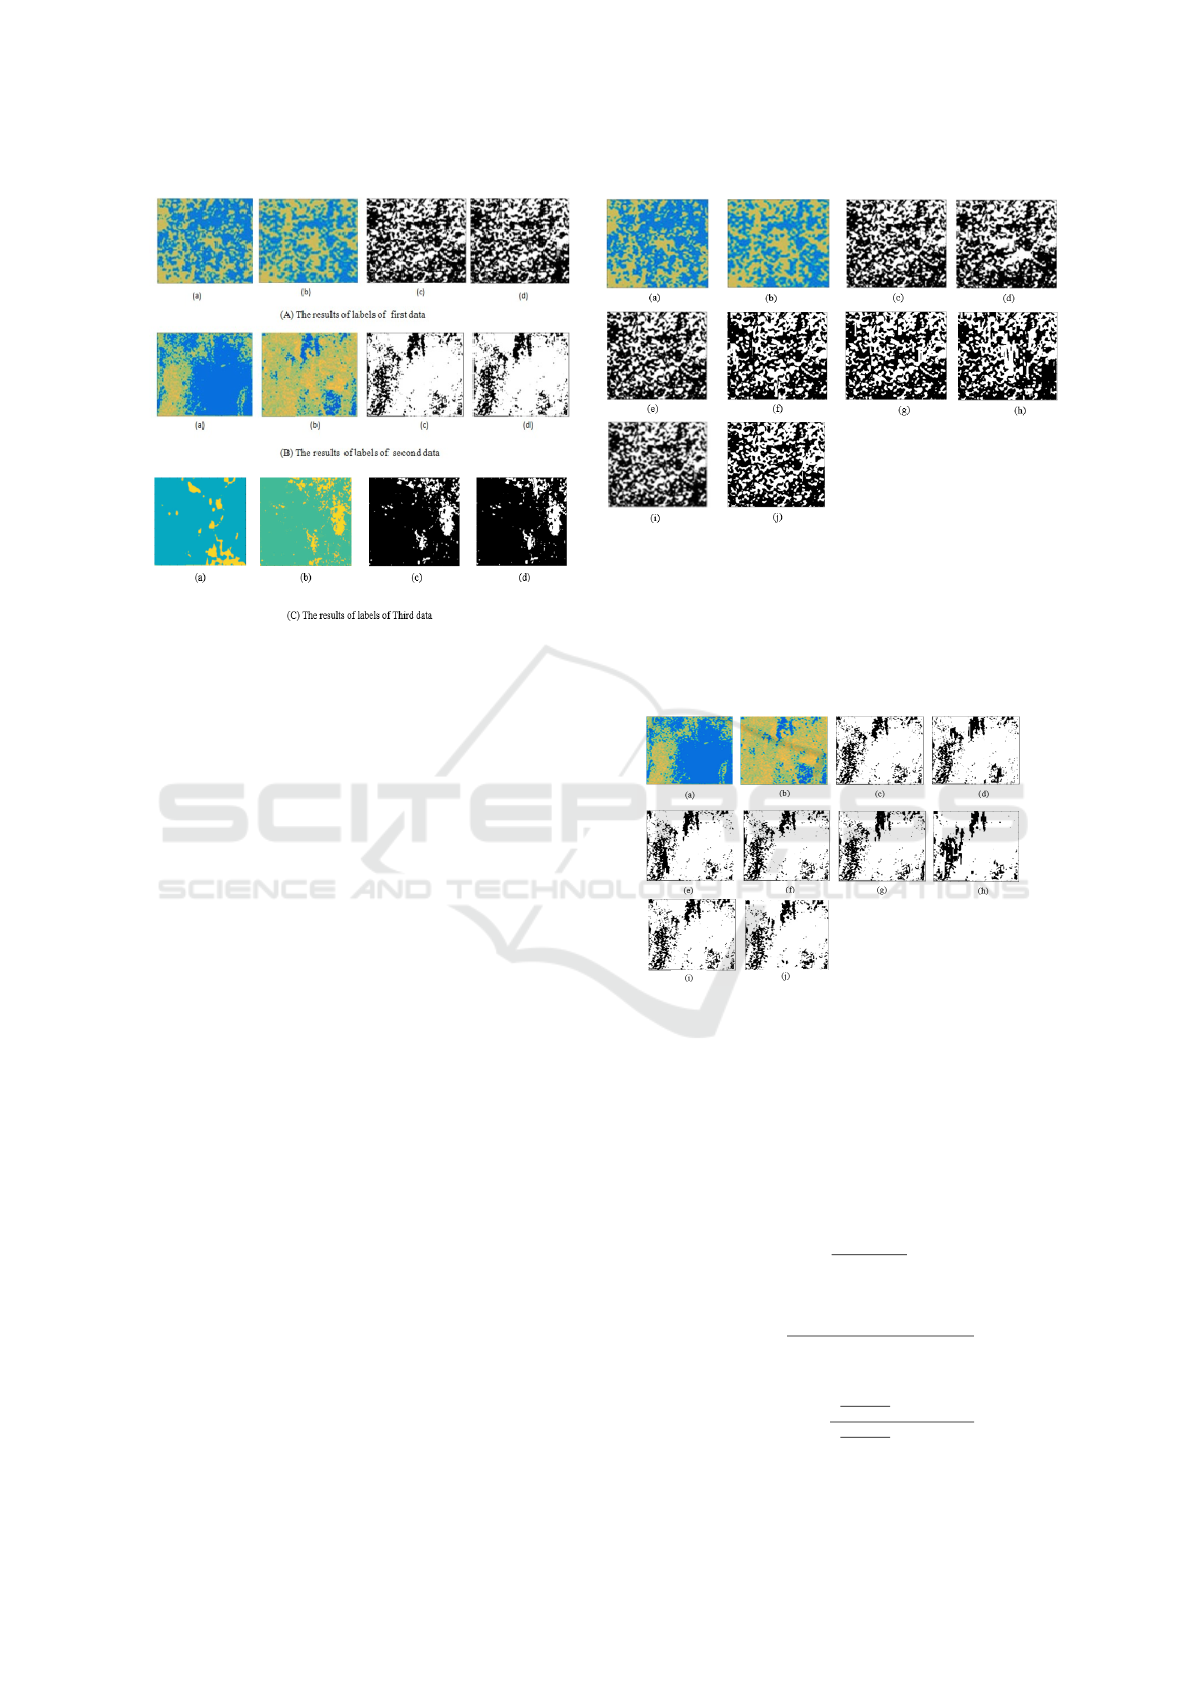
Figure 6: Extraction the labels of each data (Brazil, Vir-
ginia, California) using CNN where white and black pixels
are respectively (Changed, Unchanged).
the results given by CNN were used in ResNet152. It
showed high efficiency in detecting the final change
using two smoothed images. Four layers were em-
ployed in this network (Resnet152), which contained
blocks to demonstrate the features of these input im-
ages. Different values of kernel size of each convolu-
tional layer were also obtained. The input kernel size,
which was equal to 64 was chosen because it pro-
vided satisfactory results using the input multispectral
optical images of the Resnet152 network. The lat-
ter was trained by the same optimizer and epochs of
CNN. Then, the performance of the proposed method
was validated by comparing it to that of the methods
utilized by (Shi et al., 2021), (Brahim et al., 2021),
(Zhang et al., 2020), (Dong et al., 2020), and (Chen et
al., 2022) (Figure 7, 8 and 9). In each epoch, the accu-
racy and the loss were calculated and the parameters
of this network were updated to improve the learning
optimization.
In Figure 7, 8, and 9, the obtained results reveal
that the findings provided by the suggested technique
are better than those given by the other methods. The
importance of the proposed method was observed in
the subtraction between the features of the blocks in
ResNet152 to detect the change and the network is
made of several blocks of convolutional layers, which
allow better detection of the change in the two im-
ages. When there were high features, the characteris-
tics of each image were detailed and better classifica-
tion findings were provided.
Figure 7: Change detection map results of Brazil data: (a),
(b), (c), (d), (e), (f), (g), (h), (i), (j) represent respectively
the first image, the second image, the ground truth, the re-
sults of the change detection of (Shi et al., 2021), (Brahim
et al., 2021), (Zhang et al., 2020), (Dong et al., 2020), and
(Chen et al., 2022), the method Shearlet+CNN, and the pro-
posed method. Where white and black pixels are respec-
tively (Changed, Unchanged).
Figure 8: Change detection map results of Virgina data: (a),
(b), (c), (d), (e), (f), (g), (h), (i), (j) represent respectively
the first image, the second image, the ground truth, the re-
sults of the change detection of (Shi et al., 2021), (Brahim
et al., 2021), (Zhang et al., 2020), (Dong et al., 2020), and
(Chen et al., 2022), the method Shearlet+CNN, and the pro-
posed method. Where white and black pixels are respec-
tively (Changed, Unchanged).
The Recall, Accuracy, and F1-Score were com-
puted using the following formula:
Recall =
T P
T P + FN
(2)
Accuracy =
(T P + T N)
(T P + FN + TN + FP)
(3)
F1 −score = 2 ×
(
T P
T P+F P
) ×Recall
(
T P
T P+F P
) +Recall
(4)
ResNet Classifier Using Shearlet-Based Features for Detecting Change in Satellite Images
431

Figure 9: Change detection map results of California data:
(a), (b), (c), (d), (e), (f), (g), (h), (i), (j) represent respec-
tively the first image, the second image, the ground truth,
the results of the change detection of (Shi et al., 2021),
(Brahim et al., 2021), (Zhang et al., 2020), (Dong et al.,
2020), and (Chen et al., 2022), the method Shearlet+CNN,
and the proposed method. Where white and black pixels are
respectively (Changed, Unchanged).
Where,TP, TN, FP and FN represent respectively
true-positive, true-negative, false-positive and false-
negative (Brahim et al., 2021). The data results are
presented in Table 1 and the TP, TN, FP, FN are illus-
trated in Table 2.
In table 1, the difference values between the ac-
curacy result given by our method and other existing
methods in the first data are equal to 4.51%, 0.18%,
1.76%, 0.03%, 1.41%, and 5.2%, respectively. How-
ever, in the second data, the difference values are
respectively equal to 2.52%, 0.29%, 1.7%, 0.05%,
1.39%, and 6.74%. As regards the third data, the
difference values are respectively equal to 3.99%,
0.44%, 0.04%, 2.74%, 1.49%, and 3.75%. Using Ta-
ble 1, we conclude that the value of the difference be-
tween the accuracy result given by the two methods
DSAMNET (Shi et al., 2021), MSF-Net (Chen et al.,
2022), and the proposed method in each data is im-
portant because in the two works (Shi et al., 2021) and
(Chen et al., 2022) the input images were not prepro-
cessed so the result of change detection was not bet-
ter. For the two methods based on Shearlet+DI+CNN
(Brahim et al., 2021) and Shearlet+CNN, the value
of the difference between the accuracy result given
by the two methods and the proposed method was
low. However, in the first method based on Shear-
let+DI+CNN (Brahim et al., 2021), the input data of
the CNN were the subtraction of the two smoothed
images using the Shearlet transform. In this shearlet,
the authors used the OTSU to classify all the coeffi-
cients but in the second method, Shearlet+CNN, we
utilized K-means to classify all the coefficients with-
out losing the data and we generated the subtraction
of the features for more convolutional layers of CNN.
When the number of convolutional layers increases,
the features become more detailed. So the result ac-
curacy is increased compared to the result of Shear-
let+DI+CNN (Brahim et al., 2021). The following
Recall results obtained in the first and second data of
MSF-Net (Chen et al., 2022) and DSAMNET (Shi
et al., 2021) were low compared to the other meth-
ods and the proposed method with a value difference
respectively equal to 5.17%, 0.34%, 0.89%, 0.18%,
0.67%, and 5.19% in the first data. In the second
data, the value difference was respectively equal to
1.46%, 0.19%, 1.067%, 0.07%,0.85%, and 2.46%. In
the third data, the following Recall results of Shear-
let+DI+CNN (Brahim et al., 2021) was better com-
pared to the proposed method because in the Shear-
let+DI+CNN method (Brahim et al., 2021) the clas-
sifier of the coefficients in shearlet is OTSU so the
data change can be lost. Then, The result of Shear-
let+DI+CNN (Brahim et al., 2021) increased com-
pared to the proposed method with a value equal to
0.4%, which is not a very important difference. The
F1-score result in the first data, the second data and
the third data was low compared to the proposed
method. Obviously, the results improved the values,
which were respectively equal, in the first data, to
5.05%, 0.17%, 0.9%, 0.01%, 0.44%, and 5.78%. In
the second data, the difference values were respec-
tively equal to 1.55%, 0.17%, 1.06%, 0.037%, 0.85%,
and 2.83%. However, in the third data, they were
equal to 17.05%, 2.59%,10.88%, 1.23%, 7.2%, and
15.58%. The accuracy result and the F1-score re-
sult of the proposed method increased compared to
the result of method Shearlet+CNN. Therefore, The
Resnet152 network played an important role in the
change detection. Table 1 shows that, in each data, the
accuracy result of the proposed method was consider-
ably higher compared to that of the other methods.
In Table 2, the result of FN of the proposed
method in the first data decreased compared to other
methods. For example, the difference value pro-
vided by the method Shearlet+DI+CNN (Brahim et
al., 2021) and the introduced method was equal to
0.35% in the first data, and equal to 0.19%, in the
second data. However, in the third data, the FN re-
sult increased, because the Recall result of the Shear-
let+DI+CNN method (Brahim et al., 2021) was su-
perior to the Recall result of the proposed method.
Consequently, the TP result of the Shearlet+DI+CNN
method (Brahim et al., 2021) was important compared
to the result of the proposed method. The degrada-
tion value was not important so the accuracy value
of the proposed method was better. Using the pro-
posed method, the FP result in three data was better
and increased compared to the result of the proposed
VISAPP 2023 - 18th International Conference on Computer Vision Theory and Applications
432

Table 1: Change detection results obtained by the proposed method with those provided by some relevant methods applied in
the state of the art (best values are in bold).
Data Methods Recall(%) F1-score(%) Accuracy(%)
Brazil DSAMNET (Shi et al., 2021) 94.43 94.35 94.99
Shearlet+DI+CNN (Brahim et al., 2021) 99.26 99.23 99.314
ResNet (Zhang et al., 2020) 98.72 98.51 97.74
Shearlet+Difference Features+Classifiers 99.43 99.40 99.47
DADNN (Dong et al., 2020) 98.93 98.96 98.09
MSF-Net (Chen et al., 2022) 94.42 93.63 94.26
The proposed method 99.61 99.41 99.50
Virginia DSAMNET (Shi et al., 2021) 98.30 98.09 96.90
Shearlet+DI+CNN (Brahim et al., 2021) 99.57 99.47 99.13
ResNet (Zhang et al., 2020) 98.69 98.57 97.72
Shearlet+Difference Features+Classifiers 99.69 99.61 99.37
DADNN (Dong et al., 2020) 98.91 98.79 98.03
MSF-Net (Chen et al., 2022) 97.30 96.81 94.75
The proposed method 99.76 99.64 99.42
California DSAMNET (Shi et al., 2021) 83.87 81.78 95.50
Shearlet+DI+CNN (Brahim et al., 2021) 98.38 96.24 99.05
ResNet (Zhang et al., 2020) 87.90 87.95 96.75
Shearlet+Difference Features+Classifiers 98.21 97.60 99.46
DADNN (Dong et al., 2020) 93.95 91.63 98.00
MSF-Net (Chen et al., 2022) 84.37 83.25 95.74
The proposed method 97.98 98.83 99.49
Table 2: Obtained TN, FP, FN, and TP rates given by the proposed method, CNN without Shearlet and SCNN (best values
are in bold).
Data Methods TN(%) FP(%) FN(%) TP(%)
Brazil DSAMNET (Shi et al., 2021) 95.44 4.55 5.5 94.43
Shearlet+DI+CNN (Brahim et al., 2021) 99.35 0.64 0.73 99.26
ResNet (Zhang et al., 2020) 93.45 6.5 1.3 98.69
Shearlet+CNN 99.49 0.5 0.56 99.43
DPDNET (Wang et al., 2022) 94.39 5.6 1 98.93
MSF-Net (Chen et al., 2022) 94.10 5.8 5.5 94.42
The proposed method 99.38 0.61 0.38 99.61
Virginia DSAMNET (Shi et al., 2021) 90.90 9 1.6 98.30
Shearlet+DI+CNN (Brahim et al., 2021) 97.27 2.7 0.42 99.57
ResNet (Zhang et al., 2020) 93.24 6.7 1.2 98.72
Shearlet+CNN 97.91 2.04 0.3 99.69
DPDNET (Wang et al., 2022) 94.20 5.79 1 98.91
MSF-Net (Chen et al., 2022) 81.87 18.12 2.6 97.30
The proposed method 97.99 2 0.23 99.76
California DSAMNET (Shi et al., 2021) 99.70 2.8 16 83.87
Shearlet+DI+CNN (Brahim et al., 2021) 99.14 0.85 1.6 98.38
ResNet (Zhang et al., 2020) 98.00 1.9 12 87.90
Shearlet+CNN 99.61 0.38 1.7 98.21
DPDNET (Wang et al., 2022) 98.57 14 6.04 93.95
MSF-Net (Chen et al., 2022) 97.35 2.6 15 84.37
The proposed method 99.71 0.28 2 97.98
ResNet Classifier Using Shearlet-Based Features for Detecting Change in Satellite Images
433

method, because the TN result of the other methods
was very low compared to the result of the proposed
method. Accordingly, the FP result of the proposed
method was better.
4 CONCLUSION AND
PERSPECTIVES
In this work, we presented a method of change
detection based on Shearlet transform, CNN and
ResNet152. The Shearlet transform allowed decom-
posing the two input images into low and high fre-
quencies. Then, reconstructing them to smooth the
two input images. After that, the labels (changed, un-
changed) were detected using the CNN network to use
them in Resnet. Afterward, the ResNet was generated
to extract the features using many blocks and generat-
ing their subtraction. Subsequently, the classifier was
employed to detect the change. Despite its good re-
sults and high efficiency compared to the methods in-
troduced in the first approach. This method is charac-
terised by the shearlet and two networks where each
networks is composed by many convolutional layers.
As far as the shearlet transform is concerned, it allows
to facilitate the treatement of the two input images.
But, this method can cause problems in the treatment
of the hyperspectral images.
Therefore, in future works, we will further explore
our method to enhance our network or create other
networks to detect the change variance.
REFERENCES
Bortoloti, F. D., Tavares, J., Rauber, T. W., Ciarelli, P.
M., and Botelho, R. C. G. (2022). An annotated im-
age database of building facades categorized into land
uses for object detection using deep learning. Machine
Vision and Applications, 33(5), 1-16.
Brahim, E., Bouzidi, S., and Barhoumi, W. (2021). Change
detection in optical remote sensing images using
shearlet transform and convolutional neural networks.
In 2021 IEEE/ACS 18th International Conference on
Computer Systems and Applications (AICCSA), (pp.
1-7).
Chen, J., Fan, J., Zhang, M., Zhou, Y., and Shen, C. (2022).
MSF-Net: A Multiscale Supervised Fusion Network
for Building Change Detection in High-Resolution
Remote Sensing Images. IEEE Access, 10, 30925-
30938.
Dong, H., Ma, W., Wu, Y., Zhang, J., and Jiao, L.
(2020). Self-supervised representation learning for re-
mote sensing image change detection based on tem-
poral prediction. Remote Sensing, 12(11), 1868.
Han, M., Li, R., and Zhang, C. (2022). LWCDNet: A
Lightweight Fully Convolution Network for Change
Detection in Optical Remote Sensing Imagery. IEEE
Geoscience and Remote Sensing Letters, 19, 1-5.
Li, X., Du, Z., Huang, Y., and Tan, Z.(2021). A deep trans-
lation (GAN) based change detection network for op-
tical and SAR remote sensing images. ISPRS Journal
of Photogrammetry and Remote Sensing, 179, 14-34.
Liu, M., Shi, Q., Liu, P., and Wan, C. (2020). Siamese
Generative Adversarial Network for Change Detec-
tion Under Different Scales. In IGARSS 2020-2020
IEEE International Geoscience and Remote Sensing
Symposium (pp. 2543-2546). IEEE.
Mittal, S., Srivastava, S., and Jayanth, J. P. (2022). A Survey
of Deep Learning Techniques for Underwater Image
Classification. IEEE Transactions on Neural Networks
and Learning Systems.
Shi, Q., Liu, M., Li, S., Liu, X., Wang, F., and Zhang,
L. (2021). A deeply supervised attention metric-based
network and an open aerial image dataset for remote
sensing change detection. IEEE Transactions on Geo-
science and Remote Sensing, PP(99):1-16.
Shi, K., Bai, L., Wang, Z., Tong, X., Mulvenna, M. D., and
Bond, R. R. (2022). Photovoltaic Installations Change
Detection from Remote Sensing Images Using Deep
Learning. In IGARSS IEEE International Geoscience
and Remote Sensing Symposium (pp. 3231-3234).
Wang, J., Gao, F., Dong, J., Du, Q., and Li, H. C. (2022).
Change Detection From Synthetic Aperture Radar Im-
ages via Dual Path Denoising Network. IEEE Journal
of Selected Topics in Applied Earth Observations and
Remote Sensing, 15, 2667-2680.
Zhang, H., Liu, J., and Xiao, L. (2020). Bipartite Resid-
ual Network for Change Detection in Heterogeneous
Optical and Radar Images. In IGARSS IEEE Inter-
national Geoscience and Remote Sensing Symposium
(pp. 332-335).
Zhang, X., He, L., Qin, K., Dang, Q., Si, H., Tang, X.,
and Jiao, L. (2022). SMD-Net: Siamese Multi-Scale
Difference-Enhancement Network for Change Detec-
tion in Remote Sensing. Remote Sensing, 14(7), 1580.
VISAPP 2023 - 18th International Conference on Computer Vision Theory and Applications
434
