
Optimizing CAV Driving Behaviour to Reduce Traffic Congestion
and GHG Emissions
Saad Roustom
a
and Hajo Ribberink
Natural Resources Canada, CanmetEnergy, 1 Haanel Dr, Ottawa, ON, Canada
© His Majesty the King in right of Canada as represented by the minister of Natural Resources Canada, 2023
Keywords: Connected and Automated Vehicles, Driving Behaviour, Traffic Performance, GHG Emissions.
Abstract: This study was conducted to identify an optimal driving behaviour of connected and automated vehicles
(CAV) that can reduce traffic congestion and GHG emissions under different traffic demand levels. The study
employed traffic simulations at the meso scale for the City of Ottawa, Canada, to assess traffic performance
and used correlation models to estimate GHG emissions. Aggressive CAVs showed the greatest potential to
enhance traffic performance and reduce GHG emissions under all traffic demand levels. The results show that
Aggressive CAVs can increase highway capacity and lower vehicle travel time in comparison to Driver
Operated Vehicles (DOVs) or CAVs with a less aggressive driving style. The findings of the study indicate
that CAVs with aggressive driving behavior can play a crucial role in enhancing traffic performance and in
helping to mitigate the adverse impact of transportation on the environment. The results of this study aim to
encourage regulatory bodies to adopt effective CAV-related policies that can enhance traffic performance and
reduce GHG emissions.
1 INTRODUCTION
1.1 Background
Automated Vehicles (AVs) use a combination of
sensors and control algorithms to perform driving
functions normally carried out by the driver. Some
modern vehicles are equipped with low-level
automated features such as adaptive cruise control
(ACC), lane-keep assist (LKA), and automatic
emergency braking (AEB). Connected vehicles
(CVs) are vehicles with on-board radios capable of
exchanging information through wireless
communications with other vehicles, infrastructure,
and internet-based devices. Information generally
exchanged includes position, direction, speed, and
intent which gets presented to other road users as
either safety or mobility advisories. The combination
of these technologies, a connected and automated
vehicle (CAV), has the potential of significantly
reducing the number of collisions, reducing
congestion, reducing greenhouse gas (GHG)
emissions, and improving mobility. However, the
shift towards new transportation behaviours due to
a
https://orcid.org/0000-0001-7648-5436
automation may also increase greenhouse gas
emissions due to potentially higher vehicle-
kilometers travelled (VKT) and a shift towards new
models of transportation, such as Mobility-as-a-
Service (MAAS), and self-parking capabilities.
Due to the novel and cooperative nature of CAV
technologies, it becomes difficult to assess its impact
in real-world scenario, as some CAV applications
work most effectively at high penetration rates and
are affected by a multitude of environmental
variables. Assessing the impacts of CAVs in a
simulated environment presents itself as a viable
precursor to real-world testing, and results may
provide insight to help guide policy development.
1.2 Objectives
This objective of this study was to assess whether the
specific driving behaviour of CAVs can actively be
utilized to reduce congestion and GHG emissions
from transportation. This was done by investigating
the impact of homogenous CAV vehicle fleets on the
traffic performance and associated GHG emissions
for the City of Ottawa, Canada, through a
198
Roustom, S. and Ribberink, H.
Optimizing CAV Driving Behaviour to Reduce Traffic Congestion and GHG Emissions.
DOI: 10.5220/0011792500003479
In Proceedings of the 9th International Conference on Vehicle Technology and Intelligent Transport Systems (VEHITS 2023), pages 198-205
ISBN: 978-989-758-652-1; ISSN: 2184-495X
Copyright
c
2023 by SCITEPRESS – Science and Technology Publications, Lda. Under CC license (CC BY-NC-ND 4.0)

combination of traffic simulations at the meso scale
and an emissions calculation method based on
emissions correlations developed from micro
simulations results. The study evaluated scenarios
characterized by different CAV driving behaviours
and different traffic demand levels. The results of this
study aim to inform regulatory bodies to support the
development of effective CAV- related policies to
promote the environmentally efficient
implementation of CAV technologies.
2 LITERATURE REVIEW
CAVs have a great potential to improve traffic
performance due to their ability to travel with small
headways and smoother traffic flow. Most studies
confirm that such technology can enhance traffic
characteristics and reduce congestion. However,
there is some uncertainty on optimal driving
behaviour parameters that can increase its efficiency.
It is possible that at initial stages of CAV deployment,
CAVs will have a more cautious driving behaviour to
take into consideration user preference, safety and
comfort (Atkins Ltd, 2016). Cautious CAVs may
potentially decrease effective capacity and deteriorate
traffic performance especially in a high demand and
high-speed traffic environment according to a micro
simulation study (Atkins Ltd, 2016). A micro
simulation study evaluated the impact of AVs on
network capacity with different AV driving
parameters. The study found that capacity increases
quasi-linearly with higher AV penetration rates and
that at full AV penetration rate, road capacity
increases by 16% (Lu et al., 2020). Another micro
simulation study reports that AVs at full penetration
rates and under high volumes can improve traffic
performance, but also decrease it at lower traffic
volumes (Bohm & Häger, 2015). AVs can also result
in a better level of service on single-lane roads by
reducing speed deviations and delays according to a
micro simulation study (Wang & Wang, 2017). The
study concludes that benefits of CAVs are achieved
under high levels of connectivity and automation (i.e.,
an aggressive drive style). Another micro-simulation
based study simulated AVs on a network of 13
intersections and total distance of 4.5 km. The study
found out that at increased AV penetration rates, the
traffic flow is improved with a reduction of average
delay up to 31%. An agent-based approach study
found that a full AV traffic environment can increase
the capacity of a multi-lane highway by 250%
compared to regular driver-operated vehicles
(Abdulsattar et al., 2020).
Studies also show that CAVs employment could
potentially reduce GHG emissions or increase it. A
modelling study utilized the SUMO microsimulation
package to examine the impact of different degrees of
vehicle automation on emissions in an urban network.
The results show that acceleration is high highly
correlated with emissions. Although automated
vehicles can achieve higher acceleration values
causing higher emissions, this was compensated by
giving them lower rates of acceleration for higher
automation levels. The results of this study concluded
that automated vehicles could reduce carbon
monoxide (CO) emissions by 38.5%, carbon dioxide
(CO
2
) emissions by 17.0% and hydrocarbons (HC)
emissions by 36.3% for the best scenario in which the
penetration rate of automated vehicles is 100%
(Biramo & Mekonnen, 2022). A similar study
explored the environmental impacts of AVs along an
urban freeway corridor using Vissim and EPA’s
MOVES. The study considered AV penetration rates
of 10%, 20% and 30%. The study found out that only
a 5% decrease in emissions can be expected with AV
technology at a 30% penetration rate. However, this
comes at cost of penalizing travel time by up to 13%
for both AVs and conventional vehicles when
compared to existing conditions (Tomás et al., 2020).
A micro simulation-based study found that
Aggressive AVs can reduce GHG emissions by 26%
in an uninterrupted flow network and by 3% in an
interrupted flow network under high traffic demand
levels (Stogios et al., 2019). A similar study
concluded that in a congested urban network, a
maximum reduction of CO
2
emissions is achieved by
4% at a full AV penetration rate (Conlon & Lin,
2019). Other studies show that the reduction in
emissions due to enhanced traffic performance can be
overturned by an increase in traffic demand causing
more GHG emissions (Brown et al., 2014; Wadud et
al., 2016).
While many studies have been conducted to
investigate the impact of CAV driving behaviours on
traffic performance and GHG emissions using micro
simulations, there is a lack of understanding on how
CAVs will impact congestion and emissions in a
larger road network such as a city-wide model. The
study presented in this article assesses different CAV
driving behaviours at the scale of a city with over one
million inhabitants using meso simulation of
scenarios with different CAV driving styles and under
different traffic demand levels. The evaluation of
CAV driving behaviour at the scale of a large city is
critical to creating a deeper understanding of the
potential of CAVs to improve traffic performance and
reduce emissions, because the larger road network in
Optimizing CAV Driving Behaviour to Reduce Traffic Congestion and GHG Emissions
199

the city will allow CAVs to choose different routes,
for instance to avoid congestion, and their impact on
traffic performance will differ from results obtained
through micro simulation studies.
3 METHODOLOGIES
The approach followed to investigate whether the
level of congestion in a city can be reduced by
actively adjusting the driving behaviour of CAVs was
to simulate a comprehensive set of scenarios covering
a wide range of driving behaviours and traffic
volumes. For each of these scenarios, the evaluation
of the impact of CAVs on traffic performance and
GHG emissions involved meso simulation of the
traffic using the Ottawa Regional Model (MMM
Group Limited, 2014) using the Dynameq traffic
simulation software (INRO, n.d.-a), and applying
emission correlation models to the simulation results
in a post-processing step. The study took into
consideration the regular driver-operated vehicle
behaviour along with three CAV driving behaviours:
Cautious, Normal and Aggressive. The emission
correlations were developed in a different project by
Carleton University (Roustom, 2022), and were based
on micro simulation studies for four main routes in
the City of Ottawa utilizing the same driving
behaviours as used in this study. Carleton University
developed emission regression models that can be
used to estimate the emissions of CAVs for the total
City of Ottawa. The meso simulation tool Dynameq
does not have the capability to calculate emissions for
vehicles in its simulations. Therefore, the models
provided by Carleton University were used in a post-
processing step for GHG emission estimation.
A combination of micro and meso simulation was
needed for this research. The micro simulation
conducted earlier by Carleton University was
required for the detailed evaluation of the driving
behaviour of CAVs. CAVs behave differently on the
road than Driver Operated Vehicles (DOVs), for
instance because their connectivity allows them to
drive closer together. Meso simulation was necessary
to understand how the different driving behaviour of
CAVs would impact the overall traffic flow and
congestion in a large city.
3.1 Meso Simulations
The Ottawa Regional Traffic model (MMM Group
Limited, 2014) was obtained from the City of Ottawa
together with a forecast of expected travel volumes
for the year 2031. The model covers the total road
network of the Ottawa-Gatineau region, consisting of
over 700 traffic zones, over 5,000 intersections and
close to 25,000 road segments. The Ottawa Regional
Traffic Model is implemented in the macro
simulation tool Emme (INRO, n.d.-b) and was
calibrated using data from Ottawa’s Origin-
Destination Survey (MMM Group Limited, 2014).
After receiving the calibrated Ottawa Regional
Traffic Model from the City of Ottawa, it was
exported from Emme into Dynameq and adjusted for
functionality in the meso simulation tool. This
involved adjusting the number of lanes and the layout
of intersections and roads on all major through routes
where needed. Traffic lights were added to all major
intersections, and intersections in the downtown area
were given appropriate stop/yield characteristics.
Signal controls were generated using Dynameq’s
signal control optimizer routine and may not
necessarily reflect the actual signal controls in
Ottawa.
A total of 12 scenarios were evaluated to find the
optimal driving characteristics of CAVs under
different traffic conditions. DOV, Cautious, Normal
and Aggressive driving behaviours were simulated
with homogenous CAV fleets and traffic flows of
80%, 100% and 120% of the forecasted morning peak
hour volumes for the year 2031. Simulations were
optimized to result in minimum overall travel time for
the total fleet. The parameters of each driving
behaviour are shown in Table 1. The values were
taken from the Carleton University study (Roustom,
2022). The simulation runs for the City of Ottawa
were conducted for the period of 6:30 AM to 11:00
AM. Vehicles were added to the network during the
first two and a half hours of the simulation (6:30 AM
to 9:00 AM), and the simulations continued for
another two hours to allow all vehicles to reach their
destinations. General traffic characteristics such as
vehicle-hours travelled (VHT) and vehicle-
kilometers travelled (VKT) were aggregated over the
full 4.5-hour simulation period. The meso-simulation
outputs included road volumes, average speeds,
density, and other road characteristics such as the
number of lanes and link length.
A diverse fleet of passenger and commercial
vehicles was used in the simulations, reflecting
differences in vehicle size experienced in normal
traffic. In all simulations, the vehicle fleet consisted
of either 100% DOVs or 100% CAVs of a certain
type. The rates of deployment and adoption of CAV
technology are dependent on several factors such as
technological advancement, consumer acceptance
and policy regulations. This study assesses the
scenarios
using 100% CAV fleets to investigate the
VEHITS 2023 - 9th International Conference on Vehicle Technology and Intelligent Transport Systems
200

Table 1: Traffic behaviour parameters.
Driving
Behaviour
Effective length
(m)
Response
Time
(seconds)
DOV Car length + 2 1
Cautious CAV Car length + 1.5 1.5
Normal CAV Car length + 1.5 0.9
Aggressive
CAV
Car length + 1 0.6
full potential of this technology. Future work can be
done to study transition phases which will include a
mixed fleet vehicle environment.
3.2 GHG Emission Estimation
Using the results of the micro simulations, Carleton
University calculated detailed second-by-second
GHG emissions for four example roads in the City of
Ottawa. The example roads each had different traffic
characteristics, representing typical congested traffic
conditions in the downtown area (Bronson Avenue),
arterial roads with short distances between
intersections (Baseline Avenue), arterial roads with
large distances between intersections, and highway
traffic. Additionally, a regression analysis was
performed on the GHG emission results to develop
correlations between the GHG emission intensity (kg
CO
2
eq.) and parameters displaying vehicle
movement characteristics (average speed and average
vehicle density) and road information (road segment
length and number of lanes). The correlations were
used in this study in a post-processing step to
calculate overall GHG emissions for the vehicle fleet
in Ottawa based upon traffic information per road
segment from the Dynameq simulations. Since an
emission correlation was developed for each of the
four example routes, in the calculation of the
emissions for the total city the appropriate correlation
was selected per road segment according to the posted
speed limit of the segment:
4 RESULTS
4.1 Traffic Performance
For each scenario, the total amount of vehicle-hours
travelled and vehicle-kilometers travelled were
determined by aggregating the travel times of all
vehicles in the meso simulation. Table 2 and Table 3
present the results for the evaluated scenarios. The
results in Table 2 show that Aggressive CAVs were
able to reduce total vehicle-hours travelled by 14.2%.
CAVs with normal driving behaviour also reduce
travel time compared to DOVs, but the effect is much
smaller than for Aggressive CAVs. CAVs with a
cautious driving style increase travel time for all
traffic flow levels and cause higher levels
of congestion. The small differences in VKT between
Table 2: Vehicle-hours travelled (VHT) results for the
Ottawa Regional Model under different scenarios.
Case
Traffic
Flow
Driving
Behaviour
Vehicle-hour Travelled
80%
DOV 69,668
Compare to
DOV 80%
Cautious 74,951 7.6%
Normal 68,864 -1.2%
Aggressive 67,463 -3.2%
100%
DOV 90,898
Compare to
DOV 100%
Cautious 106,867 17.6%
Normal 89,024 -2.1%
Aggressive 85,134 -6.3%
120%
DOV 124,106
Compare to
DOV 120%
Cautious 163,603 31.8%
Normal 118,597 -4.4%
Aggressive 106,507 -14.2%
Table 3: Vehicle-kilometers travelled (VKT) results for the
Ottawa Regional Model under different scenarios.
Case
Vehicle-kilometers
Travelled
Traffic
Flow
Driving
Behaviour
80%
DOV 4,150,204
Compare
to DOV
80%
Cautious 4,115,115 -0.8%
Normal 4,160,152 1.1%
Aggressive 4,173,698 0.3%
100%
DOV 5,144,241
Compare
to
DOV100%
Cautious 5,179,543 0.7%
Normal 5,154,417 -0.5%
Aggressive 5,193,811 0.8%
120%
DOV 6,239,120
Compare
to DOV
120%
Cautious 6,434,729 3.1%
Normal 6,221,226 -3.4%
A
gg
ressive 6,217,404 -0.1%
Optimizing CAV Driving Behaviour to Reduce Traffic Congestion and GHG Emissions
201
CAV and DOV scenarios indicate that differences in
VHT are mostly due to differences in traffic
conditions, i.e., the level of congestion.
It is clear from Table 2 that CAVs with aggressive
driving behaviour can obtain the largest reduction in
average travel time compared to DOVs for all traffic
flow levels. To better demonstrate the impact of CAV
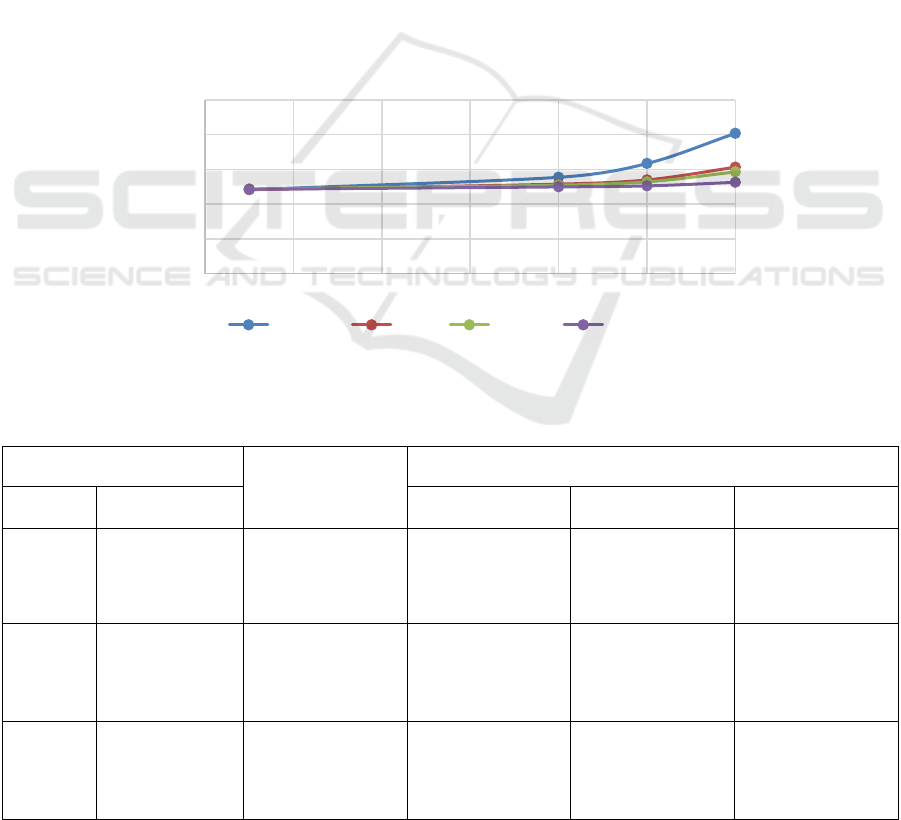
driving behaviour and traffic volume on travel time, the
average travel time per vehicle was calculated for each
scenario. The results are displayed in Figure together
with the average travel time for uncongested
conditions (at 10% traffic flow). The different lines in
the figure illustrate the increase in average travel time
with an increase in traffic volume for a certain driving
behaviour. The DOV scenarios showed a 19% increase
in average travel time when traffic volume increased
from 80% to 120% of the morning commute volume.
Cautious CAVs experienced a 46% increase in average
travel time, while the increase in average travel time
for CAVs with aggressive driving behaviour was only
5%, which corresponds to less than 30% of the increase
in travel time experienced by DOVs.
The results of Figure 1 indicate that the
introduction of CAVs with aggressive driving
behaviour has the potential to lead to a drastic
reduction in congestion and similarly limit the
corresponding increase in average travel time, thanks
to their ability to travel with shorter inter-vehicle
distances and creating a more harmonized traffic
flow.
The total of all vehicle-hours travelled (VHT) by
the vehicle fleet on different road types and the
corresponding total of all vehicle-kilometres travelled
(VKT) driven on these roads during the morning
commute period was compared for the simulated
scenarios. Table 4 displays the VHT values for all
scenarios and the difference between the VHT for the
CAV scenarios and their respective DOV scenarios.
In a similar way, Table displays the VKT values for
all scenarios and the difference between the VKT for
the CAV scenarios and their corresponding DOV
scenarios. In general, the overall number of
kilometers driven in the city is similar for each of the
driving behaviours, as was shown in Table 3.
Figure 1: Comparison of average travel time for each driving behaviour under different traffic flow conditions.
Table 4: Vehicle-hours travelled (VHT) for different road classifications for all scenarios, and the difference in VHT of CAV
scenarios compared to the corresponding DOV scenario.
0
5
10
15
20
25
0% 20% 40% 60% 80% 100% 120%
Average Travel Time
(minutes)
Traffic Flow %
Cautious DOV Normal Aggressive
Scenario
Highway
Arterial and Other Roads
Traffic
Flow
Driving
Behaviou
r
0 - 50 km/h 50 - 65 km/h 65 - 100 km/h
80%
DOV 21,210 19,419 8,372 20,667
Cautious 21,357 1% 21,619 11% 9,640 15% 22,335 8%
Normal 21,091 -1% 19,176 -1% 8,200 -2% 20,398 -1%
Aggressive 20,771 -2% 18,680 -4% 7,926 -5% 20,086 -3%
100%
DOV 26,220 26,205 11,690 26,784
Cautious 28,018 7% 32,918 26% 14,163 21% 31,769 19%
Normal 26,088 -1% 25,339 -3% 11,221 -4% 26,376 -2%
Aggressive 25,923 -1% 23,913 -9% 10,165 -13% 25,133 -6%
120%
DOV 33,285
37,783
15,841
37,198
Cautious 38,202 15% 54,423 44% 20,749 31% 50,228 35%
Normal 32,962 -1% 35,292 -7% 15,201 -4% 35,143 -6%
Aggressive 31,201 -6% 30,726 -19% 13,184 -17% 31,396 -16%
VEHITS 2023 - 9th International Conference on Vehicle Technology and Intelligent Transport Systems
202

Table 5: Vehicle-kilometers travelled (VKT) for different road classifications for all scenarios, and the difference in VKT of
CAV scenarios compared to the corresponding DOV scenario.
Scenario
Highway
Arterial and Other Roads
Traffic
Flow
Driving
Behaviou
r
0 - 50 km/h 50 - 65 km/h 65 - 100 km/h
80%
DOV 1,772,901 726,219
311,835
1,339,249
Cautious 1,605,509 -9% 776,531 7% 346,243 11% 1,386,832 4%
Normal 1,801,163 2% 720,948 -1% 307,091 -2% 1,330,950
-
1%
Aggressive 1,841,164 4% 710,527 -2% 299,875 -4% 1,322,132
-
1%
100%
DOV 2,080,292 948,865 418,597 1,696,487
Cautious 1,865,808 -10% 1,065,292 12% 459,008 10% 1,789,435 5%
Normal 2,135,973 3% 929,953 -2% 405,665 -3% 1,682,826
-
1%
Aggressive 2,272,802 9% 897,972 -5% 381,455 -9% 1,641,582
-
3%
120%
DOV 2,344,502 1,239,439 531,695
2,123,484
Cautious 2,073,624 -12% 1,468,212 18% 569,485 7% 2,323,408 9%
Normal 2,400,831 2% 1,200,553 -3% 522,348 -2% 2,097,494
-
1%
Aggressive 2,614,169 12% 1,115,977 -10% 475,643 -11% 2,011,615
-
5%
However, this does not mean that each scenario had
the same traffic characteristics. This can be seen from
analyzing the VKT results aggregated for different
road classifications according to their type and posted
speed limit, as presented in Table. These more
detailed results show different aspects of vehicle
movements under the various scenarios. Compared to
DOVs, Aggressive CAVs drive fewer kilometers on
arterial roads and on other roads but have higher VKT
values for highways in combination with lower VHT
values for this road type. This indicates that
Aggressive driving behaviour increases highway
capacity allowing for more vehicle-kilometers
travelled with lower VHT. Cautious CAVs on the
other hand, have significantly increased VHT values
and higher VKT values on arterial and other roads in
comparison to DOV. This reflects the situation that
vehicles are avoiding the more congested highways,
which is also demonstrated by the relatively higher
VHT values but lower VKT values for highways
under this scenario.
4.2 GHG Emissions
The GHG emissions of the total vehicle fleet in
Ottawa were calculated and expressed as total
equivalent CO
2
emissions produced throughout the
total morning commute simulation period. The GHG
emission results are shown in Table 6.
Table 6: GHG emissions for the total vehicle fleet from the
Ottawa Regional Model under different scenarios.
Case
Traffic
Flow
Driving
Behaviour
CO2 eq kg
80%
DOV 809,147
Compare to
DOV 80%
Cautious 887,518 9.7%
Normal 769,484 -4.9%
Aggressive 763,048 -5.7%
100%
DOV
1,036,577
Compare to
DOV 100%
Cautious 1,158,066 11.7%
Normal 984,645 -5.0%
A
gg
ressive 975,155 -5.9%
120%
DOV 1,302,093
Compare to
DOV 120%
Cautious 1,493,366 14.7%
Normal 1,230,897 -5.5%
A
gg
ressive 1,195,355 -8.2%
The trends in total GHG emissions for the different
scenarios are consistent with the results for the travel
time as shown
. CAVs with CAVs with an aggressive
driving behaviour having the largest reduction in
GHG emissions in comparison to DOVs.
The relative reduction in GHG emissions
increases at higher traffic volumes, indicating a larger
benefit of an aggressive driving style for higher levels
of congestion as shown in figure 2 which displays the
Optimizing CAV Driving Behaviour to Reduce Traffic Congestion and GHG Emissions
203

average amount of GHG emissions per vehicle for
each scenario under different traffic demand
conditions. GHG emission results for CAVs with a
normal driving behaviour follow similar emissions
trends as for the aggressive driving style, but with
lower reduction percentages. Cautious CAVs cause
an increase in GHG emissions for all traffic flow
levels.
5 CONCLUSIONS
This study employed meso simulations and emission
estimation to investigate whether equipping CAVs
with a specific driving style could result in a reduction
in congestion, in average travel time and in GHG
emissions. This was done by assessing the impact of
CAV vehicle fleets on traffic performance and GHG
emissions for the City of Ottawa in Canada. The study
evaluated four different driving behaviours: DOVs,
Cautious CAVs, Normal CAVs, and Aggressive
CAVs. The city-wide model was simulated with
traffic volumes equal to 80%, 100% and 120% of
peak-hour traffic forecasted for the year 2031.The
results of the simulations show that an aggressive
driving style is the most optimal driving behaviour for
CAVs in all scenarios, and that equipping CAVs with
this driving style can lead to significant reductions in
travel time and in GHG emissions compared to
DOVs, especially at higher traffic volumes. The
detailed results of the meso simulations showed that
equipping CAVs with an aggressive driving style will
increase road capacity, allowing more vehicles to use
the highway and effectively reduce congestion on
arterial and other roads.
The results of the study presented in this article
clearly indicate that the driving behaviour of CAVs
can be utilized to reduce travel time and congestion
in an urban environment when employing a
homogenous fleet of 100% CAVs. However, it is
unclear what level of penetration of Aggressive
CAVs in a mixed CAV/DOV fleet will be necessary
to start seeing the benefits of enhanced traffic
movement. Similarly, it is unknown how fleets of
CAVs with different driving behaviours (Cautious,
Normal, and Aggressive) will impact congestion and
transportation emissions. These subjects will be part
of ongoing research on this topic.
ACKNOWLEDGEMENTS
Funding for this study was received from Transport
Canada under the ecoTECHNOLOGY for Vehicles
program. The authors express great thanks to the City
of Ottawa and the TRANS committee for sharing the
Ottawa Regional Traffic Model for use in this study.
REFERENCES
Abdulsattar, H., Siam, M. R. K., & Wang, H. (2020).
Characterisation of the impacts of autonomous driving
on highway capacity in a mixed traffic environment: an
agent-based approach. IET Intelligent Transport
Systems, 14, 1132 –1141. https://doi.org/10.1049/iet-
its.2019.0285
Atkins Ltd. (2016). Research on the Impacts of Connected
and Autonomous Vehicles (CAVs) on Traffic Flow
Summary Report Department for Transport.
https://trid.trb.org/view/1448450
Biramo, Z. B., & Mekonnen, A. A. (2022). Modeling the
potential impacts of automated vehicles on pollutant
emissions under different scenarios of a test track.
Environmental Systems Research, 11(1), 28.
https://doi.org/10.1186/s40068-022-00276-2
Bohm, F., & Häger, K. (2015). Introduction of Autonomous
Vehicles in the Swedish Traffic System : Effects and
Changes Due to the New Self-Driving Car Technology.
https://www.semanticscholar.org/paper/Introduction-
of-Autonomous-Vehicles-in-the-Swedish-Bohm-
H%C3%A4ger/ea2be6805b2adaba043df516e132f128
9ce103cb#citing-papers
Brown, A., Gonder, J., & Repac, B. (2014). An Analysis of
Possible Energy Impacts of Automated Vehicles. In G.
Meyer & S. Beiker (Eds.), Road Vehicle Automation
(pp. 137–153). Springer International Publishing.
https://doi.org/10.1007/978-3-319-05990-7_13
Conlon, J., & Lin, J. (2019). Greenhouse Gas Emission
Impact of Autonomous Vehicle Introduction in an
Urban Network. Transportation Research Record,
2673(5), 142–152. https://doi.org/10.1177/03611
98119839970
INRO. (n.d.-a). Dynameq.
INRO. (n.d.-b). Emme.
Lu, Q., Tettamanti, T., Hörcher, D., & Varga, I. (2020). The
impact of autonomous vehicles on urban traffic network
capacity: an experimental analysis by microscopic
traffic simulation. Transportation Letters, 12(8), 540–
549. https://doi.org/10.1080/19427867.2019.1662561
MMM Group Limited. (2014). TRANS Model – Evolution
of the TRANS Regional Travel Forecasting Model.
Roustom, S. G. (2022). Environmental Impacts of
Connected and Automated Vehicles Considering
Traffic Flow and Road Characteristics. Thesis
(M.App.Sc.) - Carleton University, 2022.
Tomás, R. F., Fernandes, P., Macedo, E., Bandeira, J. M.,
& Coelho, M. C. (2020). Assessing the emission
VEHITS 2023 - 9th International Conference on Vehicle Technology and Intelligent Transport Systems
204

impacts of autonomous vehicles on metropolitan
freeways. Transportation Research Procedia, 47, 617–
624. https://doi.org/https://doi.org/10.1016/j.trpro.2020
.03.139
Stogios, C., Kasraian, D., Roorda, M. J., & Hatzopoulou,
M. (2019). Simulating impacts of automated driving
behavior and traffic conditions on vehicle emissions.
Transportation Research Part D: Transport and
Environment, 76, 176–192. https://doi.org/10.1016/
j.trd.2019.09.020
Wadud, Z., MacKenzie, D., & Leiby, P. (2016). Help or
hindrance? The travel, energy and carbon impacts of
highly automated vehicles. Transportation Research
Part A: Policy and Practice, 86, 1–18.
https://doi.org/10.1016/j.tra.2015.12.001
Wang, Y., & Wang, L. (2017). Autonomous vehicles’
performance on single lane road: A simulation under
VISSIM environment. 2017 10th International
Congress on Image and Signal Processing, BioMedical
Engineering and Informatics (CISP-BMEI), 1–5.
https://doi.org/10.1109/CISP-BMEI.2017.8302162
Optimizing CAV Driving Behaviour to Reduce Traffic Congestion and GHG Emissions
205
