
Software Updates Monitoring & Anomaly Detection
Imanol Etxezarreta Martinez
a
, David Garc
´
ıa Villaescusa
b
, Imanol Mugarza
c
, Irune Yarza
d
and Irune Agirre
e
Ikerlan Technology Research Centre, Basque Research and Technology Alliance (BRTA), Spain
Keywords:
Software Update, Patches, Monitoring, Anomaly Detection, Security.
Abstract:
Security is becoming a must in the current all-connected paradigm. Software updates are essential to fix
any new identified security flaw or vulnerability that may appear as they normally are the fastest and cheapest
solution. Nevertheless, a software update targeted to fix a determined issue could end up in a different problem.
In order to detect these new issues, systems should be able to gather monitoring data so that possible effects
and consequences are observed and characterized. This is specially relevant when upgrades are performed
remotely, like in road vehicles, and no prior outcome information is available to the manufacturer. In this
paper, a software updates monitoring, an anomaly detection procedure and a proof-of-concept are presented.
The monitoring and anomaly detection approach enable the detection of performance anomalies that could
result for instance, from malicious code installation during an update. This offline monitoring information can
also be used for further system design improvements and to facilitate the review and assessing processes of
security issues.
1 INTRODUCTION
Next generation computing systems are expected to
offer much more computation capabilities, autonomy
and higher levels of interconnection. Data sharing
and processing technologies are incorporated to the
connected products, which enable information ex-
change among devices and system over a communi-
cation network. Given that in this scenario, cyber-
attackers might capture sensible information or tam-
per the communications with the devices. Therefore,
these systems and products should incorporate secu-
rity mechanisms to mitigate those risks. Besides,
software updates management is an element of a
complete and sound cybersecurity strategy (Mugarza
et al., 2017). Indeed, regulatory requirements related
to software updates are being established, for example
in the European Cyber Resilience Act (Chiara, 2022),
Runtime monitoring is an useful approach that re-
lies on observing the runtime execution behaviour of
a target system in its final environment with differ-
ent potential applications, such as, verification, error
a
https://orcid.org/0000-0002-3738-8753
b
https://orcid.org/0000-0003-2497-6553
c
https://orcid.org/0000-0002-6311-0632
d
https://orcid.org/0000-0002-3607-7443
e
https://orcid.org/0000-0002-9507-8841
logging, real-time fault detection and advanced main-
tenance procedures. Furthermore, the ability of re-
placing or adding new software components to the
system causes the number of potential system vari-
ants to grow exponentially. As with any other safety
system development, these system variants shall be
verified and validated. In this case, it is of special
interest to guarantee that the software update is com-
patible with the existing system through integration
testing. On this phase monitoring the system at run-
time is of paramount importance. In addition, soft-
ware update mechanisms become a new entry point
for security attackers and appropriate security coun-
termeasures shall be deployed to prevent them, which
could be improved by monitoring the system at run-
time. This monitoring could gather a constant feed-
back from remote devices and it will be very helpful
for decision making of the revision process during the
product life cycle, it is possible to improve the de-
sign by optimizing it accordingly to the gathered in-
formation. In this way, the system can continuously
improve the resource usage and avoid oversizing to
accommodate new software functionalities if needed.
Regarding anomaly detection, the main focus of
this paper, monitoring information is used to identify
possible performance anomalies and confirm that the
software update does not compromise system relia-
Etxezarreta Martinez, I., García Villaescusa, D., Mugarza, I., Yarza, I. and Agirre, I.
Software Updates Monitoring Anomaly Detection.
DOI: 10.5220/0011822000003482
In Proceedings of the 8th International Conference on Internet of Things, Big Data and Security (IoTBDS 2023), pages 115-122
ISBN: 978-989-758-643-9; ISSN: 2184-4976
Copyright
c
2023 by SCITEPRESS – Science and Technology Publications, Lda. Under CC license (CC BY-NC-ND 4.0)
115

bility and operational features. For this purpose, the
system is monitored in two phases, following the ap-
proach presented in (Mugarza et al., 2021). Firstly, at
design time and before the software update process,
an initial system fingerprinting, i.e. profiling, is per-
formed based on execution measurements on the fi-
nal system. This profile will provide an initial system
baseline model. Secondly, at runtime and after update
deployment, a new operation time profile will be ob-
tained and compared to the initial one to ensure that it
follows its expected behaviour profile and that there-
fore, the update does not introduce regressions. Based
on the result of the comparison, an action can be taken
(like raising an alarm or stopping the system).
This paper presents a software updates monitor-
ing and anomaly detection approach developed in the
context of the UP2DATE European project (Agirre
et al., 2021). After this introduction, the literature re-
view is provided. Next, the software updates process
cycle proposed within UP2DATE is shown. Follow-
ing, the monitoring and anomaly detection approach
is introduced and results from initial proof-of-concept
results displayed. Lastly, discussions and conclusions
are presented.
2 LITERATURE REVIEW
Security monitoring is a wide topic in cybersecurity,
which is the process of collecting and analysing in-
dicators of potential security malfunctions, threats,
and incidents. For the software update monitoring
and fingerprinting, techniques which aim at detect-
ing unknown worms and viruses are used. In the pro-
cess of analysing and identifying new computer mal-
ware, a vulnerability signature is created (Singh et al.,
2004). Anomaly detection techniques, by means of
identifying unexpected and unusual system patterns,
are also used. In case of already distributed and/or
speeded worms, multiple monitors can be deployed to
detect the malware spread (Kim and Karp, 2004). Dif-
ferent techniques for ransomware fingerprinting and
anomaly detection exist, such as: system functional
behaviour, traffic analysis and content inspection or
performance monitoring. As well, efficient and ac-
curate network monitoring and content inspection is
essential to make sure that all systems operate as in-
tended (Lee et al., 2014).
For the network worms and viruses, the network-
ing monitoring data, such as open ports and band-
width, can be evaluated (Singh et al., 2004). In
that paper, S. Singh et al. proposed the network ad-
dress dispersion estimation as a technique to identify
worms and viruses. For the computation of the dis-
persion, the source and destination IP addresses are
analysed. Demilitarized Zone (DMZ)
1
traces might
also be monitored and analysed for signature detec-
tion, as done in (Kim and Karp, 2004). On the con-
trary, a different malware detection approach is pro-
posed (Kolbitsch et al., 2009), in which the infor-
mation flows between the system calls and the mal-
ware is modelled. To this end, firstly, by means of a
monitor, the system calls are captured, and behaviour
graphs generated. Once the behaviour model is con-
structed, the program is continuously monitored, and
its actual behaviour compared to the previously gen-
erated model. Similarly, dynamic taint analysis and
graph-based techniques for malware detection to de-
tect common malware behaviours is used (Ding et al.,
2018). In this case, the Windows Application Pro-
gramming Interface (API) system calls are monitored.
Online performance modelling and monitoring is
vital to identify, detect and address performance is-
sues, which may have a negative impact in the system.
Indeed, as the time between new software releases
gets significantly short, the problem of thoroughly
evaluating the performance of an updated application
further exacerbates (Cherkasova et al., 2009). Simu-
lated fault injections corresponding with CPU stresses
(Samir and Pahl, 2019; Samir and Pahl, 2020) with in-
finite loops consuming all CPU, memory leaks using
the full memory and workloads that exhaust the sys-
tem resources. The goal of this activity was to eval-
uate the presented anomaly detection and prediction
model to detect inconsistencies at runtime. Similarly,
other experiments performed (Kang et al., 2012) were
focused on CPU utilization, memory utilization, and
system response time metrics. The authors proposed
a Hidden Markov Model based anomaly and predic-
tion model for edge cluster environments. In addi-
tion, a review (Ibidunmoye et al., 2015) of the per-
formance anomaly detection and bottleneck identifi-
cation (PADBI) has presented problems and identi-
fied relevant research questions, challenges, contribu-
tions, trends and open issues. They highlight different
types of commonly observed performance anomalies
and bottlenecks in computing systems and conclude
that existing PADBI systems operate based on one or
more detection strategies and methods, being statisti-
cal and machine learning the two predominant ones in
literature.
A full-stack monitoring and analysis system is
proposed (Jayathilaka et al., 2017; Jayathilaka et al.,
2020) for performance anomaly detection and bot-
tleneck identification in cloud Platform-as-a-Service
1
A DMZ is a perimeter network that protects an organi-
zation’s internal local-area network (LAN) from untrusted
traffic.
IoTBDS 2023 - 8th International Conference on Internet of Things, Big Data and Security
116

(PaaS) systems. The presented system, called Roots,
tracks HTTP and HTTPS requests, and applies di-
verse multiple statistical methods to detect perfor-
mance anomalies. For this purpose, Roots gathers
logs and internal interfaces data, in which high-level
metrics (throughput, incoming requests, latency) and
PaaS invocations and duration are collected. More-
over, a root cause analysis is performed to identify
the performance anomaly root cause by monitoring
and analysing workload and PaaS services data. The
following data from the PaaS kernel invocations are
also captured: timestamp, source application, PaaS
service invocation number, request properties, target
kernel properties and invocation execution time.
For the anomaly detection, anomaly detectors are
deployed, which periodically analyse the collected in-
formation. When an anomaly is detected, an action
listener is triggered by means of anomaly handlers,
such as sending alert emails or displaying dashboard
messages. An online anomaly diagnosis framework
(Tuncer et al., 2018) is also proposed, which lever-
ages the already monitored performance and resource
usage data to learn and detect the signatures of pre-
viously observed anomalies. The framework uses
the tree-based machine learning techniques: decision
tree, random forest and adaptive boosting. Similarly,
a scalable infrastructure for continuous monitoring of
large-scale computing systems and applications (Age-
lastos et al., 2014) is proposed, where the information
they obtain on a system-wide basis to gain insight into
system and application performance includes:
• Network related information: Congestion, Deliv-
ered Bandwidth, Operating System Traffic Band-
width, Average Packet Size and Link Status.
• Shared File System information (e.g. Lustre):
Opens, Closes, Reads and Writes.
• Memory related information: Current Free and
Active.
• CPU information: Utilization (user, sys, idle and
wait).
3 UP2DATE OVER-THE-AIR
SOFTWARE UPDATES
One of the most challenging and relevant steps of an
update management procedure in the industrial envi-
ronment is the definition of a safe and secure process
architecture for the execution of updates (Mugarza
et al., 2021). The industrial system type monitored in
this study is composed by a server, a gateway and an
end-device. The upgradable devices are the gateway
and the end-device. In the overall system more than
one gateway and more than one end-device per gate-
way could exist. However, as matter of simplification
we are only using one of each for the monitoring and
anomaly detection approach definition and proof-of-
concept validation.
The update cycle is composed by a determined
number of steps (Agirre et al., 2021):
1. New Available Update. Updatable software
components and associated safety and security
metadata are stored in the update repository.
2. Design Time Checks. Basic checks before up-
date release.
3. Update Release. Identification of target systems
where the update is applicable, update distribution
and user notification.
4. Virtual Compatibility and Integration Check.
Internal tests before authorizing update installa-
tion in particular device.
5. Download. Transfer of required software, data
and files from the server to the gateway, per-
formed considering security matters.
6. Installation. Store the received files in the repro-
grammable memory of the gateway or the end-
device and set them up to accommodate the new
(or rollback) software.
7. Verification. Check the correctness of the new
software installation, configuration and depen-
dencies with other software updates.
8. Activation. Checks if safety conditions for the
update are given, invalidates and stores old soft-
ware and runs new one, considering the needs of
dependent updates.
9. Online Monitoring. Verify, based on runtime in-
formation, that the system meets its specification,
and that SASE metrics are within their safe and
secure range at system operation: before, during
and after an update.
10. Offline Monitoring. Send runtime information
to a remote server for offline automatic or manual
inspection. This is the monitoring performed for
the anomaly detection. Is performed continuosly.
4 MONITORING
Security monitoring is an essential activity to carry
out for the security management of systems and prod-
ucts, especially in the operation and maintenance
phase. In UP2DATE, two different security monitor-
ing methods are applied: security fingerprinting and
Software Updates Monitoring Anomaly Detection
117
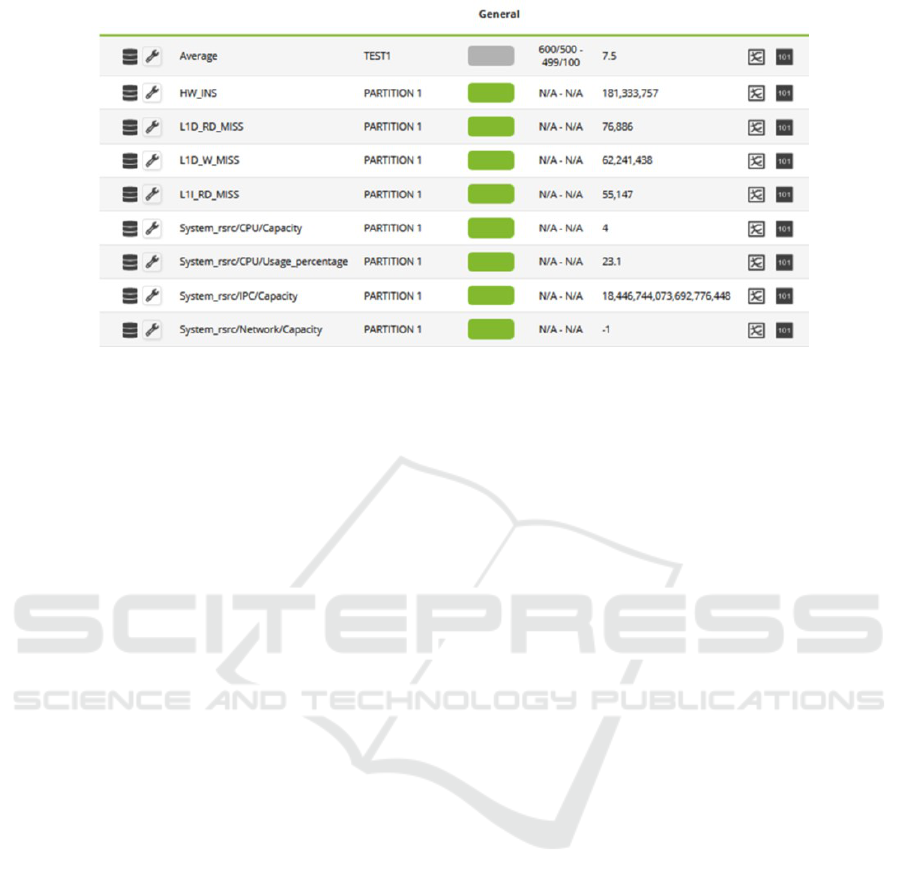
Figure 1: Monitor values in PandoraFMS server.
anomaly detection, and security auditing. Since the
security needs might change through the time, the
monitoring infrastructure and methods could also face
new necessities and enhancements.
The UP2DATE monitoring architecture supports
the possibility to perform application fingerprinting
to detect anomalies that might be related to security
issues. Figure 2 shows the setup of the UP2DATE fin-
gerprinting approach. The applications that are being
monitored include an ‘Event Recorder’ responsible of
measuring the relevant metrics which are then trans-
mitted to the Offline Monitoring partition running on
the gateway.
The Offline Monitoring partition will collect all
the data and perform a data pre-processing task. This
processed data is then send to a remote server for fin-
gerprinting analysis, which consist of a monitoring
system and an anomaly detection tool. To this end,
a monitoring agent is integrated in the gateway. The
key infrastructure for data gathering and communica-
tion is Pandora FMS, an IT monitoring tool that col-
lects information and then processes it to determine
the state of the monitored platforms (L
´
opez, 2010).
The quantity of variables to collect and the number
of possible platforms can both be in the order of hun-
dreds.
On the server side, Pandora stores the data in an
internal SQL-type database. All stored data can be
queried through a REST API. This means that the
anomaly detection engine will be running as an aux-
iliary service. The developers are free to choose the
programming language and environment they desire.
Starting from a set of data collected into a time series,
these libraries can build a model, that is a fingerprint,
of the applications running on a target platform. This
model represents the stable state of the platform in se-
cure conditions, and can be used as a reference to de-
tect anomalies during operation. Whenever an update
is performed, the fingerprinting model must be gen-
erated in a testing environment before the update pro-
cess is executed in the target system. This feedback
mechanism will enable the continuous monitoring of
the system, which will help developers and owners to
correctly address the maintainability of it.
4.1 Event Collection & Processing
The partitions and devices that can be updated in a
system, are monitored with an ‘Event Recorder’ or
observer that is responsible for collecting metrics,
which are temporally stored in shared memory. Each
observer has its respective monitor in the monitoring
partition, which will read the shared memory data and
react appropriately in case a value violates its range.
The boundaries of each measured metric are defined
in the partition metadata file. To make this possible,
each partition defines a metadata file that includes in-
formation about the shared memory device used to
write and read the metrics collected in the partition.
By design, each partition will be mapped to a differ-
ent shared memory device for wide metrics writing.
Some of the metrics used for safety are also used
for security. In order to avoid unnecessary overhead
looking the same values twice, this shared informa-
tion is written into a shared memory by the online
monitoring partition and then read by the offline mon-
itoring partition. Finally, the collected data is sent
upstream to PandoraFMS server once every minute.
This architecture scheme provides easy scalability. In
Figure 1 it is shown the representations of some mea-
sures upstreamed to PandoraFMS in its own Dash-
board.
IoTBDS 2023 - 8th International Conference on Internet of Things, Big Data and Security
118

Figure 2: Setup of the Up2Date fingerprinting approach.
4.2 Secure Data Gathering
In order to provide security to the communication
over a public network, every communication between
host (or gateway if we are considering the host func-
tion in the whole system) and server will be operated
through a TLS-based VPN tunnel with individual cre-
dentials per gateway. As a consequence, both client
and server need to be authenticated and the commu-
nication is encrypted.
VPNs allow the gateway to provide the capability
of accepting incoming connections only from within a
trusted environment. Furthermore, as each VPN end-
point can be containerized, it can be assured that com-
promised devices cannot be used to attack other de-
vices, as they will be imprisoned in the corresponding
container.
5 ANOMALY DETECTION
Once the monitor values are available in the Pandora
FMS Server, their processing action is enabled with
the objective of detecting anomalies by the anomaly
detection process that could happen during the execu-
tion of the application. The monitored data is stored
while the system is running in a safe and secure en-
vironment, thus obtaining the expected metric values.
The set of these expected values for a particular met-
ric is going to be referred as baseline. A baseline must
be obtained for every metric monitored for security.
The selected package to detect anomalies, due
to its simplicity and proven efficacy, is Anomalous
2
,
which consists of an R package to detect the most
unusual series. This package computes a vector of
features on each time series, which represent numeric
2
https://github.com/robjhyndman/anomalous
characteristics of the object in a mathematical way.
To continue, a principal component decomposition on
the features is performed and finally various bivari-
ate outlier detection methods are applied to the first
two principal components. The method is validated
by the authors with real-world and synthetic data
comprising normal and anomalous time series (Hyn-
dman et al., 2015). The anomalous datasets are based
on a malicious activity, new feature deployment or
a traffic shift. It is important to keep in mind that
this library detects the rarest time-series in the given
dataset, and this is why previously obtained normal
execution time-series (baseline) are needed to “com-
pare” the normal execution scenario with the runtime
values. This comparison is done in the following
manner: runtime values are appended to the baseline
data and the anomaly detection algorithm is applied to
the complete dataset to detect anomalous time-series.
The baseline dataset needs to be considerably larger
(minimum 5 times bigger) than the runtime data so
that the baseline values are considered as the normal
time-series.
The Pedestrian Detector application is used to
show how the anomaly detection works using the
Wide Metrics Observer, which as explained in Sec-
tion 4.1, writes the wide metrics in a shared mem-
ory every second. To provide an illustrative example,
in this section we just focus on the CPU usage met-
ric. The offline monitoring partition reads the shared
memory of the partition/system-wide metrics once ev-
ery second and collects the CPU use in a file. The file
stores 60 CPU values per line, thus the time-series
will have 60 values each. As the application is run-
ning in an infinite loop performing the same process
for the same input image set, a final baseline of al-
most an 6000 element time-series is obtained to have
a wide dataset of normal operation time-series. Due
Software Updates Monitoring Anomaly Detection
119
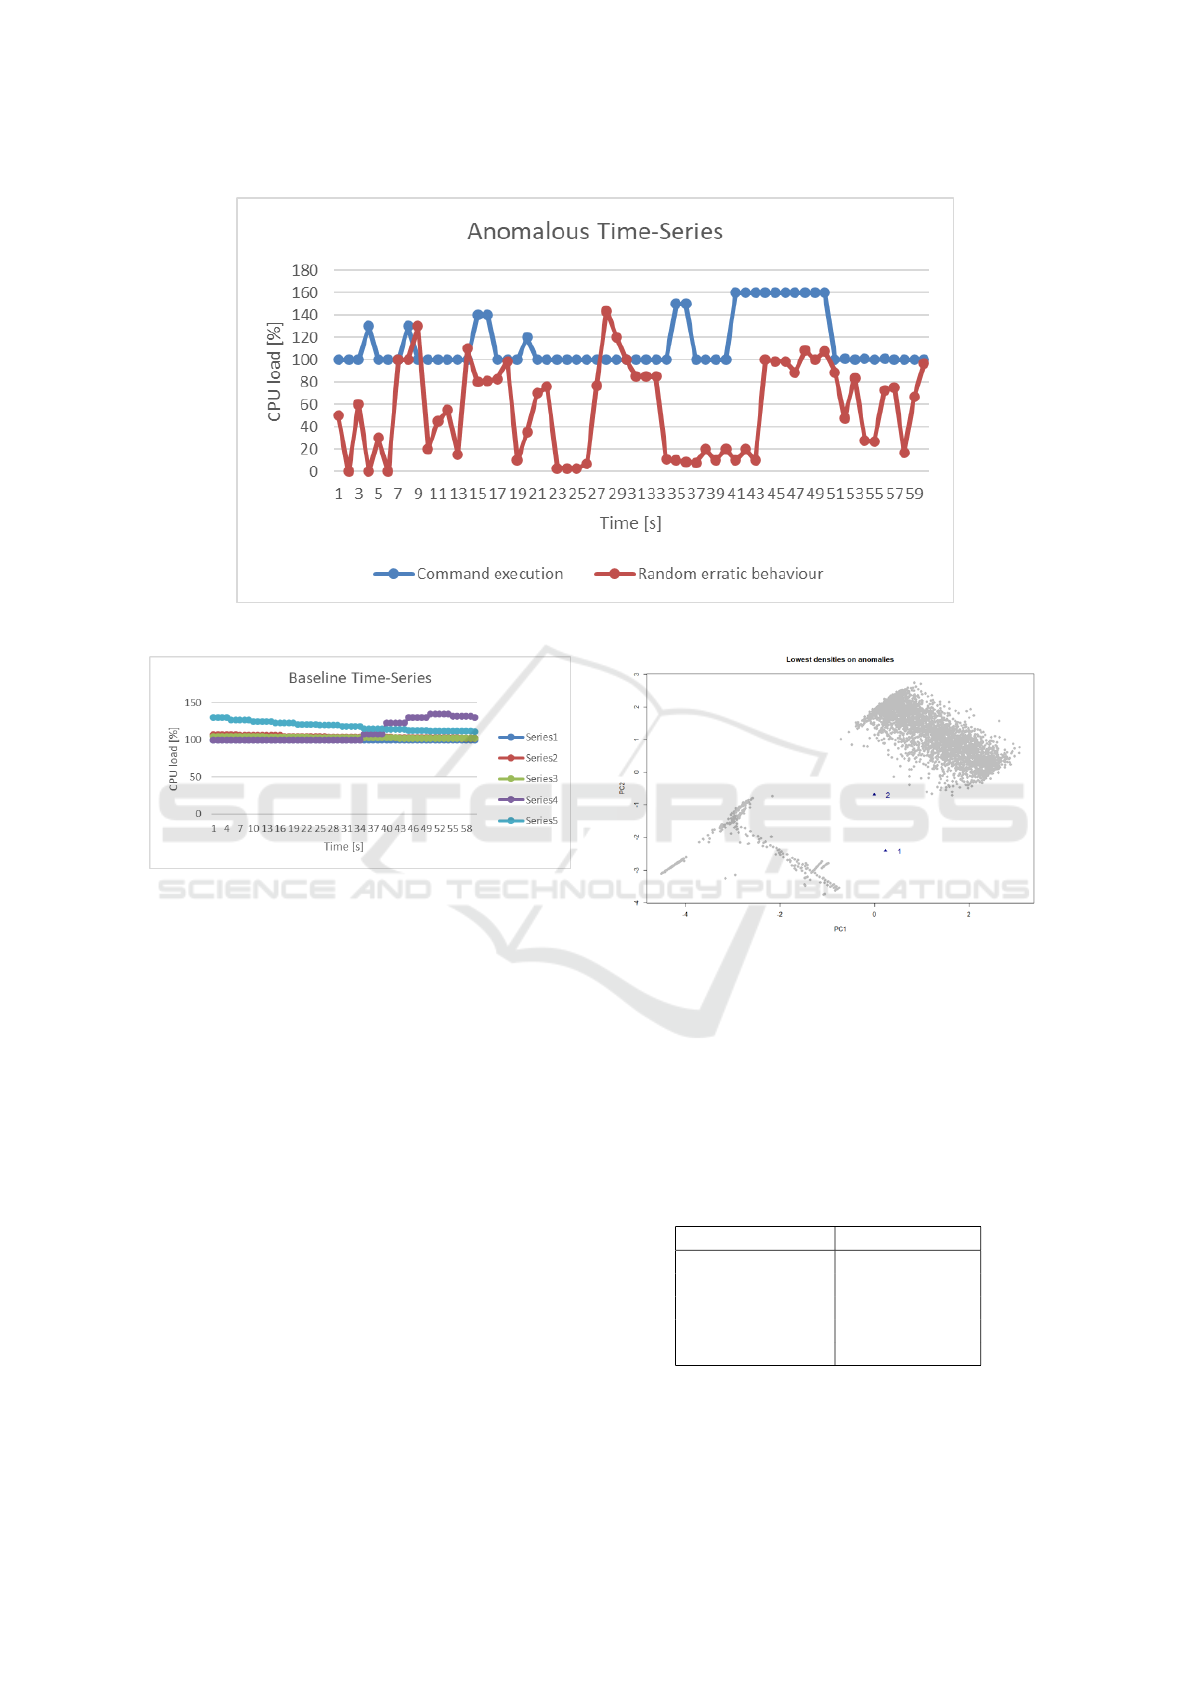
Figure 3: Anomalous time-series examples.
Figure 4: Baseline time-series examples.
to illustrative reasons, only some of the obtained base-
line time-series are shown in Figure 4. The shown se-
ries are ones that show some typical behaviour of the
application: constant CPU values, stepped CPU value
increase and stepped CPU value decrease.
The next step is to detect anomalous series in the
runtime values. The first step is to insert/append run-
time values to the baseline values, which should ad-
ditionally include anomalies. Looking at the baseline
values, the evolution of the CPU load is quite constant
or it has some staggered ups and downs. The poten-
tial anomaly in the runtime values could have differ-
ent behaviours, as for example, different spikes in the
CPU load triggered by some command execution or
some random erratic CPU behaviour. For this exam-
ple, these two anomalies are artificially introduced in
the runtime values with indexes (positions) 50 and 51,
represented in Figure 3.
Once the dataset of the baseline plus the runtime
values with the anomalies is available, the next step
is to pass this dataset to the previously mentioned
Anomalous anomaly detection library. If constant
time-series are passed to the library the feature extrac-
Figure 5: Detection for synthetic anomalies.
tion process fails due to a divide-by-zero operation. In
this case, as the computation required by the applica-
tion is quite heavy, the CPU usage happens to stay at
100% value constantly at least for a minute and thus,
for a complete time-series. In order to solve this issue,
a very small normal distributed noise is added to the
dataset. In this way, the data is prepared to be passed
to the library and the following result is obtained.
Table 1: Table to test captions and labels.
Anomaly Order Index Position
1 51
2 50
3 3594
4 4195
5 3164
As it can be seen from the resulting plot in Fig-
ure 5, 2 anomalies are detected, which are marked
with blue triangles. But it must be checked that the 2
IoTBDS 2023 - 8th International Conference on Internet of Things, Big Data and Security
120

−2 0 2 4 6
−4 −2 0 2
Lowest densities on anomalies
PC1
PC2
1
2
3
4
5
Figure 6: Detection for CPU anomalies.
points in the plot represent the 2 anomalous synthetic
time-series. For this, the Anomalous library computes
a table of scores for each time-series, from which the
time-series with the smallest score is considered the
rarest. Sorting this table, the dataset is ordered from
the rarest to the most normal time-series. We can see
the anomalous time-series with indexes 50 and 51 in
the top 5 sorted results that are shown in Table 1.
For this demo it was previously known that there
should be 2 anomalies, because these were enforced
for validation purposes. But in real scenarios, there
could be more than 2 anomalies or not even one.
As already mentioned, the Anomalous package indi-
cates which are the most different time-series within
the data. Thus, it will always plot at least 1 time-
series as a blue triangle, as if it was an anomaly. A
post-examination of the result should always be done
to verify that the indicated time-series is, in fact, an
anomaly. This operation can be done plotting the po-
tential anomalous time-series against some baseline
series and assess if it is really an anomalous one.
The anomaly detection used in the system de-
ployed is based on a baseline of 1,000 series, each
with 60 values, that are considered not anomalous
as those values were recollected during normal run-
time. A single anomalous series is introduced to such
baseline. The anomaly detector determines then an
anomaly score and sorts the series using that score.
With the series index sorted as shown in Table 1. Ex-
amples of the 5 most anomalous series are shown for
CPU in Figure 6 and for memory in Figure 7. If the
anomalous series is between the 5 most anomalous
scores we consider the anomaly has been detected by
the anomaly detector. Table 2 shows the obtained
anomalies detection rate.
−2 0 2 4 6 8
−2 −1 0 1 2 3 4
Lowest densities on anomalies
PC1
PC2
1
2
3
4
5
Figure 7: Detection for memory anomalies.
Table 2: Anomalies detection rate.
Metric Detection rate
CPU usage 94%
Memory usage 97%
IPC 100%
6 CONCLUSIONS
In this paper, a monitoring and anomaly detection
approach for software updates is presented. The
monitors have been deployed in a NVIDIA Jetson
Xavier platform as a proof of concept with the Pan-
dora Server allocated at the other end of a VPNv6 net-
work. The detection of anomalies has been performed
for CPU and memory values. We consider the detec-
tion rate of the performed tests to be high enough to
have a positive impact in detecting security flaws of
an update or attacks performed to the system.
The purpose of offline monitoring is to gather in-
formation at the working devices that will be sent over
to a remote server for automatic or manual inspec-
tion for security fingerprinting and design optimiza-
tion. We are not making a proposal for automatic
responses to the detection apart from the notification
as currently the anomaly detection will detect differ-
ences provoked by the update itself that are inten-
tional. This could be a very interesting future work
for not intrusive automatic reactions on the systems,
that implements an exception system for the expected
changes of behaviour due to the update itself.
Another lines of future work are the improvement
on the detection rate through algorithm optimizations
and the analysis of other types of possible anoma-
Software Updates Monitoring Anomaly Detection
121

lies, including also software specific indicators. As
expected, the anomaly detection data processing re-
quires a substantial computing power. The optimiza-
tion in terms or efficiency is an interesting field, that
could drive to lower detection rates and could be used
to achieve a more reasonable anomaly detection for
elements that will achieve lower security levels.
ACKNOWLEDGEMENTS
This work has been funded by the European Union’s
Horizon 2020 research and innovation programme
(grant agreement No 871465 (UP2DATE)).
REFERENCES
Agelastos, A., Allan, B., Brandt, J., Cassella, P., Enos, J.,
Fullop, J., Gentile, A., Monk, S., Naksinehaboon, N.,
Ogden, J., et al. (2014). The lightweight distributed
metric service: a scalable infrastructure for continu-
ous monitoring of large scale computing systems and
applications. In SC’14: Proceedings of the Interna-
tional Conference for High Performance Computing,
Networking, Storage and Analysis, pages 154–165.
IEEE.
Agirre, I., Yarza, I., Mugarza, I., Binchi, J., Onaindia,
P., Poggi, T., Cazorla, F. J., Kosmidis, L., Gr
¨
uttner,
K., Uven, P., et al. (2021). Safe and secure soft-
ware updates on high-performance mixed-criticality
systems: The up2date approach. Microprocessors and
Microsystems, 87:104351.
Cherkasova, L., Ozonat, K., Mi, N., Symons, J., and Smirni,
E. (2009). Automated anomaly detection and per-
formance modeling of enterprise applications. ACM
Transactions on Computer Systems (TOCS), 27(3):1–
32.
Chiara, P. G. (2022). The cyber resilience act: the eu com-
mission’s proposal for a horizontal regulation on cy-
bersecurity for products with digital elements. Inter-
national Cybersecurity Law Review, pages 1–18.
Ding, Y., Xia, X., Chen, S., and Li, Y. (2018). A malware
detection method based on family behavior graph.
Computers & Security, 73:73–86.
Hyndman, R. J., Wang, E., and Laptev, N. (2015). Large-
scale unusual time series detection. In 2015 IEEE
International Conference on Data Mining Workshop
(ICDMW), pages 1616–1619.
Ibidunmoye, O., Hern
´
andez-Rodriguez, F., and Elmroth, E.
(2015). Performance anomaly detection and bottle-
neck identification. ACM Computing Surveys (CSUR),
48(1):1–35.
Jayathilaka, H., Krintz, C., and Wolski, R. (2017). Perfor-
mance monitoring and root cause analysis for cloud-
hosted web applications. In Proceedings of the 26th
International Conference on World Wide Web, pages
469–478.
Jayathilaka, H., Krintz, C., and Wolski, R. (2020). De-
tecting performance anomalies in cloud platform ap-
plications. IEEE Transactions on Cloud Computing,
8(3):764–777.
Kang, H., Zhu, X., and Wong, J. L. (2012). {DAPA}: Diag-
nosing application performance anomalies for virtual-
ized infrastructures. In 2nd USENIX Workshop on Hot
Topics in Management of Internet, Cloud, and Enter-
prise Networks and Services (Hot-ICE 12).
Kim, H.-A. and Karp, B. (2004). Autograph: Toward au-
tomated, distributed worm signature detection. In
USENIX security symposium, volume 286. San Diego,
CA.
Kolbitsch, C., Comparetti, P. M., Kruegel, C., Kirda, E.,
Zhou, X., and Wang, X. (2009). Effective and efficient
malware detection at the end host. In Proceedings of
the 18th Conference on USENIX Security Symposium,
SSYM’09, page 351–366, USA. USENIX Associa-
tion.
Lee, S., Levanti, K., and Kim, H. S. (2014). Network
monitoring: Present and future. Computer Networks,
65:84–98.
L
´
opez, J. (2010). Monitorizaci
´
on con pandora fms 3.
Todo linux: la revista mensual para entusiastas de
GNU/LINUX, (115):20–23.
Mugarza, I., Parra, J., and Jacob, E. (2017). Software up-
dates in safety and security co-engineering. In Inter-
national Conference on Computer Safety, Reliability,
and Security, pages 199–210. Springer.
Mugarza, I., Yarza, I., Agirre, I., Lussiana, F., and Botta, S.
(2021). Safety and security concept for software up-
dates on mixed-criticality systems. In 2021 5th Inter-
national Conference on System Reliability and Safety
(ICSRS), pages 171–180. IEEE.
Samir, A. and Pahl, C. (2019). Detecting and predicting
anomalies for edge cluster environments using hidden
markov models. In 2019 Fourth International Con-
ference on Fog and Mobile Edge Computing (FMEC),
pages 21–28. IEEE.
Samir, A. and Pahl, C. (2020). Detecting and localizing
anomalies in container clusters using markov models.
Electronics, 9(1):64.
Singh, S., Estan, C., Varghese, G., and Savage, S. (2004).
Automated worm fingerprinting. In OSDI, volume 4,
pages 4–4.
Tuncer, O., Ates, E., Zhang, Y., Turk, A., Brandt, J., Leung,
V. J., Egele, M., and Coskun, A. K. (2018). Online di-
agnosis of performance variation in hpc systems using
machine learning. IEEE Transactions on Parallel and
Distributed Systems, 30(4):883–896.
IoTBDS 2023 - 8th International Conference on Internet of Things, Big Data and Security
122
