
Generation of Concrete Parameters from Logical Urban Driving
Scenarios Based on Hybrid Graphs
Christoph Glasmacher
a
, Hendrik Weber
b
, Michael Schuldes
c
, Nicolas Wagener
d
and Lutz Eckstein
Institute for Automotive Engineering, RWTH Aachen University, Aachen, Germany
{christoph.glasmacher, hendrik.weber, michael.schuldes, nicolas.wagener, office}@ika.rwth-aachen.de
Keywords:
Automated Driving, Intelligent Vehicles, Safety Assurance, Scenario Generation, Parameter Sampling, Causal
Networks, Constraint Graphs.
Abstract:
Safety assurance of highly automated driving functions is a major challenge in today‘s research and requires
the development of new validation methods. Scenario-based testing is a promising approach to handle the va-
riety of possible situations efficiently. Due to the limited availability of real-world derived scenarios, they are
increasingly generated synthetically. Whereas actual approaches to generate concrete parameters are mostly
either knowledge- or data-driven, we propose a methodology to combine these approaches. We model the cor-
relation of parameters in real-world data as multivariate probability functions by using copulas. In addition,
we establish modular causal and constraint relations combining Bayesian networks and constraint graphs to
add semantic knowledge about parameters and their interactions. Thereby, road user behavior and physical
equations are represented. The application of our generation method on urban intersections shows the capa-
bility to sample high-dimensional parameter spaces with limited input data. Hereby, it offers the opportunity
to create realistic scenarios to extend the database for scenario-based assessment.
1 INTRODUCTION
The development and safety assurance of automated
driving functions is one of the big challenges in au-
tomotive engineering. Whereas traditional validation
methods would require billions of kilometers driving
on public roads to prove the safety (Wachenfeld and
Winner, 2016), simulation-based methods offer an al-
ternative and are a focus in current research (Ried-
maier et al., 2020). One promising method is the ap-
proach of scenario-based testing. Within this method,
a driving function is confronted with predefined sce-
narios. These scenarios are either generated based on
expert knowledge or real-world data (Bussler et al.,
2022).
Within data-driven approaches, concrete scenar-
ios respectively their defining parameter values are
extracted from real-world data and correlations are
derived. In contrast to knowledge-based scenario
parametrization, the direct link to real traffic allows
a
https://orcid.org/0000-0003-4826-9706
b
https://orcid.org/0000-0003-3897-791X
c
https://orcid.org/0000-0003-2339-8157
d
https://orcid.org/0000-0002-9086-5061
conclusions about the probability of occurrence of
the distribution in reality (de Gelder, 2022). If the
amount of recorded data is sufficiently large, mapped
correlations can represent the distribution of param-
eter values and improve the description of parame-
ter interactions (Lotto et al., 2022). But since es-
pecially detailed urban scenarios need a comprehen-
sive description and therefore a relatively large pa-
rameter set, a representative fitting needs more input
data than for small parameter sets according to the
curse of dimensionality (Fan and Li, 2006). Since
the amount of real-world data is limited, actual cor-
relation approaches are not sufficient for detailed sce-
narios needed in current safety assessment (Li et al.,
2022). Other challenges of those scenarios are the
understandability of the scenarios and the traceability
of the generation process respectively their parameter
values e.g. for safety argumentation (Beringhoff et al.,
2022).
We address these problems with a new scenario
parameter representation and sampling method com-
bining knowledge-based and data-driven approaches.
On the one hand, we acknowledge the realistic data
distribution by mapping real-world extracted param-
eters to a multivariate Gaussian copula. On the other
Glasmacher, C., Weber, H., Schuldes, M., Wagener, N. and Eckstein, L.
Generation of Concrete Parameters from Logical Urban Driving Scenarios Based on Hybrid Graphs.
DOI: 10.5220/0011828400003479
In Proceedings of the 9th International Conference on Vehicle Technology and Intelligent Transport Systems (VEHITS 2023), pages 215-222
ISBN: 978-989-758-652-1; ISSN: 2184-495X
Copyright
c
2023 by SCITEPRESS – Science and Technology Publications, Lda. Under CC license (CC BY-NC-ND 4.0)
215

hand, we add semantic information about relations of
parameters within individual modular concepts that
can be combined. Therefore, a hybrid graph struc-
ture is proposed to combine specific mathematical
constraints with not further specified causal relations.
This expert knowledge-driven hybrid representation
is used to generate new parameter values mathe-
matically explainable following three steps: contin-
uous parameter values are generated from data-driven
correlation, those values are corrected according to
knowledge-based constraints and in the end, the like-
lihood of occurrence is calculated to filter unrealistic
distributions using causal graphs.
In the following, we give an overview of cur-
rent methods of scenario generation and graph-based
methods in scenario-based safety assurance. From
that on we explain our methodology of the hybrid
graph-based modeling and realistic scenario parame-
ter value generation. This method is applied to urban
intersections of the inD dataset (Bock et al., 2020).
Thereby, new parameter sets are generated, compared
to the real-world data and further discussed.
2 RELATED WORK
2.1 Scenario Generation
Scenario generation methods to create concrete sce-
narios can be subdivided into two fundamental types:
real-world observation-based and knowledge-based
approaches (Bussler et al., 2022). Knowledge-based
approaches can include ontologies to create scenes
(Bagschik et al., 2018), symbolic automates (Ban-
nour et al., 2021), or based on pure expert knowledge-
based scenario creation. Those approaches have one
main shortcoming: They cover the realism of pa-
rameter values with regards to existing traffic insuf-
ficiently and can not estimate the probability of oc-
currence (Ding et al., 2022). By design, data-driven
approaches can handle the problem of representative-
ness easier but need real-world data. (Li et al., 2022)
uses real-world data to extract features and to map
those to multiple agents. (Pegasus Project Consor-
tium, 2019) extract individual parameter distributions
from recorded data to generate new concrete scenar-
ios. A similar approach to generate realistic scenar-
ios using probability density functions (pdf) is pro-
posed by (de Gelder et al., 2022). More recently,
(Lotto et al., 2022) uses copulas to model param-
eters not independently but considering the corre-
lations to create new scenario parameter values as
points in a multidimensional and intercorrelated pa-
rameter space. Those approaches face one or multiple
of the following limitations:
• Generated parameter values are not proven to be
realistic and to potentially occur in reality (Li
et al., 2022)
• Relations between individual scenario parame-
ters are not considered explicitly. This results in
wrong estimation of the possible parameter space
potentially leading to the generation of unrealis-
tic parameter values (Pegasus Project Consortium,
2019), (de Gelder et al., 2022).
• Whereas (Lotto et al., 2022) considers the corre-
lations between scenario parameters, the genera-
tion of detailed concrete scenarios needs a signif-
icantly amount of data.
• Due to machine learning steps, the parameter
value generation process cannot be traced math-
ematically completely (Li et al., 2022). This leads
to uncertainties regarding completeness.
2.2 Graph-Based Representation
Graphs are recently used tools to describe scenarios.
Within those graphs, states and their relations can be
modeled (Bannour et al., 2021), (Bagschik, 2022).
Especially, probabilistic graph models (PGMs) such
as Bayesian networks (BN) are increasingly used to
describe relations (Ding et al., 2022). A BN is a di-
rected acyclic graph (DAG) consisting of nodes and
edges. Nodes can be understood as a set of states
with certain probabilities. Directed edges connect
these nodes and describe their relations by a condi-
tional probability. Graphs are used to describe scenes
(Bagschik et al., 2018) or abstract interrelationships
(Beck et al., 2022). (Adee et al., 2021) model percep-
tion phenomena within causal graphs. Thereby, only
causal relations are represented. Combining causal
graphs with BN leads to a causal BN. It differs from
BN in that all relations between nodes within a BN
are established because of direct causes (Pearl and
Russell, 2000). This allows a better description and
analysis of causal effects and relations.
Another type of graphs are constraint graphs
(Friedman and Phan, 2017). Whereas PGMs consist
of nodes and directed edges, bipartite graphs include
nodes, undirected edges, and additional constraints
representing mathematical equations. To the best of
our knowledge, it is not yet used in automated driv-
ing, but a common tool in other domains. (Zhu et al.,
2021) uses constraint graphs for language sorting al-
gorithms. (Para et al., 2021) applies these to generate
room layouts and (Friedman and Phan, 2017) states
that the theory is capable to model complex problems.
VEHITS 2023 - 9th International Conference on Vehicle Technology and Intelligent Transport Systems
216

3 METHODOLOGY
In order to generate parameter values for detailed
urban driving scenarios we propose a combined
methodology using data-driven and knowledge-based
approaches. We use traffic data to extract realistic pa-
rameter distributions and additionally, use semantic
information to reduce the realistic parameter space.
Thereby, the overall process is split into two parts:
traffic analysis and scenario parameter values genera-
tion. Within the traffic analysis, we extract parameter
values from real-world data according to an underly-
ing scenario concept. Those are stored as concrete
scenarios within a database (see Fig. 1). In the gen-
eration part, multiple concrete scenarios are requested
from the database and linked to the hybrid graph. This
graph itself is linked to the scenario concept and de-
scribe the relations between parameters. After choos-
ing a subset of parameters those concrete values are
used to fit a multivariate probability distribution. This
distribution is then used to generate initial parame-
ter values. After generation, the parameter values are
corrected to meet the included knowledge of the con-
straint graph. Afterward, they are checked by apply-
ing the causal graph and calculating probabilities.
Figure 1: Scenario generation methodology including real
traffic and expert knowledge.
3.1 Data-Driven Information Extraction
To ensure the generation of representative concrete
scenarios, initial parameter value extraction is based
on the analysis of traffic observations. The data is
analyzed and transfered into parameter according to
an underlying scenario concept. Because of the high
complexity of urban traffic, a hierarchical approach is
beneficial. Thereby, individual parameters or param-
eter combinations can be assigned modularly. By as-
signing multiple modules as maneuvers, or conflicts,
the parameters can be combined within the scenario
to describe scenarios in detail (see Fig. 2).
Figure 2: Composition of scenario parameters within a
modular scenario concept.
3.2 Graph-Based Representation
Whereas correlations on limited input data give only
an incomplete picture of general relations, external
expert knowledge is included via graphs. Although
the usage of causal unrelated parameters may be pos-
sible for simple scenarios, it would be infeasible
to avoid dependencies when parameterizing detailed
and understandable scenarios. So, relations between
the parameters are established to prevent inconsisten-
cies and therefore modeled in graphs. Furthermore,
adding knowledge about parameters leads to a pos-
sible reduction of the parameter space by constraints
given by semantic relations a priori. For the setup of
these graphs, a distinction is made between two types
of edges:
• Probabilistic Relations: Probabilistic relations
involve the causal influence of one parameter on
another that cannot be adequately described deter-
ministically with reasonable effort. Reasons for
this can be the high complexity, fuzziness, or lack
of better knowledge like e.g. the complexity of
movement of an pedestrian (see Fig. 3a).
• Deterministically Describable Relations: These
are relations between parameters that can be un-
ambiguously represented by deterministic mathe-
matical equations or inequalities. The mathemat-
ically describable relations can be derived from
physical limitations or further model-based con-
straints. Descriptions can e.g. be used for met-
rics or reachability constraints for parameters (see
Fig. 3b).
In order to use these two types of relations simul-
taneously, a hybrid graph structure based on causal
and constraint relations is used. Whereas in a usual
BN conditional probabilities are used for modeling
correlations between two nodes, the causal relation
meaningfully restricts the parameter space leading to
a causal Bayesian network. Thereby, not all causal ef-
fects have to be modeled but the more accurate effects
are described the higher the validity of the restriction.
If not all causal influences are considered, the space
is less restricted whereas if non-causal relations are
modeled, the restrictions may be caused by spurious
correlations and diver from what is realistic. While
Generation of Concrete Parameters from Logical Urban Driving Scenarios Based on Hybrid Graphs
217

(a) Causal relation
(b) Constraint relation with equations (Eq) and inequations
(IEq) within constraint graph
Figure 3: Classification of semantic parameter relations in
graphs.
in a causal graph the relation between two parameters
consists of a directed edge, the edges within constraint
graphs are undirected but linked by an equation. This
property of constraint graphs is used to model math-
ematically known and undirected relations. By com-
bining the two types of edges, multiple concepts can
be modeled with different or redundant parameteriza-
tions.
Within the modeling of a scenario, it is thus pos-
sible to combine different concepts (see Fig. 4). In
doing so, identical nodes are merged and new con-
nections between the graphs are established. This
allows it to model even high-dimensional parame-
ter spaces combining multiple elements such as road
users, weather influences or traffic signs. So, complex
scenarios as well as longer scenarios or sequences can
be modeled. Thereby, establishing further nodes to
describe relations between road users, temporal influ-
ences and spatial dependencies between scenario as-
pects can be added. This leads to a more constrained
parameter space and thus the needed amount of input
data decrease.
Figure 4: Combined graph with scenario (S), concepts (C),
and their parameters (P) for generation of detailed scenar-
ios.
3.3 Scenario Specification
Based on the previous steps, extracted data and ap-
plied knowledge have to be chosen to generate new
parameter values. Thereby, the amount of concrete
scenarios derived from the database can be filtered
based on one or multiple concept annotations (cf.
Sec. 3.1). The more restrictions are applied and the
fewer parameters are used, the more focused further
parameter value generation can be. The choice of
both, the used concrete scenarios, and also parameters
are dependent on the use case. When selecting param-
eters, however, it is important to note that not just any
selection of defining parameters will result in a com-
plete scenario. Therefore, two rules for parametriza-
tion are defined:
• A graph has to be specified sufficiently. It is con-
sidered as specified sufficiently if all direct de-
scendants of the root are specified sufficiently.
• A node is considered specified sufficiently if ei-
ther concrete parameter values for the node are set
or descendants exist and are sufficiently specified.
The scenario parameterization rules lead to two
consequences: Not every set of parameters selected
results necessarily in an executable scenario. Not
specifying all descendants can lead to semi-concrete
scenarios. This can especially help clustering scenar-
ios within a broader context like a safety argumenta-
tion. The fewer leaf-near nodes are specified, the less
concrete the scenario becomes. The more nodes are
described on a concrete level, the more likely the pos-
sibility to execute the parameter values as a concrete
scenario.
The usage of a sub-set of parameters can be seen
as a graph simplification deleting unused nodes and
reconnecting relations. This may reduce the graph to
a pure causal BN or a constraint graph. The simpli-
fication to a causal BN allows e.g. a more compre-
hensive analysis of dependencies using causal theory
(Pearl and Russell, 2000) whereas a analytical solu-
tion for the parameter space can be found within pure
constraint graphs (Friedman and Phan, 2017).
3.4 Parameter Generation
The generation of the parameter values can be
subdivided into three steps taking the benefits of
knowledge-based and data-driven generation methods
into account. Firstly, in a data-driven step initial pa-
rameter values are created based on multivariate dis-
tributions of the extracted concrete scenarios. In the
second step the generated parameter values are cor-
rected applying the included knowledge before a hy-
brid approach is used in the end to validate the param-
eter values based on probability calculations:
1. Initial Generation of Parameter Values: To cre-
ate initial parameter values, the extracted and cho-
sen traffic information (cf. Sec. 3.3) is trans-
formed into a multivariate probability distribu-
tion. Since the distribution on correlations of the
individual parameters does not follow an a priori
known distribution function, the parameter space
is represented by a Gaussian copula. This repre-
VEHITS 2023 - 9th International Conference on Vehicle Technology and Intelligent Transport Systems
218

sentation is also acceptable for more complex dis-
tributions since the data is transformed when fit-
ting the copula. On the basis of this probability
distribution, individual parameter values can be
determined efficiently on the basis of traffic data.
2. Constraint Verification and Correction: Due
to the mostly limited amount of data, the ap-
proximated distribution of the copula can not
reflect causal relations or physical limits suffi-
ciently. These inaccuracies can lead to contradic-
tions within generated parameter values that must
be corrected. These can include exact mathemat-
ical relations that are not considered in the corre-
lation itself but are fulfilled by the input data. To
correct those logical inconsistencies, graph con-
straints are reviewed and adjustments are made to
satisfy all of those.
3. Causal Probability Calculation: Finally, the
probability of occurrence of the parameter distri-
bution is evaluated with respect to the real val-
ues. Contrary to the copula, only the causal re-
lations of the hybrid graph are modeled within a
causal Bayesian network. Thus, the possible pa-
rameter space is restricted by known causal rela-
tions. For the conditional occurrence probability
of a parameter value, the traffic data is discretized
and the conditional probabilities of parameter val-
ues (i) based on descendants (i
pre
) are calculated
(p(i|i
pre
)). The probability of occurrence of the
complete parameter values is thus given by the
product of the conditional probabilities (1). As
long as the probability of a parameter values set
(p
set
) is greater than zero, a similar parameter dis-
tribution among the network nodes can be found
in the data. If the probability is smaller than the
desired threshold, the parameter values can be
varied and must then be verified again according
to step two.
p
set
=
∏
i
p(i|i
pre
) (1)
Using the hybrid graphs, other concretization
steps are also conceivable but limit the design. For ex-
ample, instead of the copula, an iterative set of valid
scenarios constraining the parameter boundaries can
be found, or in the case of a linear constraint graph,
the problem can be solved analytically. However, this
would limit the description and parameter value gen-
eration significantly.
4 RESULTS
To verify the proposed method, it is implemented in
Python and pgmpy is used for graph representation
(Ankan and Panda, 2015). For evaluation, param-
eter values for urban scenarios are generated based
on observed real-world data from the inD dataset
(Bock et al., 2020). Thereby, a scenario with two
road users approaching the intersection from differ-
ent directions, merging on the intersection, and end-
ing on the same road is chosen exemplary. Maneu-
vers of the road users as well as relative direction and
approaching arms are not further specified a priori,
but implicitly included within the extracted parame-
ters. The observed intersection (Frankenburg) con-
tains four arms. 322 scenarios were extracted from
this intersection. Besides the data-driven extraction,
the conflict is modeled within the hybrid graph struc-
ture (see Fig. 5) according to (cf. Sec. 3.2). 23 of
those parameters are directly extracted from the data.
Due to the uniform road geometry intersection, re-
lated attributes are considered constant and therefore
underlying parameters are combined to two nodes.
Additionally, 2 parameters are unobserved because
similar to the road geometry parameters they are to
complex to process without further breakdown and
only serve for a better scenario understanding (cf.
Sec. 3.3). In addition to the causal relations, inde-
pendent equations and inequations are used to de-
scribe mathematical relations. Furthermore, overar-
ching conditions (gray) are inserted for parameter ex-
traction and validation to check the correct expres-
sion of the concrete scenario. According to Sec. 3.3 it
would be also valid to use less parameters, but all are
used to show the methodology at a relatively simple
use case.
From these input data, 200 parameter sets are cre-
ated to describe the scenario according to Sec. 3.4 us-
ing 1000 randomly selected copula samples. Con-
straints and causal relations are used to adjust and
filter the data. Thereby, the parameter values con-
verge towards real-world extracted values as exem-
plary shown for the constellation of two vehicles.
This is partially characterized by the predicted or-
der of passing (predicted priority level adapted from
(Hu and Li, 2017)) and the predicted timegap at the
conflict zone (see Fig. 6). On average 50 percent
of them meet all 4 additional overarching conditions.
The incorrect 50 percent result from the inaccurate fit-
ting of the copula since these semantic relations were
not introduced. Nevertheless, it can be shown that
the distribution of the generated data after the fol-
lowing steps including the hybrid graph have similar
statistical properties in spite of the high dimension-
ality and complex distribution. Therefore, the rela-
tion of two constraint adjusted metrics and two uncon-
strained variables are shown exemplary (see Fig. 7).
For a quantitative comparison, the distance be-
Generation of Concrete Parameters from Logical Urban Driving Scenarios Based on Hybrid Graphs
219
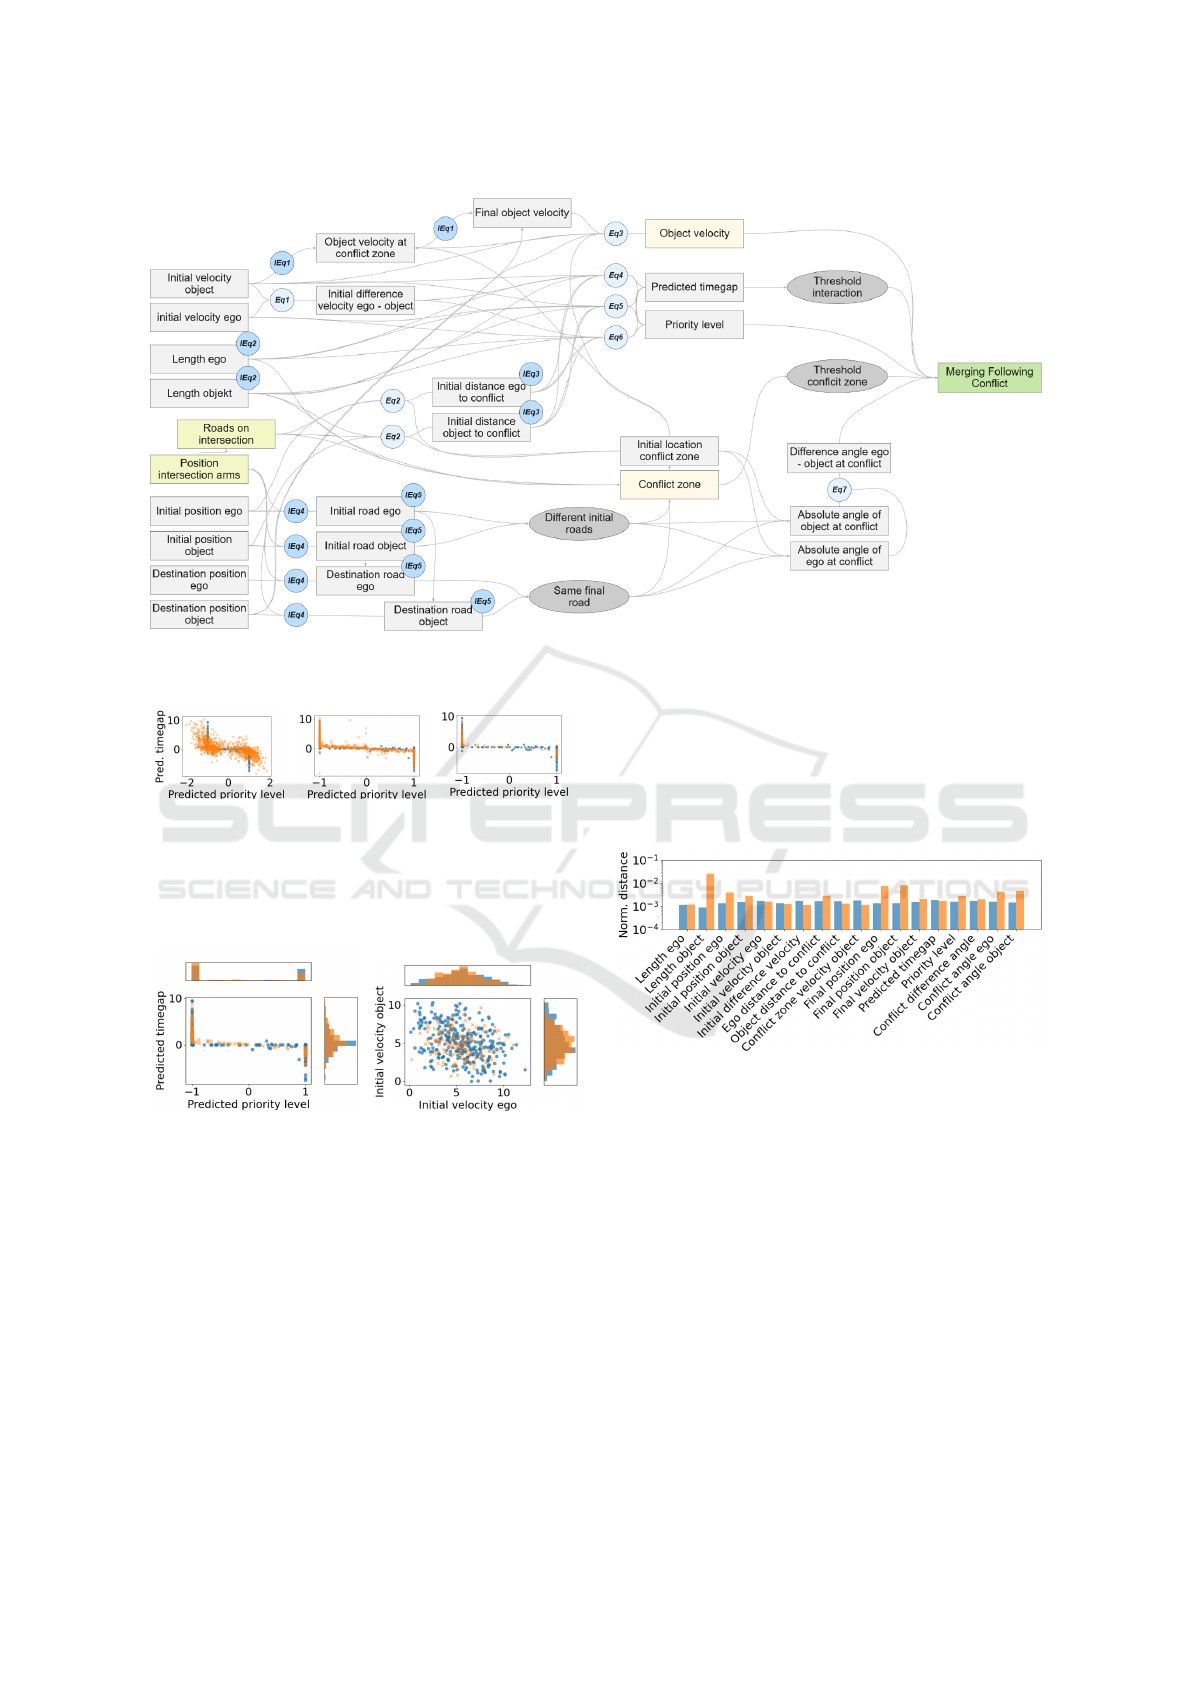
Figure 5: Hybrid graph of a merging following conflict including observed parameters (yellow), unobserved parameters (light
yellow), infrastructure parameters (green), equations (Eq), inequalities (IEq) and thresholds (gray).
(a) Copula sam-
pling
(b) Constraints (c) Causal behavior
Figure 6: Parameter distribution of real parameter values
(blue) and generated parameter values (red) along the gen-
eration steps each including previous steps (cf. Sec. 3.4).
(a) Constraint metrics (b) Unconstraint velocities
Figure 7: Distribution of extracted parameter values (blue)
compared to generated parameter values (red).
tween two parameters is investigated. Comparing the
parameters individually, the average and normalized
Euclidean distance to the next observed real-world pa-
rameter value is used (see Fig. 8). The metric shows
that the distance distribution of the generated values
is similar to those of the real parameters. The gen-
erated parameter values are particularly close to real
values for Gaussian distributions of real parameters
and parameters constrained by rules. Deviations oc-
cur when the distributions consist of clusters with rel-
atively sharp borders as in parameters as object length
for pedestrians, bicycles, and vehicles. Since the bor-
ders are not modeled within constraints, a dispersion
occurs because of the Gaussian modeling. Similar ef-
fects can be observed in the disappearance of road
users.
Figure 8: Average normalized distances between values for
individual parameters.
To extend the evaluation to the multidimensional
parameter space, it is necessary to bring the param-
eters into relations. For this purpose, the parameter
values are normalized. The average Euclidean dis-
tance to the closest generation input parameter sets is
used as a reference. The number of reference param-
eter values used for this purpose corresponds to the
number of individual parameters used.
The average local minimum neighbor distance of a
generated parameter values is 30 percent higher com-
pared to the real-world and 17 percent higher com-
pared to newly inserted real-world parameter values
(see Tab. 1). Similarly, minimum and maximum dis-
tances are slightly higher, so it can be seen, that the
VEHITS 2023 - 9th International Conference on Vehicle Technology and Intelligent Transport Systems
220

parameter space is slightly extended. When using
more parameter values as an input for the generation,
both, the distances of new real-world and generated
parameter value distances decrease.
Table 1: Deviation of locally average distances of new pa-
rameter values compared to generation input real-world pa-
rameter values.
Data type Avg Min Max
real-world 1.13 0.79 1.63
synthetic 1.32 0.93 1.86
5 DISCUSSION AND OUTLOOK
The comparison of the generated parameter values
to the observed parameters shows that the method
is suitable for generating realistic concrete scenarios
even with few input data and high dimensionality.
This is shown by the fact that the generated param-
eter values reflect the distribution of the extracted pa-
rameters both qualitatively and quantitatively without
the specification of a distribution structure. Thereby,
the representation of discrete and continuous values is
possible. According to the mean local distance to ex-
tracted parameter values, it can be shown that the gen-
erated data are similar to the original data and fill in
gaps in the parameter space while satisfying the con-
straints of the model. Furthermore, it can also be seen
that some parameter values are generated which have
a relatively high distance to real points with regard to
the local distances. This can also be observed adding
new real-world values but is slightly higher for gener-
ated values. This is due to the moderate fit and partly
close real points, whose restrictions were not mod-
eled. Especially for expected distributions consisting
of discrete and continuous values, further restrictions
via constraints or more accurate relations between pa-
rameters should be used for closer results. Addition-
ally, it is shown that single process steps like the ex-
clusive use of a copula is not sufficient for the combi-
nation of many parameters and limited available data,
because dependencies are not modeled and therefore
have to be filtered out. Although the dependencies
implicitly find their way into the copula through the
real-world data, significantly more data or a reduction
of the parameter space would be necessary for an ac-
curate representation. This effect is expected to be
magnified for high dimensional problems but can be
counteracted by more detailed modeling via the hy-
brid graph structure.
Besides the quality of the generated data, ad-
ditional advantages of the hybrid structure can be
shown. The approach results in an improved un-
derstandability of the causal relations among each
other due to the graphical representation. In addition,
the structure yields simplified safety argumentability
through the usage of semi-concrete scenarios and the
comprehensive coverage of the parameter space. Fur-
thermore, the methodology allows mapping of redun-
dancies and alternative parameterization possibilities,
which is especially interesting for the use in databases
and simplifies the modular combination of different
concepts for the creation of detailed scenario descrip-
tion.
In future work, the modular linking of hybrid
graphs will be further investigated in order to ad-
dress the complexity of urban traffic. In this con-
text, more constraints should be established to link
graphs sequentially and temporally in parallel, thus
enabling the generation of realistic multi-vehicle pa-
rameter values. Besides physical or mathematical
constraints, traffic regulations could also be investi-
gated. Furthermore, the evaluation of the distance
computation of scenarios results in another open field
that can lead to a probability computation based on
hybrid graphs (cf. Sec. 3.4) as well as to further simi-
larity analyses. In addition, the introduced graphs can
be a suitable to increasingly couple scenario parame-
ter value generation with cause-effect relationships to
analyze and understand them within causal theory.
6 CONCLUSIONS
In this work, we presented a comprehensive method
for generating parameter values for detailed concrete
scenarios. Starting from traffic data, we extracted
concrete scenarios and semantically linked their pa-
rameters via hybrid graphs. Thus, causal relations as
well as mathematical constraints could be modeled.
Furthermore, we have shown that realistic and high-
dimensional parameter values can be generated using
distributions of few concrete input data in combina-
tion with the proposed graph structure. Those pa-
rameter values of concrete scenarios are located near
real-world data and fill the parameter space between
observed parameters. Further evaluation of the repre-
sentativeness as well as the optimized generation of
multi-vehicle scenarios remains for future work. Ad-
ditionally, thresholds and probability analysis of sce-
narios within the distributions shall be further investi-
gated.
Generation of Concrete Parameters from Logical Urban Driving Scenarios Based on Hybrid Graphs
221

ACKNOWLEDGEMENTS
The research leading to these results is funded by the
German Federal Ministry for Economic Affairs and
Climate Action within the project “Verifikations- und
Validierungsmethoden automatisierter Fahrzeuge im
urbanen Umfeld”. The authors would like to thank
the consortium for the successful cooperation.
REFERENCES
Adee, A., Gansch, R., and Liggesmeyer, P. (2021). System-
atic modeling approach for environmental perception
limitations in automated driving. In 2021 17th Eu-
ropean Dependable Computing Conference (EDCC),
pages 103–110. IEEE.
Ankan, A. and Panda, A. (2015). pgmpy: Probabilistic
graphical models using python. In Proceedings of
the 14th Python in Science Conference (SCIPY 2015).
Citeseer.
Bagschik, G. (2022). Systematischer Einsatz von Szenar-
ien f
¨
ur die Absicherung automatisierter Fahrzeuge
am Beispiel deutscher Autobahnen. Univer-
sit
¨
atsbibliothek Braunschweig.
Bagschik, G., Menzel, T., and Maurer, M. (2018). Ontol-
ogy based scene creation for the development of au-
tomated vehicles. In 2018 IEEE Intelligent Vehicles
Symposium (IV), pages 1813–1820. IEEE.
Bannour, B., Niol, J., and Crisafulli, P. (2021). Symbolic
model-based design and generation of logical scenar-
ios for autonomous vehicles validation. In 2021 IEEE
Intelligent Vehicles Symposium (IV), pages 215–222.
IEEE.
Beck, H. N., Salem, N. F., Haber, V., Rauschenbach, M.,
and Reich, J. (2022). Phenomenon-signal model: For-
malisation, graph and application.
Beringhoff, F., Greenyer, J., Roesener, C., and Tichy, M.
(2022). Thirty-one challenges in testing automated
vehicles: Interviews with experts from industry and
research. In 2022 IEEE Intelligent Vehicles Sympo-
sium (IV), pages 360–366. IEEE.
Bock, J., Krajewski, R., Moers, T., Runde, S., Vater, L.,
and Eckstein, L. (2020). The ind dataset: A drone
dataset of naturalistic road user trajectories at german
intersections. In 2020 IEEE Intelligent Vehicles Sym-
posium (IV), pages 1929–1934. IEEE.
Bussler, A., Wagener, N., P
¨
utz, A., Menzel, T., Braun, T.,
Fuchs, J., K
¨
ortke, F., Weber, H., and Glasmacher, C.
(2022). A story of scenarios - from data and knowl-
edge to scenarios for testing.
de Gelder, E. (2022). Safety assessment of automated vehi-
cles using real-world driving scenarios. PhD thesis,
Delft University of Technology.
de Gelder, E., Hof, J., Cator, E., Paardekooper, J.-P.,
den Camp, O. O., Ploeg, J., and de Schutter, B.
(2022). Scenario parameter generation method and
scenario representativeness metric for scenario-based
assessment of automated vehicles. IEEE Transactions
on Intelligent Transportation Systems, 23(10):18794–
18807.
Ding, W., Xu, C., Arief, M., Lin, H., Li, B., and Zhao, D.
(2022). A survey on safety-critical driving scenario
generation – a methodological perspective.
Fan, J. and Li, R. (2006). Statistical challenges with high
dimensionality: Feature selection in knowledge dis-
covery.
Friedman, G. J. and Phan, P. (2017). Constraint Theory,
volume 23. Springer International Publishing, Cham.
Hu, M. and Li, Y. (2017). Drivers’ avoidance patterns in
near-collision intersection conflicts. In 2017 IEEE
20th International Conference on Intelligent Trans-
portation Systems (ITSC), pages 1–6. IEEE.
Li, A., Chen, S., Sun, L., Zheng, N., Tomizuka, M., and
Zhan, W. (2022). Scegene: Bio-inspired traffic sce-
nario generation for autonomous driving testing. IEEE
Transactions on Intelligent Transportation Systems,
23(9):14859–14874.
Lotto, K., Nagler, T., and Radic, M. (2022). Modeling
stochastic data using copulas for application in vali-
dation of autonomous driving.
Para, W., Guerrero, P., Kelly, T., Guibas, L., and Wonka, P.
(2021). Generative layout modeling using constraint
graphs. In 2021 IEEE/CVF International Conference
on Computer Vision (ICCV). IEEE.
Pearl, J. and Russell, S. (2000). Bayesian networks. UCLA,
Department of Statistics Papers.
Pegasus Project Consortium (2019). Pegasus method - an
overview.
Riedmaier, S., Ponn, T., Ludwig, D., Schick, B., and Dier-
meyer, F. (2020). Survey on scenario-based safety
assessment of automated vehicles. IEEE Access,
8:87456–87477.
Wachenfeld, W. and Winner, H. (2016). The release
of autonomous vehicles. In Maurer, M., Gerdes,
J. C., Lenz, B., and Winner, H., editors, Autonomous
Driving, pages 425–449. Springer Berlin Heidelberg,
Berlin, Heidelberg.
Zhu, Y., Zhou, K., Nie, J.-Y., Liu, S., and Dou, Z. (2021).
Neural sentence ordering based on constraint graphs.
Proceedings of the AAAI Conference on Artificial In-
telligence, 35(16):14656–14664.
VEHITS 2023 - 9th International Conference on Vehicle Technology and Intelligent Transport Systems
222
