
A Deep Learning Approach for Estimating the Rind Thickness of
Trentingrana Cheese from Images
Andrea Caraffa
∗1
, Michele Ricci
2,3 a
, Michela Lecca
1 b
, Carla Maria Modena
1 c
,
Eugenio Aprea
2,3 d
, Flavia Gasperi
2,3 e
and Stefano Messelodi
1 f
1
Bruno Kessler Foundation, Digital Industry, Via Sommarive 14, 38123 Trento, Italy
2
Edmund Mach Foundation, Research and Innovation Centre, Via E. Mach 1, 38098 San Michele all’Adige (TN), Italy
3
University of Trento, Center Agriculture Food Environment, Via E. Mach 1, 38098 San Michele all’Adige (TN), Italy
fl
Keywords:
Food Quality Assessment, Cheese Rind Thickness, Deep Learning, Regression.
Abstract:
Checking food quality is crucial in food production and its commercialization. In this context, the analysis
of macroscopic visual properties, like shape, color, and texture, plays an important role as a first assessment
of food quality. Currently, such an analysis is mostly performed by human experts, who observe, smell,
taste the food, and judge it based on their training and experience. Such an assessment is usually subjective,
time-consuming, and expensive, so it is of great interest to support it with automated and objective advanced
computer vision tools. In this paper, we present a deep learning method to estimate the rind thickness of
Trentingrana cheese from color images acquired in a controlled environment. Rind thickness is a key feature
for the commercial selection of this cheese and is commonly considered to evaluate its quality. We tested our
method on 90 images of cheese slices, where we defined the ground-truth rind thickness using the measures
provided by a panel of 12 experts. Our method achieved a Mean Absolute Error (MAE) of ≈ 0.5 mm, which
is half the ≈ 1.2 mm error produced on average by the experts with respect to the defined ground-truth.
1 INTRODUCTION
Food quality control is a crucial step in the food pro-
duction and selling chain since it grants the customer
to get safe and good products. Many efforts have been
made to automatize food quality evaluation. Never-
theless, in several areas, this task is best performed
by human experts, who assess the quality of food
by analyzing various characteristics perceived by the
five senses, such as visual appearance, texture, hard-
ness, crispness, and chemical properties perceived by
smell and taste. In this framework, visual inspection
plays an important role since the appearance of food
is highly correlated with its quality. Visual character-
istics of food are usually investigated both at a micro-
scopic and a macroscopic scale. Microscopic analy-
sis is performed using technologically advanced in-
a
https://orcid.org/0000-0002-1114-1672
b
https://orcid.org/0000-0001-7961-0212
c
https://orcid.org/0000-0001-7015-8768
d
https://orcid.org/0000-0003-3648-0459
e
https://orcid.org/0000-0003-0055-9464
f
https://orcid.org/0000-0002-4673-9607
struments, e.g., near-infrared imaging systems, spec-
troscopy and hyper-spectral imaging systems, and X-
ray imaging sensors, that provide objective measures
regarding micro-structures (Russ, 2015; Lei and Sun,
2019). The macroscopic analysis often represents the
first step to judging the food quality and thus gen-
erally precedes the microscopic analysis. However,
unlike the latter, it is usually performed by humans
without the help of any tools. Specifically, experts ob-
serve the product focusing on macro visual properties
such as color, shape, and texture and judge it based
on their expertise and experience (Brosnan and Sun,
2004). Because they are subjective, sensory evalu-
ations can be affected by high inter-individual vari-
ability. This variability is partially limited by using
a well-designed experimental protocol, following ba-
sic rules of good practice for sensory analysis, and
carefully selecting, training, and monitoring judges.
Besides that, sensory evaluations are usually time-
consuming and expensive, and only a limited number
of samples can be analyzed in an evaluation session.
For this reason, an automated instrumental evaluation
of one or more sensory parameters is an attractive
tool to support a panel. Computer vision techniques,
76
Caraffa, A., Ricci, M., Lecca, M., Modena, C., Aprea, E., Gasperi, F. and Messelodi, S.
A Deep Learning Approach for Estimating the Rind Thickness of Trentingrana Cheese from Images.
DOI: 10.5220/0011830000003497
In Proceedings of the 3rd International Conference on Image Processing and Vision Engineering (IMPROVE 2023), pages 76-83
ISBN: 978-989-758-642-2; ISSN: 2795-4943
Copyright
c
2023 by SCITEPRESS – Science and Technology Publications, Lda. Under CC license (CC BY-NC-ND 4.0)

in which the visual properties of food are analyzed
through image processing algorithms, have proven to
be a promising tool for objective, effective, sustain-
able, cheaper, and faster assessment of food qual-
ity (Du and Sun, 2004; Turgut et al., 2014; Ma et al.,
2016; Jackman and Sun, 2013; Sun, 2016).
This work concerns assessing the quality of Trent-
ingrana, a Protected Designation of Origin (PDO)
cheese, with the help of advanced computer vision
techniques. The quality assessment of cheese pro-
duced seasonally by a cheese dairy is sample-rated
by a panel of experts. Some wheels are opened along
their diameter and visually screened by the experts.
One of the parameters they consider for a global judg-
ment is the rind thickness. This is important because
pieces of cheese with a thick or uneven rind are not
appreciated on the market. Here, we present a novel
method that estimates the cheese rind thickness on six
points of the wheel using a deep learning approach.
Computer vision has already been applied to
cheese quality evaluation. An interesting case study
is the assessment of the degree of conformity to
the quality standards of a protected cheese brand
(Bosakova-Ardenska et al., 2020; Badaro et al.,
2021), while an overview of computer vision methods
applied to quality control cases of specific cheeses,
along with the limitations of using simple image anal-
ysis techniques, can be found in (Lukinac et al.,
2018). However, to the best of our knowledge, there
is no previous method using deep learning. Therefore,
this work represents the first attempt to assist cheese
quality control by leveraging advanced computer vi-
sion based on neural networks and, more precisely,
to estimate cheese rind thickness from images in the
visible spectrum.
For our purpose, we acquired with an industrial
camera several images of Trentingrana cheese slices
obtained from a half-wheel by wire-cutting a piece
and then dividing it into left and right slices. Then
we asked a pool of 12 experts to observe each pic-
ture and measure the rind thickness in the upper and
lower faces of the cheese slice and in the heel. The
use of two slices per wheel and multiple thickness
measurements on the rind are introduced to provide
a more accurate assessment of the overall rind qual-
ity. We used this data to train and test a deep neural
network that estimates the thicknesses reported by the
experts. Experiments show that the proposed method
can accurately predict the rind thickness. As a base-
line, we developed a purpose-driven algorithm with
traditional computer vision that relies on detecting
contrast between rind and paste areas. With respect
to the mean thicknesses reported by the experts, the
Mean Absolute Error (MAE) for the hand-crafted al-
gorithm stands at 1.10 mm, while the MAE for the
deep learning method is 0.51 mm, which is less than
half the MAE produced on average by the pool of hu-
man experts.
The rest of the paper is organized as follows. Sec-
tion 2 provides a brief overview of the method. In
Section 3, we describe the preparation of the dataset
of images, along with their annotations, necessary to
train the model, while in Section 4, we describe the
proposed deep learning method in more detail. We
present experimental results in Section 5, including
the comparison with a fairly elaborate baseline tech-
nique we implemented using classical image analysis.
2 OVERVIEW OF THE METHOD
A block diagram of the proposed method is illustrated
in Figure 1. As input, it takes a color image I de-
picting a wire-cut cheese slice acquired under a fixed,
controlled light against a white background. A Re-
gion Extractor automatically localizes and crops I in
three rectangular regions R
A
, R
B
, R
C
around the cen-
ter points of the upper face A, the heel B, and the
lower face C of the cheese slice. Each sub-image
R
p
, p ∈ {A, B,C}, is fed in turn to the Thickness Es-
timator that produces a value as an estimation of the
rind thickness. The Thickness Estimator is learning-
based and, more precisely, implements a regression
technique exploiting a deep neural network.
3 DATA PREPARATION
The learning process requires the preparation of a
dataset of images representing the regions of inter-
est extracted from the original cheese images labeled
with a value representing the rind thickness. The work
is structured in the following steps.
3.1 Image Acquisition
We considered 45 cheese wheels from 15 dairy facto-
ries related to Trentingrana Consortium. Each wheel
was opened along its diameter with a special knife. A
piece about 2.5 cm thick was wire-cut and divided into
a left and a right slice (Figure 2(a)). Using a visual
analyser (Iris, AlphaMos, Tolouse France) under top
and bottom lighting (D65 compliant, 6700°K color
temperature), we acquired N = 90 images I
1
, . . . , I
N
with dimension 1024 × 768 pixels, each depicting a
slice of cheese.
A calibration step was performed to estimate the
conversion factor from pixels to millimeters. For this
A Deep Learning Approach for Estimating the Rind Thickness of Trentingrana Cheese from Images
77
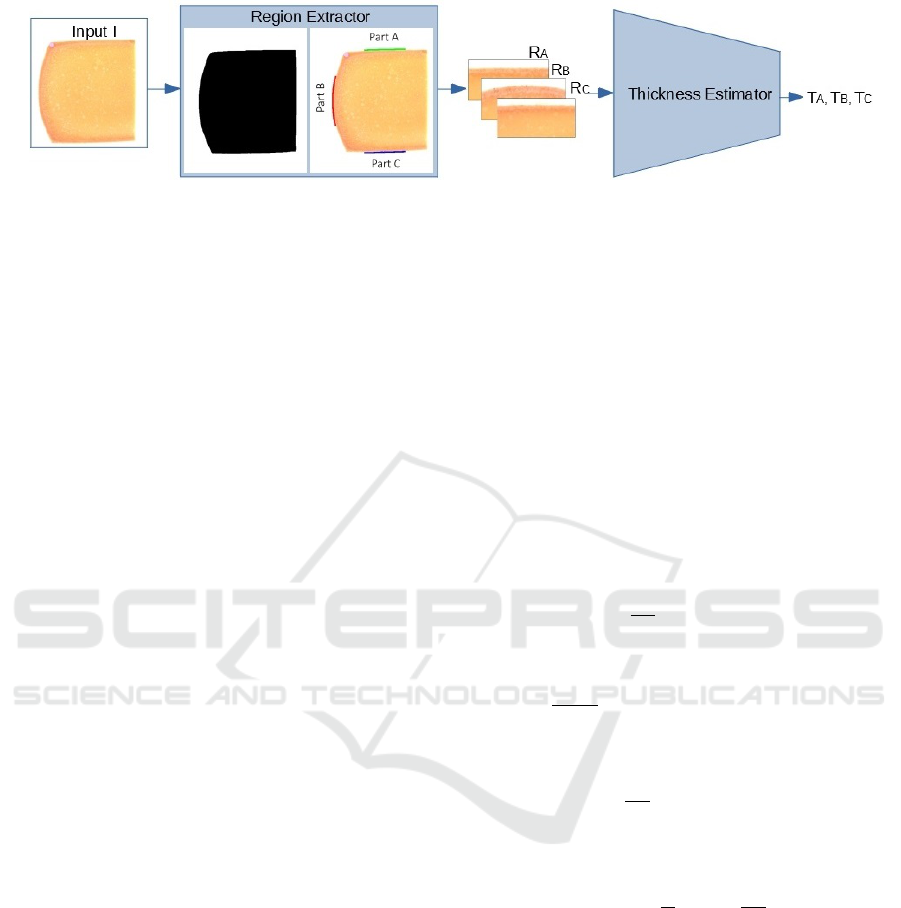
Figure 1: Overview: the Region Extractor focuses on three parts of interest in the input image and crops the regions
R
A
, R
B
, R
C
. In turn, the learning-based Thickness Estimator to predict the thickness in these regions runs three times,
every time being fed with a single region.
purpose, an image was captured depicting an object of
known dimensions (in millimeters), and its size in the
image (in pixels) was extracted, resulting in 1 pixel
corresponding to 0.29 mm.
3.2 Image Annotation
The subjective evaluation has been performed through
an online questionnaire created using EyeQues-
tion® (EyeQuestion, 2022), submitting all the im-
ages in randomized order to a jury of K = 12 experts
E
1
, . . . , E
K
. The experts quantitatively estimated the
rind thickness of each cheese slice in three regions.
For each image, every expert provided an estimate of
the rind thickness in centimeters measured on the up-
per face A, heel B, and lower face C. A set of three
rulers were superimposed on each image to assist the
task of the experts. Each region received K subjective
measurements of rind thickness. The analysis of these
estimates shows the presence of outliers and, because
of the smooth transition from rind to paste, different
experts provided different thickness values. We re-
mark that this was a new procedure for the experts
since they usually measure the rind thickness by ob-
serving the physical cheese and not from images.
3.3 Region Extraction
The Region Extractor receives in input an image I. It
identifies three parts on the cheese border and three
regions where the experts performed their measure-
ments. To this end, it computes the foreground mask
F corresponding to the cheese area in I and local-
izes the upper and lower faces A, C, and the heel B
by analyzing the concavities along its boundary ∂F
(Figure 2(b)). One-thick-pixel parts P
A
, P
B
and P
C
are extracted from ∂F around the middle point of
the three sides (Figure 2(c)). Three rectangular re-
gions R
A
, R
B
, R
C
around these parts are then cropped
and used as input to the Thickness Estimator (Fig-
ure 2(d)). The size of the rectangles was chosen to
roughly match the area observed by the experts to pro-
vide their measurements (280 × 150 pixels). Regions
R
B
and R
C
were rotated to appear as R
A
, i.e., with the
white background at the top of the region.
3.4 Ground-Truth Definition
We defined a method to associate each region R
i,p
,
where i = 1, . . . , N and p ∈ {A, B,C}, with a ground-
truth thickness value taking into account the intrinsic
variability of the annotations provided by the differ-
ent experts. Given the set of measures T
i,p
k
, where
k = 1, . . . , K, we first compute coefficients M
k
, expert-
dependent, and a global coefficient M, as follows:
M
k
=
1
3N
N
∑
i=1
∑
p∈{A,B,C}
T
i,p
k
(1)
M
i,p
=
1
K − 2
(
K
∑
k=1
T
i,p
k
− max
k=1...K
T
i,p
k
− min
k=1...K
T
i,p
k
)
(2)
M =
1
3N
N
∑
i=1
∑
p∈{A,B,C}
M
i,p
(3)
Then, we defined the ground-truth for region R
i,p
as:
T
i,p
=
1
K
K
∑
k=1
T
i,p
k
M
M
k
(4)
The dataset was organized in order to keep track of
the slice/wheel from which each region came.
4 THE PROPOSED NETWORK
We used the ResNet18 model (He et al., 2016), a well-
known architecture for image recognition tasks. We
replaced the final layer with a fully connected layer
returning a single value and we trained the whole
network from scratch as we experimented lower per-
formance by fine-tuning a backbone pre-trained on
ImageNet (Russakovsky et al., 2015). We tried a
IMPROVE 2023 - 3rd International Conference on Image Processing and Vision Engineering
78
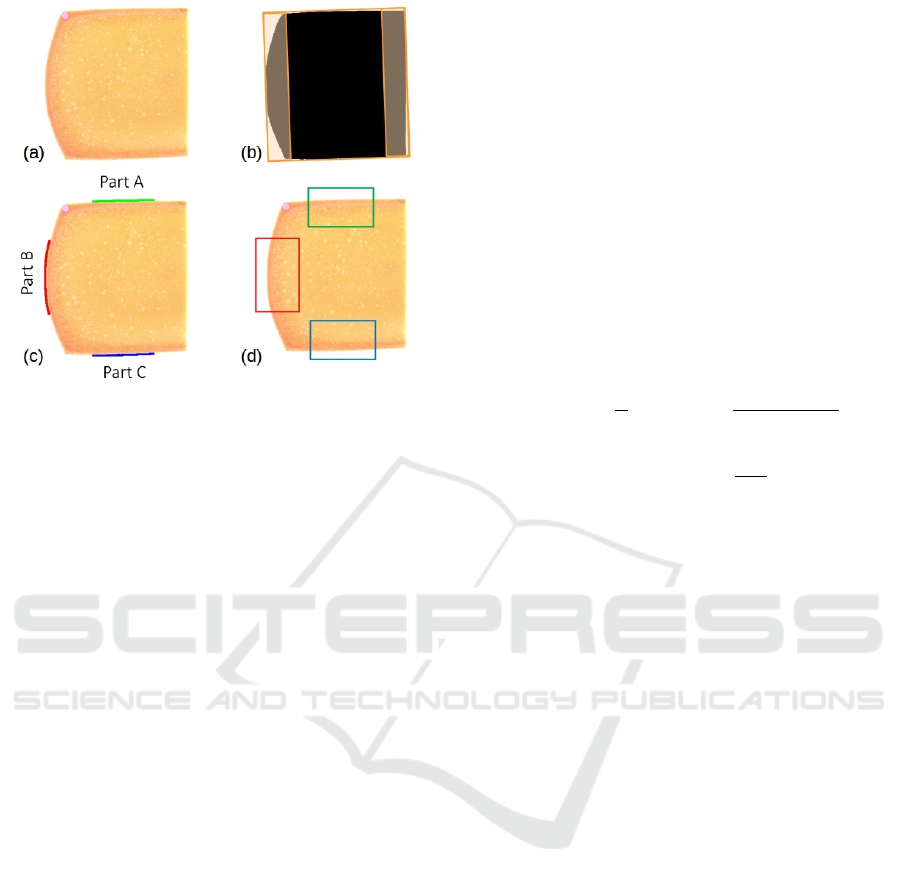
Figure 2: In (a) a wire-cut left slice of a cheese wheel. In
(b) the mask F of the cheese area (possibly rotated to align
its minimum bounding rectangle with the axes) with the two
stripes where to focus for the localization of the heel side.
In (c) the 1-pixel-thick parts P
A
, P
B
, P
C
along the border ∂F.
In (d) the final regions R
A
, R
B
and R
C
, around, respectively,
P
A
, P
B
and P
C
, corresponding to the areas observed by the
experts; they are used for training and testing the proposed
network.
deeper network, such as ResNet50, without achiev-
ing better results. As ResNet18 resulted superior to
the deeper ResNet50, we tried a shallower network,
i.e., a ResNet variant with only 10 layers. However,
this network did not boost the performance. We also
tried more recent and sophisticated architectures and
approaches, such as ShuffleNet (Zhang et al., 2018),
RegNet (Radosavovic et al., 2020), ConvNeXt (Liu
et al., 2022) and CLIP (Radford et al., 2021). How-
ever, we did not obtain any improvement. A more
in-depth investigation into why this is the case is left
for future work.
4.1 Data Augmentation
Data augmentation plays a central role in overcoming
the small number of available samples. We adopted
different data augmentation techniques, some more
beneficial than others. Overall, the best results were
achieved using color jittering, random rotation (from
−5 to +5 degrees), horizontal flipping, and random
cropping. The latter was the most relevant: from
an input region randomly extracts smaller and dif-
ferent patches of a fixed size. The smaller the crop-
ping size, the higher the number of different patches
is. Nevertheless, a too-small patch forces the net-
work to focus only on a specific subpart of the rind,
while the ground-truth represents the average of the
whole side and the thickness is not perfectly uniform.
For this reason, the size of 180 × 130 pixels (about
52 × 38 mm) used for random cropping had to be ac-
curately determined.
4.2 Customized Loss
As described in Section 3, the ground-truth was ob-
tained using measures from a panel of 12 experts.
However, there are regions for which the experts
agree more than others. For a given region, the Mean
Absolute Deviation (MAD) around the ground-truth
is a measure of how much the experts actually agree
on the thickness of that region. To get the most out
of this information, we defined a custom loss based
on the Mean Squared Error (MSE) but incorporating
ground-truth uncertainty as follows:
L(Y, T ) =
1
C
∑
i
∑
p∈{A,B,C}
(Y
i,p
− T
i,p
)
2
D
i,p
(5)
C =
∑
i
∑
p∈{A,B,C}
1
D
i,p
(6)
where C is a normalization factor, Y the set of predic-
tions, T the set of ground-truths, and D
i,p
the MAD
for region R
i,p
. The defined loss helps the network
focus on the regions for which experts agree the most
and, therefore, those for which the assigned ground-
truth is more significant.
5 EVALUATION
In this section, we present the results of the experi-
ments of the proposed method, including the evalua-
tion protocol, the experimental setup, and an alterna-
tive estimation algorithm, based on a classical image
analysis approach, for performance comparison.
5.1 Evaluation Protocol
The major limitation in validating our method was
the small number of images available. Splitting the
dataset into standard train, validation, and test sets
would have resulted in too small sets. Therefore, we
employed a nested cross-validation strategy using an
ensemble of models to validate our method in a fair
yet exhaustive way.
First, we divided the 90 images into nine folds,
each containing 10 images, i.e., five pairs of left and
right slices. Since the left and the right slices be-
long to the same wheel, they could be correlated, both
in terms of ground-truth and image content. Mix-
ing them up in different folds could introduce poten-
tial bias. For this reason, we created nine folds so
A Deep Learning Approach for Estimating the Rind Thickness of Trentingrana Cheese from Images
79

that every wheel appears in one and only one fold.
For every split, we therefore had 80 images for train-
ing/validation and 10 for testing. Again, we split the
80 images into ten different folds, each containing
four pairs of slices. We used nine folds for training
and left one out for validation. We selected the best
model according to the validation set and repeated the
same procedure ten times every time holding out a dif-
ferent 8-images fold for validation. Therefore, lever-
aging the 80 images for training/validation, we got ten
different models. We then made inferences for each of
them on the 10-images test set and averaged the pre-
dictions through model ensembling. Finally, we repli-
cated the entire procedure for all nine initial splits to
obtain a prediction for each region in the dataset.
5.2 Experimental Setup
We trained every model for 200 epochs using as op-
timizer AdamW (Loshchilov and Hutter, 2018) (β
1
=
0.9, β
2
= 0.999, λ = 0.001), a batch size of 32, and a
cosine annealing schedule with an initial learning rate
of 0.001. For each training, we then chose the model
with the lowest MAE according to the 8-images hold-
out validation set after the first 100 epochs. All the ex-
periments involving neural networks were performed
on a GPU NVIDIA 1070 Ti.
5.3 An Hand-Crafted Algorithm
We compared our deep learning method with the
baseline provided by a “traditional” computer vision
method we previously implemented for detecting the
rind: a specific hand-crafted algorithm, shortly called
HCA. We devised such an algorithm based on the em-
pirical evidence that the rind of the cheese is darker
than the interior because of its higher density and that
the paste has a fairly uniform coloring, although not
constant. Thus, the rind thickness can be detected by
searching for a color variation in the image analyzing
adjacent regions close to the three parts of interest.
HCA takes as input the image of a slice and ex-
tracts the 1-pixel-thick parts P
A
, P
B
, P
C
as done in the
data preparation step for the deep learning method.
To highlight as much as possible the variation be-
tween rind and paste, and to attenuate an illumination
gradient due to the acquisition device, the image is
pre-processed by means of a color edge-preserving
smoothing followed by an intensity normalization
step. HCA works on this last image, named G. Let P
be an element in {P
A
, P
B
, P
C
} and R the corresponding
rectangular region in {R
A
, R
B
, R
C
}. HCA computes
n + 1 regions P
0
:= P, P
1
= S(P, 1), . . . , P
n
= S(P, n),
where P
i
is obtained by shifting P
0
by i pixels towards
the cheese interior. n was fixed in such a way to en-
sure the scanning of a sufficiently large area to in-
clude both rind and paste, i.e., approximately 5 cm
expressed in pixels. For each i, HCA computes the
median of G’s values along P
i
and plots it with respect
to i (Figure 3). In this way, HCA builds up the projec-
tion function f : {0, . . . , n} → [0, 255] such that f (i) is
the median value of the G values over P
i
. We choose
to compute the median as it is not affected by outlier
values due, for example, to the presence of crystals in
the paste.
The plot of f usually shows a shape that starts with
low values at the very first part of the rind (darker),
increasing inside the rind and sub-rind area, followed
by a flat area generated when scanning the paste re-
gion. HCA estimates the rind thickness for each part
of interest P by analyzing the generated f as follows.
1. Compute the value V
j
of f in the plateau zone. V
j
is estimated as the median of all the pixels belong-
ing to the zone obtained by a strong shrink of the
mask F (corresponding to 2 cm, to overpass the
rind) and the rectangle R of the part P, in order to
capture a paste-only zone.
2. Compute the local minima of S
f
and the depth
of their basins, where S
f
indicates a Gaussian
smoothing of f . Discard the minima with low
depth and those with ordinate too close to V
j
;
select the minimum M = (M
i
, M
j
) having the
greater abscissa i.
3. Determine the transition point U = (U
i
,U
j
) with
U
i
> M
i
. The transition point should define the
end of the rind zone. Depending of the cheese
slice this can be more or less marked: this is ex-
pressed by the slope of f between M and the start-
ing point of plateau V .
In the current implementation of HCA U
j
is de-
fined as:
U
j
= (1 − µ)M
j
+ µV
j
, (7)
where µ is a real-valued coefficient ranging be-
tween 0 and 1. In this implementation, µ has been
set empirically to 0.3.
The end of the rind region is determined in HCA
by selecting in the set f
−1
(U
j
) the point in the in-
terval (M
i
,V
i
) with greater abscissa. We observe
that the value of µ has little influence on the posi-
tion of U
i
if the ramp between M and V is steep,
i.e., when the separation between rind and paste
is quite clear. The position of U
i
can be influ-
enced more significantly by the choice of µ in the
case where the transition between rind and paste
is very smooth. This agrees with the uncertainty
of different annotators in cheese slices that exhibit
a gradual transition.
IMPROVE 2023 - 3rd International Conference on Image Processing and Vision Engineering
80
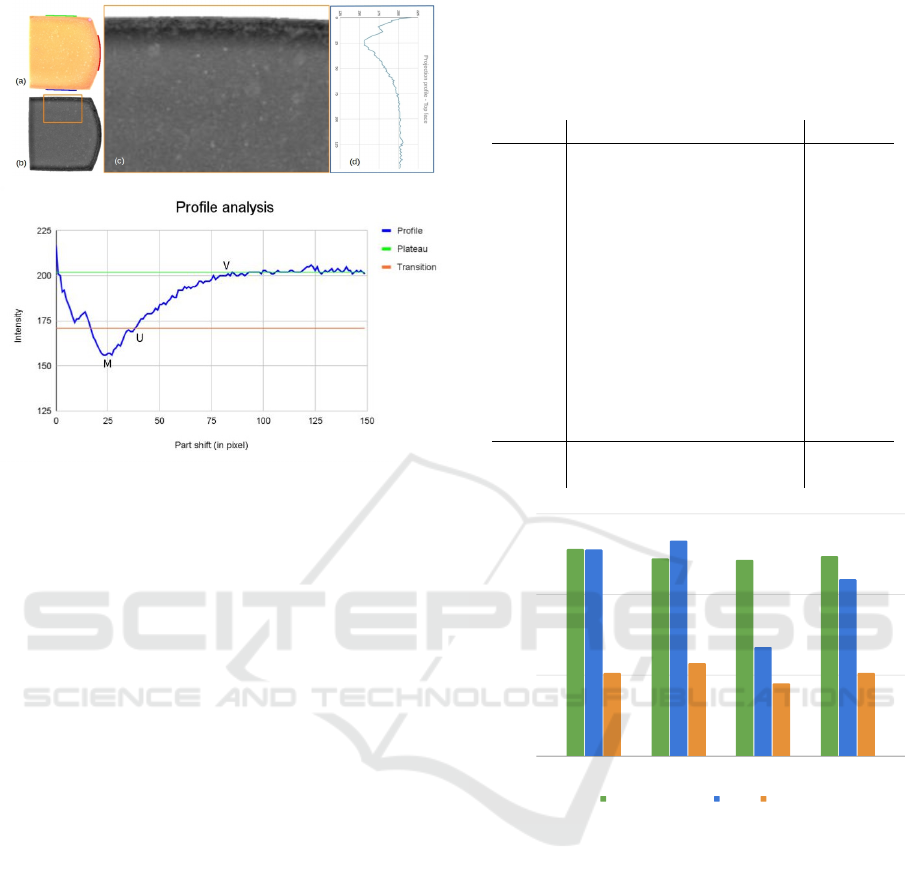
Figure 3: In (a) a right slice, where the parts A, B and C
are marked in color. In (b) an intensity normalization of
(a). In (c), the intensity values of a region adjacent to part
A are considered to build the plot f , in (d). Below is an
illustration of the profile analysis: the green line highlights
the plateau, while the estimated transition line, between the
plateau and the selected minimum M of f , is depicted in
orange. Finally, U indicates the point used to compute the
rind thickness, which corresponds to its abscissa.
5.4 Results of the Experiments
In this section, we present the results of the proposed
deep learning-based method and we compare it with
HCA and the pool of 12 human experts in terms of
MAE (Table 1).
Figure 4 summarizes the performance of the pro-
posed deep learning method and compared it with
HCA for the three slice regions and globally. The fig-
ure includes also the average error of the 12 experts.
It is noteworthy to specify that the ground-truth was
defined as the average prediction of the 12 experts,
which is different from the average error of the ex-
perts. Considering globally all the three regions, the
MAE for the deep learning method is 0.51 mm, while
for HCA it is 1.10 mm, which is in line with the MAE
for the human experts, about 1.24 mm.
The comparison with a classical method based
on manual, albeit accurate, feature selection was
introduced to highlight how, in this case, the deep
learning approach achieves significantly better per-
formance while avoiding the critical task of selecting
features and setting thresholds and parameters typical
of traditional methods.
Table 1: Mean Absolute Error (MAE) in millimeters
achieved by the pool of human experts (E), the Hand-
Crafted Algorithm (HCA) and the Neural Network (NN).
MAE
i
represents the MAE for region i, where i ∈ {A, B,C}.
E–avg is the average error produced by the 12 experts.
MAE
A
MAE
B
MAE
C
MAE
avg
E–01 1.06 1.10 0.84 1.00
E–02 0.87 1.17 1.07 1.04
E–03 1.53 1.24 1.43 1.40
E–04 1.13 1.07 1.32 1.17
E–05 1.02 1.09 1.07 1.06
E–06 1.23 1.30 0.84 1.12
E–07 1.22 0.97 1.09 1.10
E–08 1.28 1.46 1.34 1.36
E–09 0.93 1.12 0.81 0.95
E–10 1.68 1.87 1.83 1.79
E–11 1.93 1.49 1.54 1.65
E–12 1.49 0.79 1.38 1.22
E–avg 1.28 1.22 1.21 1.24
HCA 1.28 1.33 0.67 1.10
NN 0.51 0.58 0.45 0.51
Mean Absolute Error (mm)
0
0.5
1
1.5
A B C Average
Human Experts HCA NN
Figure 4: Graphical comparison of the error produced by
the pool of human experts (average), the Hand-Crafted Al-
gorithm (HCA) and the proposed Neural Network (NN).
Mean Absolute Error (in millimeters) is reported separately
for regions A, B,C and their average.
Moreover, to check whether the network actually
learned how to measure rind thickness, we visualize,
in Figure 5, the areas of the input images that most
influenced the final prediction. We used a Grad-CAM
variant for visual explanations of network decisions in
regression problems (Akikawa and Yamamura, 2021).
The two depicted examples show how the network,
indeed, relies on reasonable areas of the input images
for predicting the thickness.
In Figure 6, we highlight how the estimates pro-
vided by the neural network follow the ground-truth
by sorting the ground-truth thickness of the regions
in increasing order (blue) and plotting the correspon-
A Deep Learning Approach for Estimating the Rind Thickness of Trentingrana Cheese from Images
81
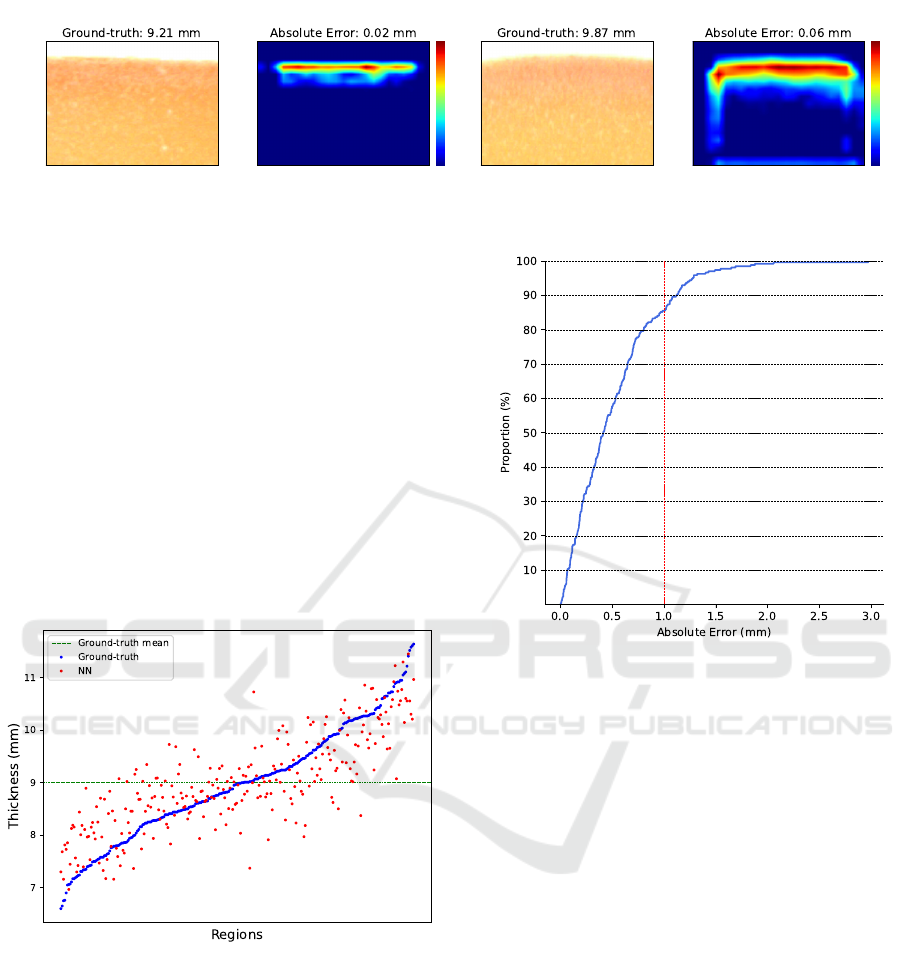
Figure 5: Grad-CAM visualizations for two different input images. Colors from blue to red indicate the increasing importance
of the corresponding areas to determine the final estimation.
dent network estimates (red). We can observe that
the network maintains, in trend, the ordering of mea-
sures. Indeed, the network does not predict a mean
value for all the samples but, instead, tends to raise
the prediction for regions with a thicker rind and to
lower it for regions with a thinner rind. This is also
supported by the R2-Score achieved, which is 0.68,
meaning that the MSE for the network is less than a
third of the MSE for a constant model always pre-
dicting the ground-truth mean regardless of the input
images (green dashed line in Figure 6).
Finally, Figure 7 shows the cumulative curve in-
dicating for a given absolute error (x-axis) the per-
centage of regions whose estimation error is below it
(y-axis). We can observe that up to 85% of the cases
exhibits an error lower than 1.0 mm.
Figure 6: Comparison between the Neural Network (NN)
predictions and the ground-truth. On the x-axis, the regions
are ordered by their ground-truth thickness to highlight the
correlation between the real and the predicted thickness.
6 CONCLUSIONS AND FUTURE
WORKS
This paper focused on the quality assessment of PDO
Trentingrana cheese, and, in particular, it proposed
an innovative deep learning-based method to estimate
the thickness of its rind. Currently, this estimation is
performed by a pool of experts by observing the phys-
Figure 7: Empirical Cumulative Density Function (ECDF)
of the error for the deep learning-based approach.
ical object, but their work requires time, the simulta-
neous presence of the team at the lab, is subjective,
and is rather expensive. Automation of this process
is therefore desired to support panels in visual inspec-
tion. The proposed method implements a regression
technique that learns the cheese thickness from a set
of measurements collected by human experts. In ma-
chine learning approaches, the number and quality of
data used for training determine the accuracy of the
results. In this regard, we had very little data at our
disposal.
In our work, we carefully devised a procedure
to automatically extract rectangular regions around
points of interest from an image of a cheese slice. We
applied different augmentation stages to overcome the
lack of available data. The network was then thor-
oughly tested using a nested cross-validation proce-
dure on 90 cheese slice images, i.e., 270 regions, re-
porting highly satisfactory results. Indeed, as shown
in Section 5, the MAE reported by our method is
0.51 mm, i.e., less than half the MAE produced on
average by the experts. Moreover, our deep learning-
based approach enabled better results than a hand-
crafted method, which was specifically implemented
IMPROVE 2023 - 3rd International Conference on Image Processing and Vision Engineering
82

to localize accurately the transition between cheese
rind and paste.
Future work will be devoted to providing a more
comprehensive characterization of the rind thickness,
for instance, by measuring it in other parts of the
cheese wheel, like in the angles formed by the heel
and the upper and lower faces. We are furthermore
interested in investigating the estimation of the rind
thickness using images depicting rock-cracked cheese
slices rather than wire-cut. In this new scenario, the
hand-crafted algorithms have little chance of success
because there are even fewer visual changes in the
transition from the rind to the paste.
Finally, rind thickness is only one of the features
considered by the internal quality panel of Trentin-
grana Consortium. Automatic estimation of other vi-
sual characteristics, such as paste color and texture,
could be a topic for future research to provide more
comprehensive support to experts.
ACKNOWLEDGEMENTS
The research was funded by Trentingrana - Consorzio
dei Caseifici Sociali Trentini, Italy and by the Au-
tonomous Province of Trento, Italy (as part of the
ADP funding prot. n. 244380 dd 04/05/2020 and
the TRENTINGRANA project - RDP 201-202, CUP
C66D17000180008).
REFERENCES
Akikawa, M. and Yamamura, M. (2021). Materializing
Architecture for Processing Multimodal Signals for
a Humanoid Robot Control System. Journal of Ad-
vanced Computational Intelligence and Intelligent In-
formatics, 25(3):335–345.
Badaro, A., de Matos, G., Karaziack, C., et al. (2021). Au-
tomated Method for Determination of Cheese Melta-
bility by Computer Vision. Food Analytical Methods,
14:2630–2641.
Bosakova-Ardenska, A., Panayotov, P., Boyanova, P., and
Pashova, E. (2020). Application of Images Segmenta-
tion for Evaluation Structure of White Brined Cheese.
In International Conference on Information Technolo-
gies, pages 1–4.
Brosnan, T. and Sun, D.-W. (2004). Improving Quality In-
spection of Food Products by Computer Vision - A
Review. Journal of Food Engineering, 61(1):3–16.
Du, C.-J. and Sun, D.-W. (2004). Recent Developments in
the Applications of Image Processing Techniques for
Food Quality Evaluation. Trends in Food Science &
Technology, 15(5):230–249.
EyeQuestion (Accessed: Dec 2022). https://eyequestion.nl.
He, K., Zhang, X., Ren, S., and Sun, J. (2016). Deep Resid-
ual Learning for Image Recognition. In IEEE Con-
ference on Computer Vision and Pattern Recognition,
pages 770–778.
Jackman, P. and Sun, D.-W. (2013). Recent Advances in Im-
age Processing using Image Texture Features for Food
Quality Assessment. Trends in Food Science & Tech-
nology, 29(1):35–43.
Lei, T. and Sun, D.-W. (2019). Developments of Nonde-
structive Techniques for Evaluating Quality Attributes
of Cheeses: A review. Trends in Food Science & Tech-
nology, 88:527–542.
Liu, Z., Mao, H., Wu, C., et al. (2022). A ConvNet for the
2020s. In IEEE Conference on Computer Vision and
Pattern Recognition, pages 11966–11976.
Loshchilov, I. and Hutter, F. (2018). Decoupled Weight De-
cay Regularization. In International Conference on
Learning Representations.
Lukinac, J., Juki
´
c, M., Mastanjevi
´
c, K., and Lu
ˇ
can, M.
(2018). Application of Computer Vision and Image
Analysis Method in Cheese-Quality Evaluation: a Re-
view. Ukrainian Food Journal, 7(2):192–214.
Ma, J., Sun, D.-W., Qu, J.-H., et al. (2016). Applications
of Computer Vision for Assessing Quality of Agri-
Food Products: A Review of Recent Research Ad-
vances. Critical Reviews in Food Science and Nutri-
tion, 56(1):113–127.
Radford, A., Kim, J. W., Hallacy, C., et al. (2021). Learn-
ing transferable visual models from natural language
supervision. In International Conference on Machine
Learning, pages 8748–8763.
Radosavovic, I., Kosaraju, R. P., Girshick, R., et al. (2020).
Designing network design spaces. In 2020 IEEE/CVF
Conference on Computer Vision and Pattern Recogni-
tion (CVPR), pages 10425–10433.
Russ, J. C. (2015). Image analysis of foods. Journal of Food
Science, 80(9):E1974–E1987.
Russakovsky, O., Deng, J., Su, H., et al. (2015). Imagenet
large scale visual recognition challenge. International
journal of computer vision, 115(3):211–252.
Sun, D.-W. (2016). Computer Vision Technology for Food
Quality Evaluation. Academic Press.
Turgut, S. S., Karacabey, E., K
¨
uc¸
¨
uk
¨
oner, E., et al. (2014).
Potential of image analysis based systems in food
quality assessments and classifications. In 9th Baltic
Conference on Food Science and Technology, pages
8–12.
Zhang, X., Zhou, X., Lin, M., and Sun, J. (2018). Shuf-
fleNet: An extremely efficient Convolutional Neural
Network for mobile devices. In IEEE Conference
on Computer Vision and Pattern Recognition, pages
6848–6856.
A Deep Learning Approach for Estimating the Rind Thickness of Trentingrana Cheese from Images
83
