
3D Geospatial Data Management Architecture for Common Operational
Picture Functionalities in Emergency Response
I
˜
naki Cejudo
a
, Eider Irigoyen
b
, Harbil Arregui
c
and Est
´
ıbaliz Loyo
d
Intelligent Systems for Mobility and Logistics, Vicomtech Foundation, Basque Research and Technology Alliance (BRTA),
Mikeletegi 57, Donostia, Spain
Keywords:
Emergency Management, Disaster Response, Command and Control, Location Based Services.
Abstract:
In disaster management, the emergency response commanded from the Command and Control center can
make the difference for a faster and safer outcome. Novel sensing tools provide new capabilities to monitor
and evaluate what happens in real time with location information of first responders and casualties being a
key resource. Therefore, Geographical Information Systems (GIS) are essential when representing the Com-
mon Operational Picture to have a complete understanding of the situation in the field, obtained through big
amounts of real-time data coming from multiple sources, and therefore support decision making. Moreover,
the 3-dimensional representation of the terrain and buildings enhance the classical 2D map representation. In
this work, a detailed overview of the architecture components and functionalities developed for a data-driven
emergency response 3D web GIS application is described. In addition, a quantitative evaluation of how the
number of location records collected from various numbers of first responders impacts the performance of
some geospatial tasks needed for an efficient visual representation is provided, depending on the data mea-
surement frequency.
1 INTRODUCTION
Common Operational Picture (COP) and Situational
Awareness (SA) are key capabilities in disaster and
emergency management. The first one, COP, consists
of a unique display of the operational data, to tackle
the perceived ambiguity and enable a shared overview
of the crisis and the progress of the response oper-
ation to be developed (Treurniet and Wolbers, 2021).
The operational data my consist of hazards, resources,
means, actions, and incidents (Jagusiak and Pokorski,
2022). The second one, SA, stands for the perception
of the elements of the environment within a volume
of time and space, the comprehension of their mean-
ing, and the projection of their status in the near future
(Endsley, 2021).
The use of maps is one extended way of repre-
senting the COP of an emergency management as it
evolves. In this sense, the transition from 2D to 3D
maps is a significant improvement that helps first re-
sponders (FR) to understand the emergency environ-
a
https://orcid.org/0000-0002-7325-9350
b
https://orcid.org/0000-0001-9486-0906
c
https://orcid.org/0000-0002-7934-9250
d
https://orcid.org/0000-0001-8232-2828
ment from an additional perspective with details such
as terrain slopes or building structures.
Moreover, new advances in the technology for
civil protection, law enforcement, fire services, search
and rescue or medical team members open a wide
range of sensing capabilities and data sources that are
worth being represented and exploited, for a safer and
more efficient response. For instance, there is a pro-
gressive increase in the technological offer of tools
that provide real-time indoor and outdoor geolocation
capabilities. Taking advantage of these tools opens
challenges when handling big amounts of heteroge-
neous positioning records, that need to be efficiently
processed, stored, represented and exploited.
The present paper aims to describe the architec-
ture and technology stack chosen to create a 2D/3D
geospatial data management solution providing a set
of key functionalities in a Command and Control cen-
tre during emergency response. The solution can be
easily installed in a cloud server or in a dedicated
computer on-premises. Then, a small comparison is
given to assess how the number of location records
collected from various numbers of first responders de-
pending on its frequency can impact the response time
when performing some computation tasks.
48
Cejudo, I., Irigoyen, E., Arregui, H. and Loyo, E.
3D Geospatial Data Management Architecture for Common Operational Picture Functionalities in Emergency Response.
DOI: 10.5220/0011837800003473
In Proceedings of the 9th International Conference on Geographical Information Systems Theory, Applications and Management (GISTAM 2023), pages 48-59
ISBN: 978-989-758-649-1; ISSN: 2184-500X
Copyright
c
2023 by SCITEPRESS – Science and Technology Publications, Lda. Under CC license (CC BY-NC-ND 4.0)

2 LITERATURE REVIEW
In disaster management, first responders with very
different roles and backgrounds participate and the
heterogeneous information received in real time must
be shown in an understandable way for better deci-
sion making. There are many use cases where Geo-
graphical Information Systems (GIS) technology can
be of great help in multiple ways (Abdalla, 2016):
Earthquakes and humanitarian coordination (the use
of cutting edge GIS calculations to take care of an
outline issue), wild fire (can be useful in identifying
high-hazard regions within given vicinity and restrict
the fire spread and thus minimize the impact), dust
storms (to give the accompanying capacities in man-
aging dust storms disaster management), health haz-
ards (is capable in extreme heat attacks, by providing
the degree and application for spatially analyzing the
distribution of services and its relation to the popu-
lation at risk), terrorism (capacity of using progress-
ing 3D GIS for the headway and execution of GIS-
based intelligent emergency response systems). Spa-
tial analysis provides effective tools for managing risk
and solving the mapping and assessment of hazards.
It is also interesting in that it provides visual models
that help decision-makers make the best use of these
advancements.
The study of natural dangers and disasters in three
dimensions has grown significantly during the past
few years, because the interest and preference of end
users towards 3D is high. Some authors argue that
3D maps have the potential to improve the disaster
management process (Bandrova et al., 2012), since
three-dimensional maps can resolve many perception
problems and provide more clearly presented infor-
mation. User interviews in that study confirmed that
young people prefer 3D information. A questionnaire
carried out in another study (Zlatanova, 2008), with
71 users directly involved in the emergency response
(firefighters: 27, police: 11, and municipality: 33)
concluded that 3D visualization was considered im-
portant by 62% of the users. This was found as a
rather high result considering that half of the users
were not familiar with (GIS).
Some works, nevertheless, stress that most of the
conventional disaster management systems lack the
support for multiple new data sources and that real-
time big data processing tools that can assist decision
makers with quick and accurate results (Shah et al.,
2019).
In this sense, geo-spatial data or data with location
component is considered as the most essential input
element in latest technologies. The geo-spatial data-
sets need to be analyzed to gain information about
disaster locations as it occurs, identify the area and
people that require urgent assistance and locate ap-
propriate areas for shelters to name the least. With
the advent location-based sensors and smartphones
equipped with GPS, a huge volume of geo-spatial data
is generated. Spatial temporal data visualization re-
quires powerful tools that support analysis of geo-
spatial data over time through interactive visualiza-
tion.
Enabling 3D navigation for rescuers in unknown
indoor and outdoor environments, thanks to accu-
rate 3D positioning, simplifies the logistics of emer-
gency operations (Zlatanova et al., 2004), (Kolawole
and Hunukumbure, 2022). Some works have focused
on the use of images from Unmanned Aerial Vehi-
cles (UAVs) for 3D modelling. 3D reconstruction
of the scene has been proved as a crucial aspect for
an efficient management of search and rescue efforts
(Verykokou et al., 2018), (Mysiris et al., 2018). Ex-
ploiting different heterogeneous sources such as ge-
olocated security cameras and their field of view has
also been a topic for other research works (Hong et al.,
2019). Therefore, supporting 3D maps representa-
tions in the Command and Control Centre, with real-
time location information visualisation and analysis
are very relevant.
However, it is difficult to exchange and incorpo-
rate 3D data sets, and make them work seamlessly
with 2D spatial data resources. Therefore, the defi-
nition and use of standards is important. There are
many different designers and creators of 3D standards
and models. A large number of models are vendor-
based, although many others are developed by inter-
national standardization organizations and come from
the CAD/BIM, GIS, or Web domains. For instance,
the Web Map Service (WMS) is a specification de-
veloped by the Open Geospatial Consortium (OGC),
that has also become an ISO standard (Jagusiak and
Pokorski, 2022), for serving georeferenced map im-
ages over the Internet. These images are typically
produced by a map server from data provided by a
GIS database. At the same time, 3D Tiles is another
OGC open standard for massive heterogeneous 3D
geospatial datasets such as point clouds, buildings,
photogrammetry, and vector data.
Some well-known software solutions imple-
ment these and other standards. For instance,
Geoserver (Iacovella, 2017), an open source map
server for sharing geospatial data used in some
emergency management applications (such as (Li
et al., 2015)), implements WMS, Web Feature Ser-
vice (WFS) Web Coverage Service (WCS), and
additional protocols like Web Processing Service
(WPS) through available extensions. CesiumJS
3D Geospatial Data Management Architecture for Common Operational Picture Functionalities in Emergency Response
49

(https://cesium.com/platform/cesiumjs/), is an open
platform that implements 3D Tiles and uses the map
engine of WebGL to provide multi-dimensional earth
and real terrain display. Some recent works have used
this platform for representing virtual situations for ur-
ban road emergency training (Gao et al., 2022). How-
ever, for the authors knowledge, no other works have
presented a platform architecture to be used during
emergency response, ready for being integrated with
additional data sources in real time.
3 ARCHITECTURE
3.1 Architecture and Components
The solution is formed mainly of a CC web applica-
tion, a set of databases, a map serving tool and an
API server that hosts the business logic offering the
functionalities on top of the emergency database to
the web application (Fig. 1). In addition, a set of aux-
iliary tools and components support other tasks such
as the user authentication and the interaction with ex-
ternal data sources. The proposed solution also in-
cludes two client applications relying on augmented
reality to offer the first responders deployed in the
field an enhanced understanding of their surrounding
(for smartphone and smart see-through glasses).
3.1.1 CC Web App Interface
The proposed solution is a web-based Command and
Control application with geospatial visualization and
geocomputation capabilities. Its main objectives are
the representation of the area of the scenario and a
real-time visualization of the spatial types of data of
elements (FR, sensors, geolocated elements...) that
are taking part. Data is obtained from third party tools
that are able to monitor different elements while run-
ning an emergency planning/operation. The applica-
tion includes user management capabilities and emer-
gency inventory management. The frameworks used
to build the application are:
• JHipster (Raible, 2016): Open source develop-
ment platform to generate, develop and deploy
web applications and microservices.
• CesiumJS: Open source javascript library for cre-
ating 3D globes and maps. Its main strength is the
3D geospatial visualization.
3.1.2 Geoserver
Geoserver (Iacovella, 2017) is a well-known open
source server for sharing geospatial data. It also
has geocomputation capabilities. It implements OGC
protocols such as Web Feature Service (WFS), Web
Map Service (WMS) or Web Processing Service
(WPS). Geoserver serves as a map serving tool for
the web based application. Contents have been added
from OpenStreetMap (Bennet, 2010). Apart from
serving the base map layer to the web application,
Geoserver is also used for heatmaps representation
and emergency centroid calculation. This centroid is
calculated based on all the elements associated to an
emergency and is used to center the map when visu-
alising to the command and control operator user.
3.1.3 Relational Databases
The architecture involves one main relational
database (Emergency database) persisting the real-
time and historical information of the evolution of the
disaster response. Other databases are used for user
authentication and for the storage of map base layers
information. Postgres (Momjian, 2001) was selected
for these databases, with the PostGIS extension (not
needed for the authentication database).
3.1.4 API Server
The main business logic of the emergency manage-
ment is provided by an API server consisting of a
set of REST API methods, working on top of the
Emergency database, developed in Java Spring Boot
(Walls, 2016).
3.1.5 Smartphone/Smart Glasses Augmented
Reality Client Applications
The CC WebApp interface is complemented with two
client application versions for the first responders de-
ployed in the field. They use augmented reality to
represent information of the relative location and dis-
tance to other first responders, their risk situation and
the relative location and distance of georreferenced
elements of interest (Arregui et al., 2022).
3.2 Interfaces and Input Data from
Other Tools
Data from different sources are received from a mid-
dleware system, also developed in the research project
but out of the scope of this paper. This system is in
charge of the management and fusion of multiple data
sources such as sensor information from wearables
or drones. It is a bundle of software services with
functionalities for data source management and se-
cure data flow among others. The API service devel-
oped includes a specific endpoint for each data source
GISTAM 2023 - 9th International Conference on Geographical Information Systems Theory, Applications and Management
50
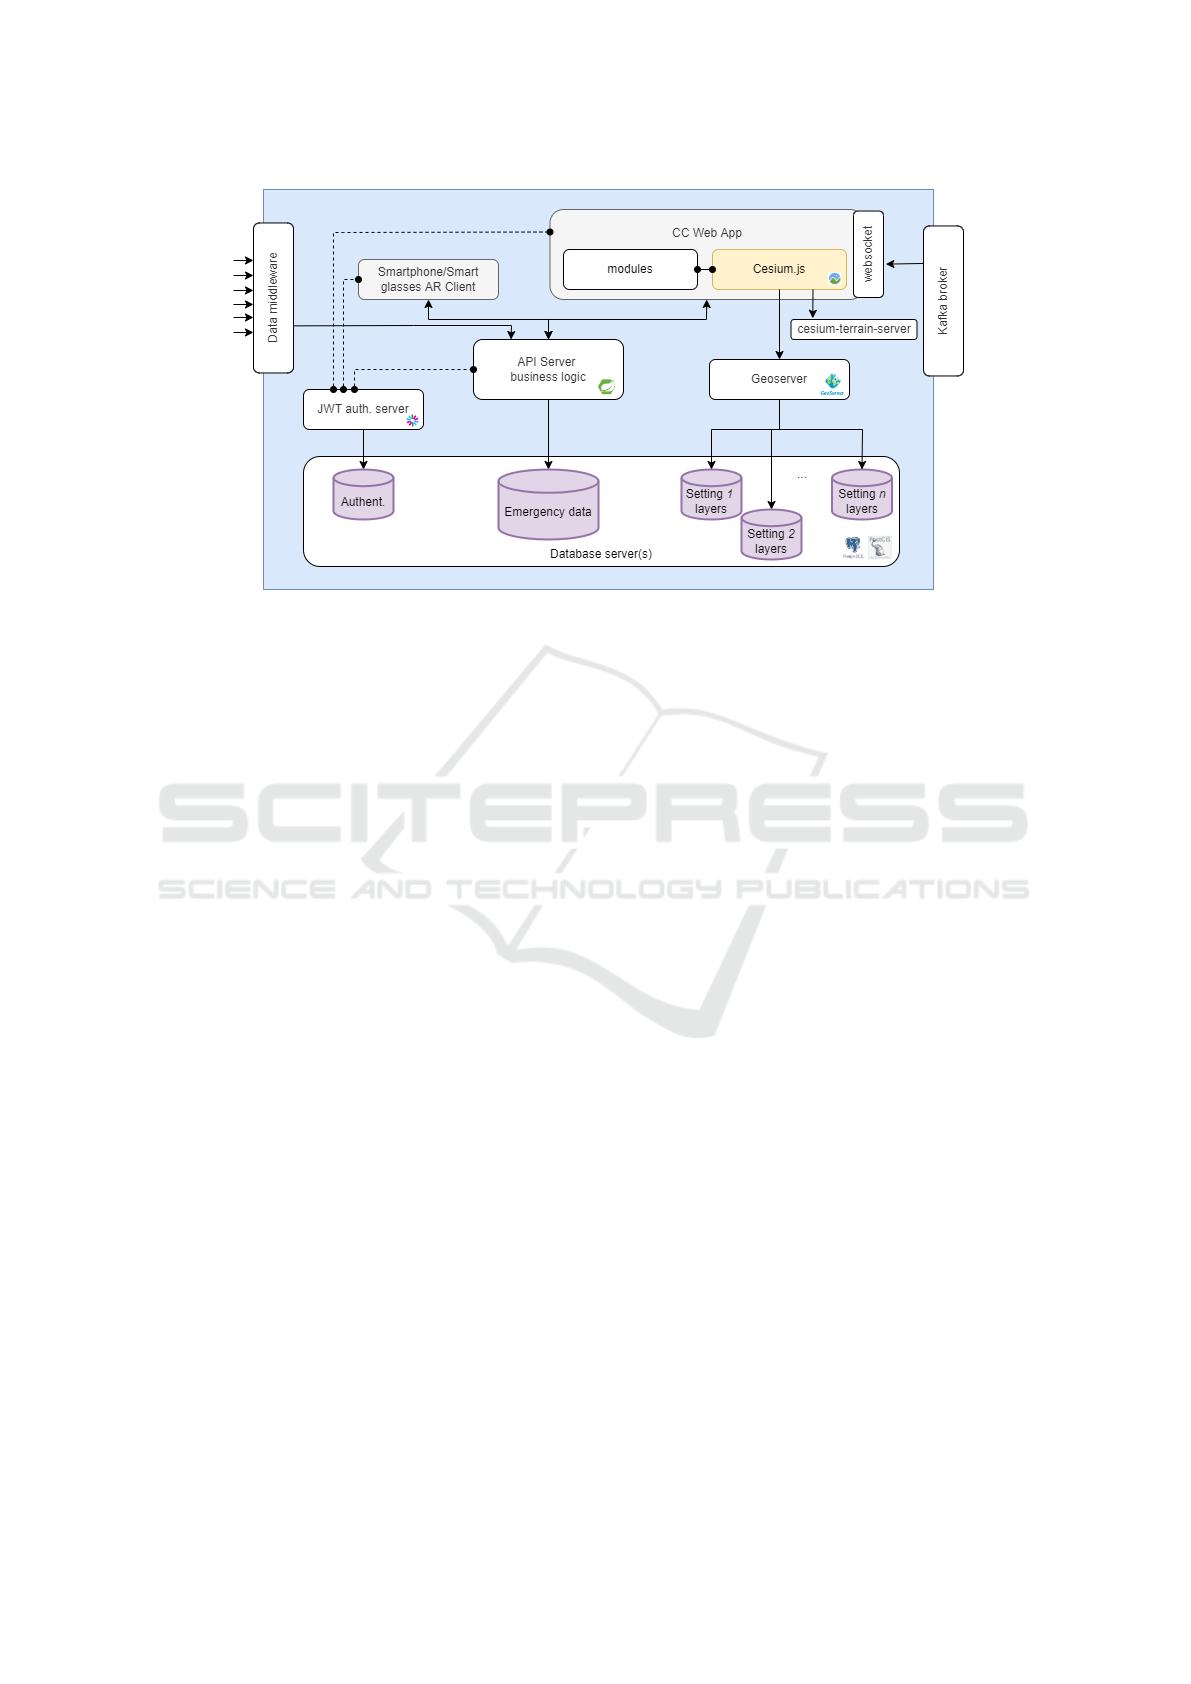
Figure 1: Architecture diagram of the technology stack.
and acts as a consumer of this middleware, so that the
received information can be exploited and persisted in
a structured manner.
Apart from this middleware system, a Kafka bro-
ker for asynchronous messaging has also been in-
cluded. This broker interacts with a websocket used
by the CC WebApp to represent received alerts in
real-time in the web user interface.
4 MAIN FUNCTIONALITIES
PROVIDED
After describing the main components in the previous
section, the main functionalities that the CC solution
provides are described in the following.
4.1 User Management
The concept of user management describes the ability
of administrators to manage and configure user access
to different IT resources such as services, applications
or systems. It is a key concept that enables security
and controls who is able to access what information
or service. A CC application requires a secure ac-
cess to handle and interact with all the information
and functionalities. This access is granted by the use
of user-based authentication.
4.2 Scenario Management
The same Command and Control application hosted
in a server or an on-premise deployment can be used,
in general, to operate in different emergencies and
geographical areas. This can occur in different time
frames or simultaneously. Therefore, having ways to
separate the scenarios is a useful capability. The man-
agement of the emergency scenario involves multiple
stages in order to setup all the configuration and de-
vice resources that need to be associated to the corre-
sponding first responders.
• Creation of a new setting. The concept of ”set-
ting” stands for an area where many emergencies
can be added. A setting can be, for instance, a
country, a state or a city.
• Creation of a new first responder
• Creation of a new emergency. Location, start date
and first responders can be specified among other
fields.
• Edition of an emergency
• Save a new device
• User configuration where an application user can
be assigned to a first responder.
• Adding or removing associations between first re-
sponders and devices they may carry or wear.
The creation of a new setting is enabled if sepa-
rate geographical areas are expected to be covered by
a unique deployment of the CC application. This en-
ables the association of each geographical area with
the available maps.
Inside a setting, multiple emergencies can be cov-
ered simultaneously. Each emergency is focused on
a more specific geographical area specified by the
limits of a bounding box. Running emergencies are
marked as “active” but finished ones and the asso-
ciated information recorded are persisted for future
3D Geospatial Data Management Architecture for Common Operational Picture Functionalities in Emergency Response
51
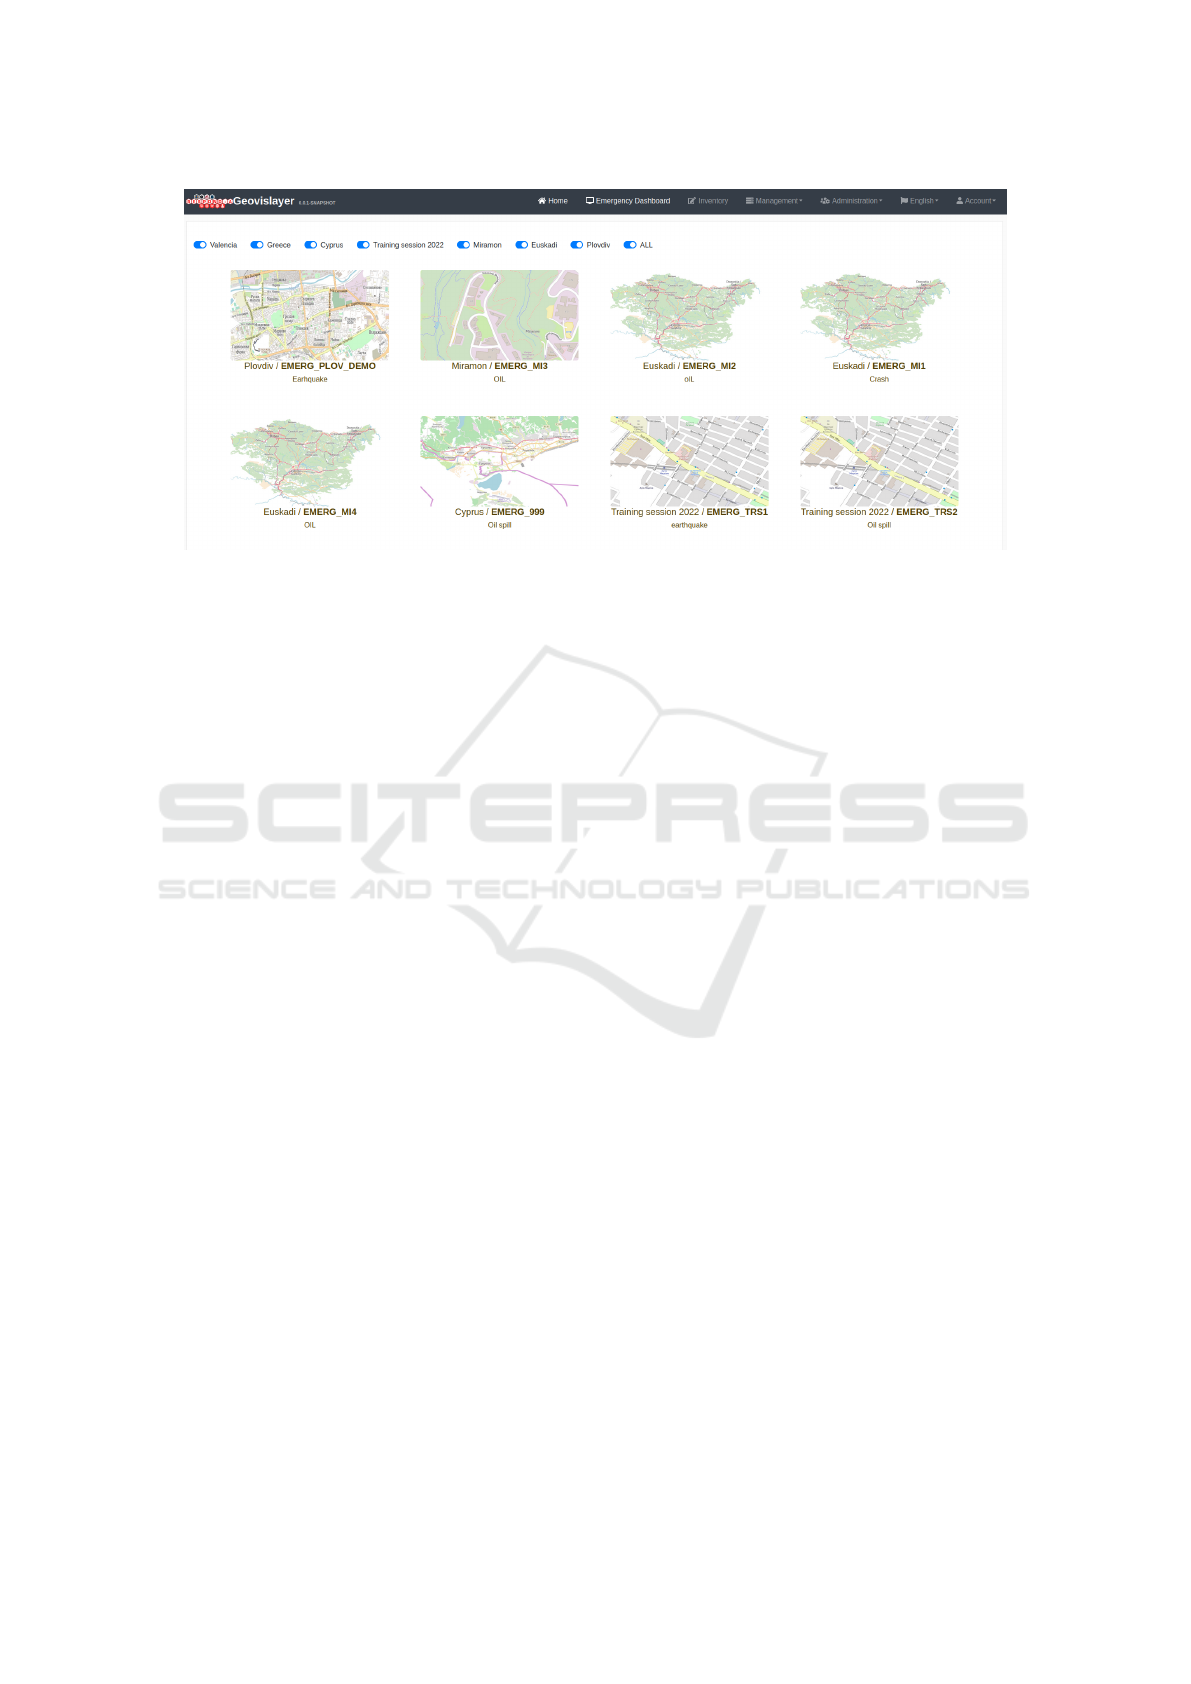
Figure 2: Emergency Dashboard to select an emergency.
post-emergency studies. The Emergency Dashboard,
Fig. 2, visualizes a screenshot and basic information
of all the created emergencies, and they can be filtered
by Scenarios. When any of these emergencies is se-
lected, the application enters in 3D map visualization
view.
In each emergency, a list of first responders is as-
signed.
4.3 Resource and Device Configuration
Multiple and heterogeneous types of resources are
usually used in an emergency operation. For instance,
first responders are personal resources. Other types of
resources can be vehicles, tools, machinery, sensors
or other equipment. Sometimes these resources need
to be associated to a given first responder. For in-
stance, the information coming from a wearable sen-
sor must be linked to a specific first responder.
Many of the tools developed in the current re-
search project are resources that provide different
kinds of data, shared through a common data mid-
dleware. This information is represented in the CC
application if the correct IDs are associated to the
first responder, for instance if the sensor is providing
the health status or positioning of the first responder.
However, not all devices need always to be attached to
a first responder. We address the following resources
or devices providing data: a) Video sources: stream-
ing video from sources like thermal cameras will need
to be configured in order to have access to their in-
coming contents; b) Drones; c) Wearables.
This association between a first responder and a
device needs to be done by emergency, since from one
emergency to another the personal resources and the
devices they will be using could rotate.
4.4 Layered 2D, 3D Maps and Road
Network Information
Geospatial base layers are key to represent the geo-
graphical context where the emergency operation oc-
curs. In summary, a map layer is a GIS component
containing groups of points, lines or polygon fea-
tures that represent real-world entities, or images (like
satellite imagery). They help locating what is happen-
ing, and where the personnel and technical resources
are in relation to other points of interest.
These kinds of layers are provided through
Geoserver, the selected open source standalone GIS
server which provides the main OCG capabilities to
work with 2D spatial tiles in an interoperable way, on
top of a PostGIS relational database server.
To construct the 2D maps, contents have been
downloaded from OpenStreetMap, and prepared to be
served through Geoserver in form of tiles. The road
network information is also extracted from Open-
StreetMap and incorporated to the PostGIS database
so that Geoserver can also serve it. To visualise a 3D
Terrain, a DEM (Digital Elevation Model) of the area
to be represented is required. For instance, a digital
elevation model of Cyprus has been used (Paraskeva,
2016). This file is processed in order to create tiles
and these are served using the OGC standard Web
Map Service (WMS).
Cesium (the underlying library of the CC appli-
cation) accepts heightmap or quantized-mesh type
tiles. The latter is more optimised for rendering.
To process and create the tiles the cesium-terrain-
builder-docker (https://github.com/tum-gis/cesium-
terrain-builder-docker) utility is used. Afterwards,
in order to serve the tiles, the cesium-terrain-server
(https://github.com/geo-data/cesium-terrain-server)
GISTAM 2023 - 9th International Conference on Geographical Information Systems Theory, Applications and Management
52

utility is used. The CesiumTerrainProvider compo-
nent will then be able to load the terrain from the
URL provided by the cesium-terrain-server server,
Fig. 3.
Figure 3: Representation of 3D terrain elevation.
4.4.1 Offline Mode
2D and 3D layers can usually be obtained through
third party map service providers, and this is a very
usual approach in software applications using maps.
But this requires a constant connection to their re-
mote servers. It is quite usual that during an emer-
gency, the access to internet is limited or completely
lost. And only a private local network is available to
ensure communication among first responders and the
emergency management tools. Using self-hosted ser-
vices such as Geoserver instead of relying on external
map providers, the lack of internet connection during
the critical situation does not restrict the map usage.
4.5 First Responder Localisation and
Tracking
This capability enables displaying the position of a
first responder over a digital map and see their posi-
tions change over time. It is key to ensure the Com-
mand and Control operators know where first respon-
ders in the field are, with an acceptable delay and an
acceptable precision in space. The accuracy of the
positioning will strongly depend on the device pro-
viding that data, but the Command and Control appli-
cation will need ensure that it is represented using the
correct spatial referencing system. The information
of all the geolocated first responders is shown on 2D
or 3D maps according to their real-time location, fol-
lowing stablished refresh-rates, which can be fixed or
personalised by each user.
Capabilities for outdoor and indoor localisation
are provided by the CC application, for instance, en-
abling 3D representations of buildings and the loca-
tion of the first responders at different levels. Ce-
siumJS includes the possibility of representing poly-
gons. For indoor locations of first responders or ca-
sualties, buildings can be represented as simple ex-
truded polygons or as specific 3D models created on
purpose. Fig. 4 is a 3D model example of a building.
Figure 4: 3D building for indoor representation.
4.6 Route Calculation
Route calculation is a functionality that helps obtain-
ing an optimal path to reach a final objective position
from a given initial position. This optimal path is usu-
ally computed as the path that implies the lowest cost.
The most common ways of quantifying this cost are
distance and travel time. Multiple well-known algo-
rithms exist to obtain optimal or near-optimal results
(sometimes a compromise must be found, because the
computation time to get the best result might be ex-
cessive). In general, the input for these algorithms is
a set of ways and nodes, modelled as a graph. Having
the road network imported as a graph is of high im-
portance in order to be able to compute shortest paths
by using algorithms like Dijkstra (Dijkstra, 1959) and
A* (Hart et al., 1968). The CC application enables the
calculation of the shortest path between two locations.
Currently, the changes of the road network due to an
incident are not supported but this is a functionality
envisioned for the future roadmap of the tool. After
requesting a route between two first responders, the
computed path is printed in the map, and distance and
duration information are displayed as shown in Fig.
5.
4.7 Cataloguing and Location of
Necessary Equipment and
Geospatial Elements
The CC application supports the creation of geospa-
tial elements of interest by drawing them on a map.
These can be generic “POINT”, “LINE” or “POLY-
GON” shape types of elements. This allows display-
ing them on the map in client applications carried by
first responders in the field. For instance, the Inven-
tory creation functionality provided by the CC appli-
cation acts as an authoring tool that creates geospa-
tial entities that are then displayed within the asigned
emergency, and can be used by any other applica-
tion that uses the API, such as the augmented reality
3D Geospatial Data Management Architecture for Common Operational Picture Functionalities in Emergency Response
53
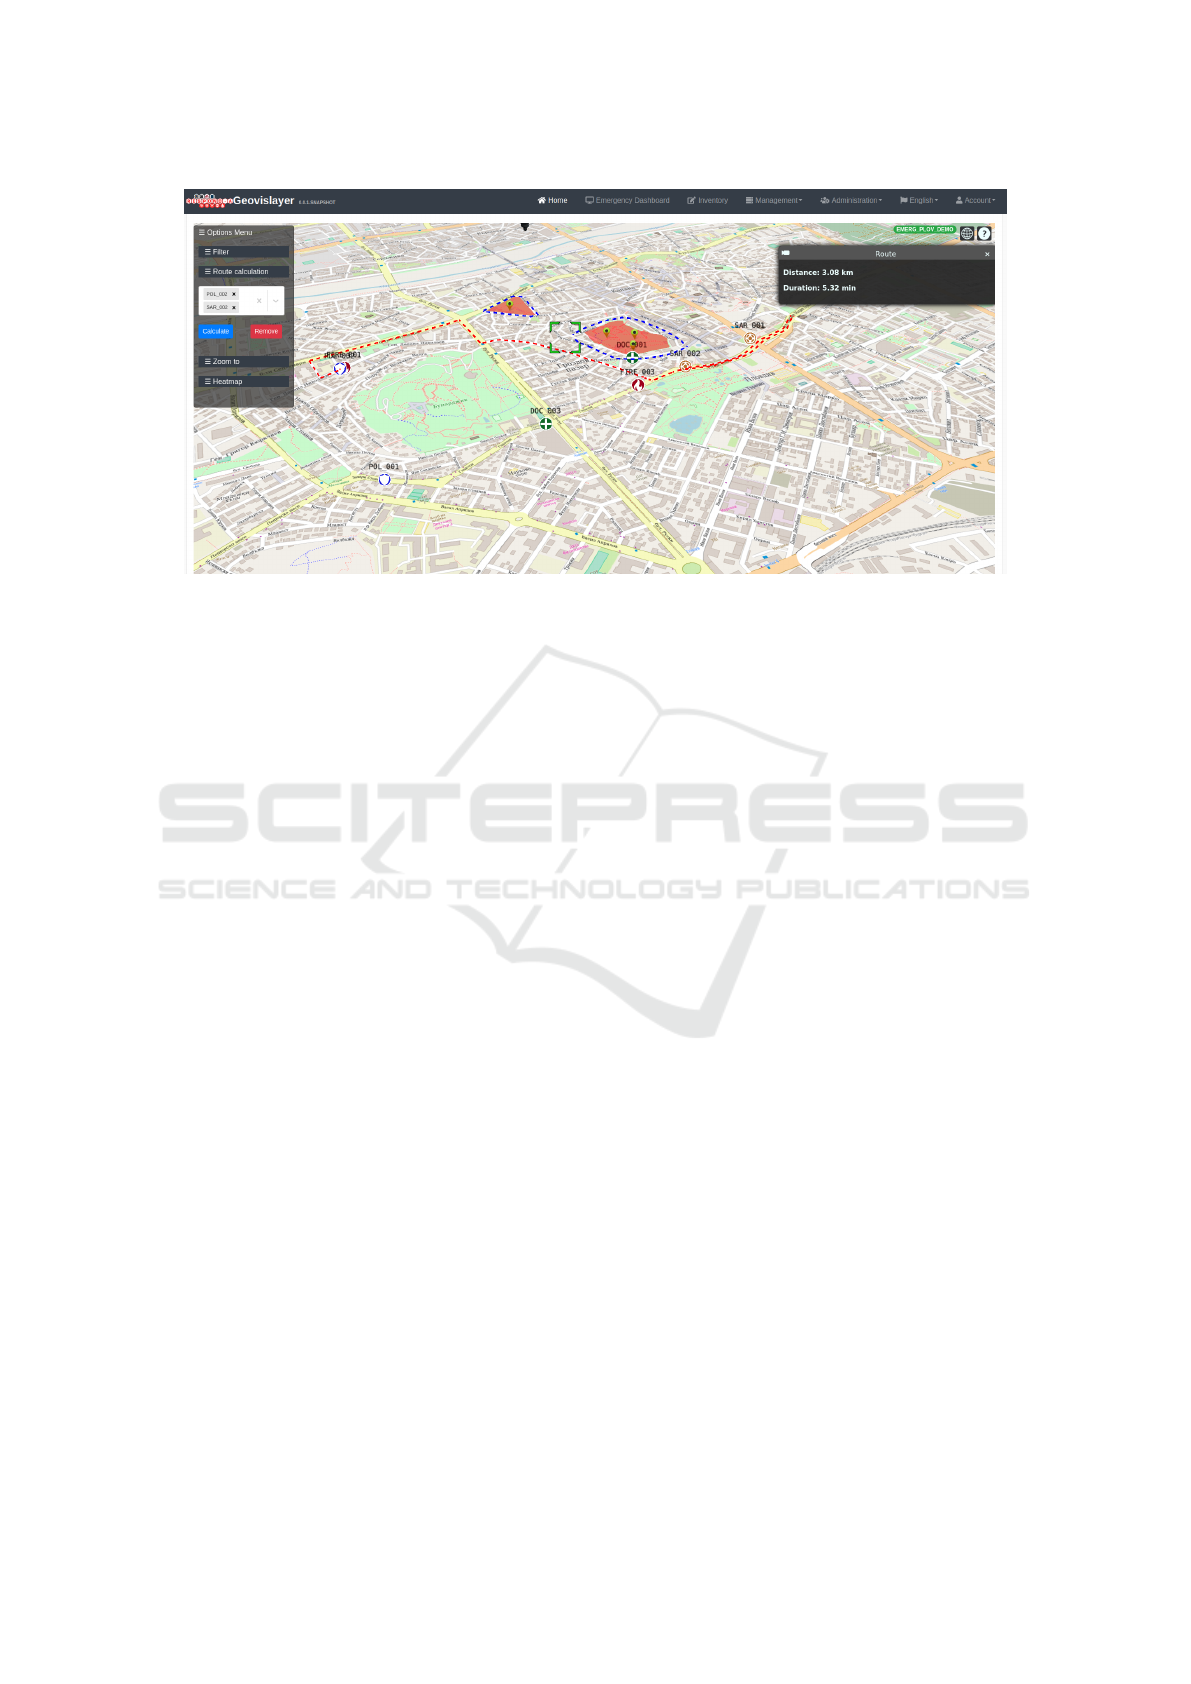
Figure 5: Visualisation of the route path with associated details (distance and duration).
smartphone and see-through glasses clients. In addi-
tion to the shape type, currently, the elements can be
categorised into Resources, Citizens in Risk, Danger
Area, Alerts or Mobile Command and Control Centre
location. The user is able to draw the element on the
map and it is then saved in the system with associated
details.
4.8 Real-Time Environmental and First
Responders Health Status Through
Sensor Data Visualisation
Via third party tools, the data collected by multiple
wearable sensors and centralised by the data logger
are shared through the middleware system. This in-
formation gives valuable insights of the situation of
the first responders’ safety, apart from the localiza-
tion data that has previously been addressed. In ad-
dition, it enables quickly alerting the commanders to
a potentially injured FR and it provides actionable in-
telligence without needing audio or visual communi-
cation between the FR and their commander.
4.9 Drone Flight Plan and Telemetry
Visualisation
Drones are another key part of emergency manage-
ment. They are very valuable resources that help op-
erations from an aerial perspective. Integrating their
information in Command and Control applications is
very useful. Via the middleware system, telemetry in-
formation of the drones are shared with the Command
and Control application in order to display their sta-
tus and position in real time. For instance, the CC
application is capable of displaying and updating the
position with a given refresh rate. The main purpose
of this functionality is not handling the flight mission,
which needs a very frequent and critical monitoring
to guarantee the safety of the UAV and the personnel
involved but following their approximate situation in
context with the rest of the elements and resources
being part of the emergency operation. In Fig. 6, the
position and details of a flying drone are represented
on the map. Since the CC application allows 3D vi-
sualization of the scene, apart from the 2D positions,
the elevation can be represented. Moreover, showing
or hiding the expected flight plan is enabled.
4.10 Alerts
The management of alerts is key to allow acting fast
and efficiently in decision-making. This is valid for
first responders in the Command and Control Cen-
tre and for the ones deployed in the field. Display-
ing alerts that require attention from a responsible
at the Command and Control Centre is an important
functionality. In general, alerts are expected to be
shared through the middleware system. In addition, a
specific component enables subscription to Common
Alerting Protocol servers provided by authorized en-
tities.
4.11 Post-Emergency Functionalities
The post-emergency management of the collected in-
formation helps to understand and evaluate the emer-
gency response, once finished. The following func-
tionalities are given:
• Statistics dashboards: Interactive charts and tables
GISTAM 2023 - 9th International Conference on Geographical Information Systems Theory, Applications and Management
54
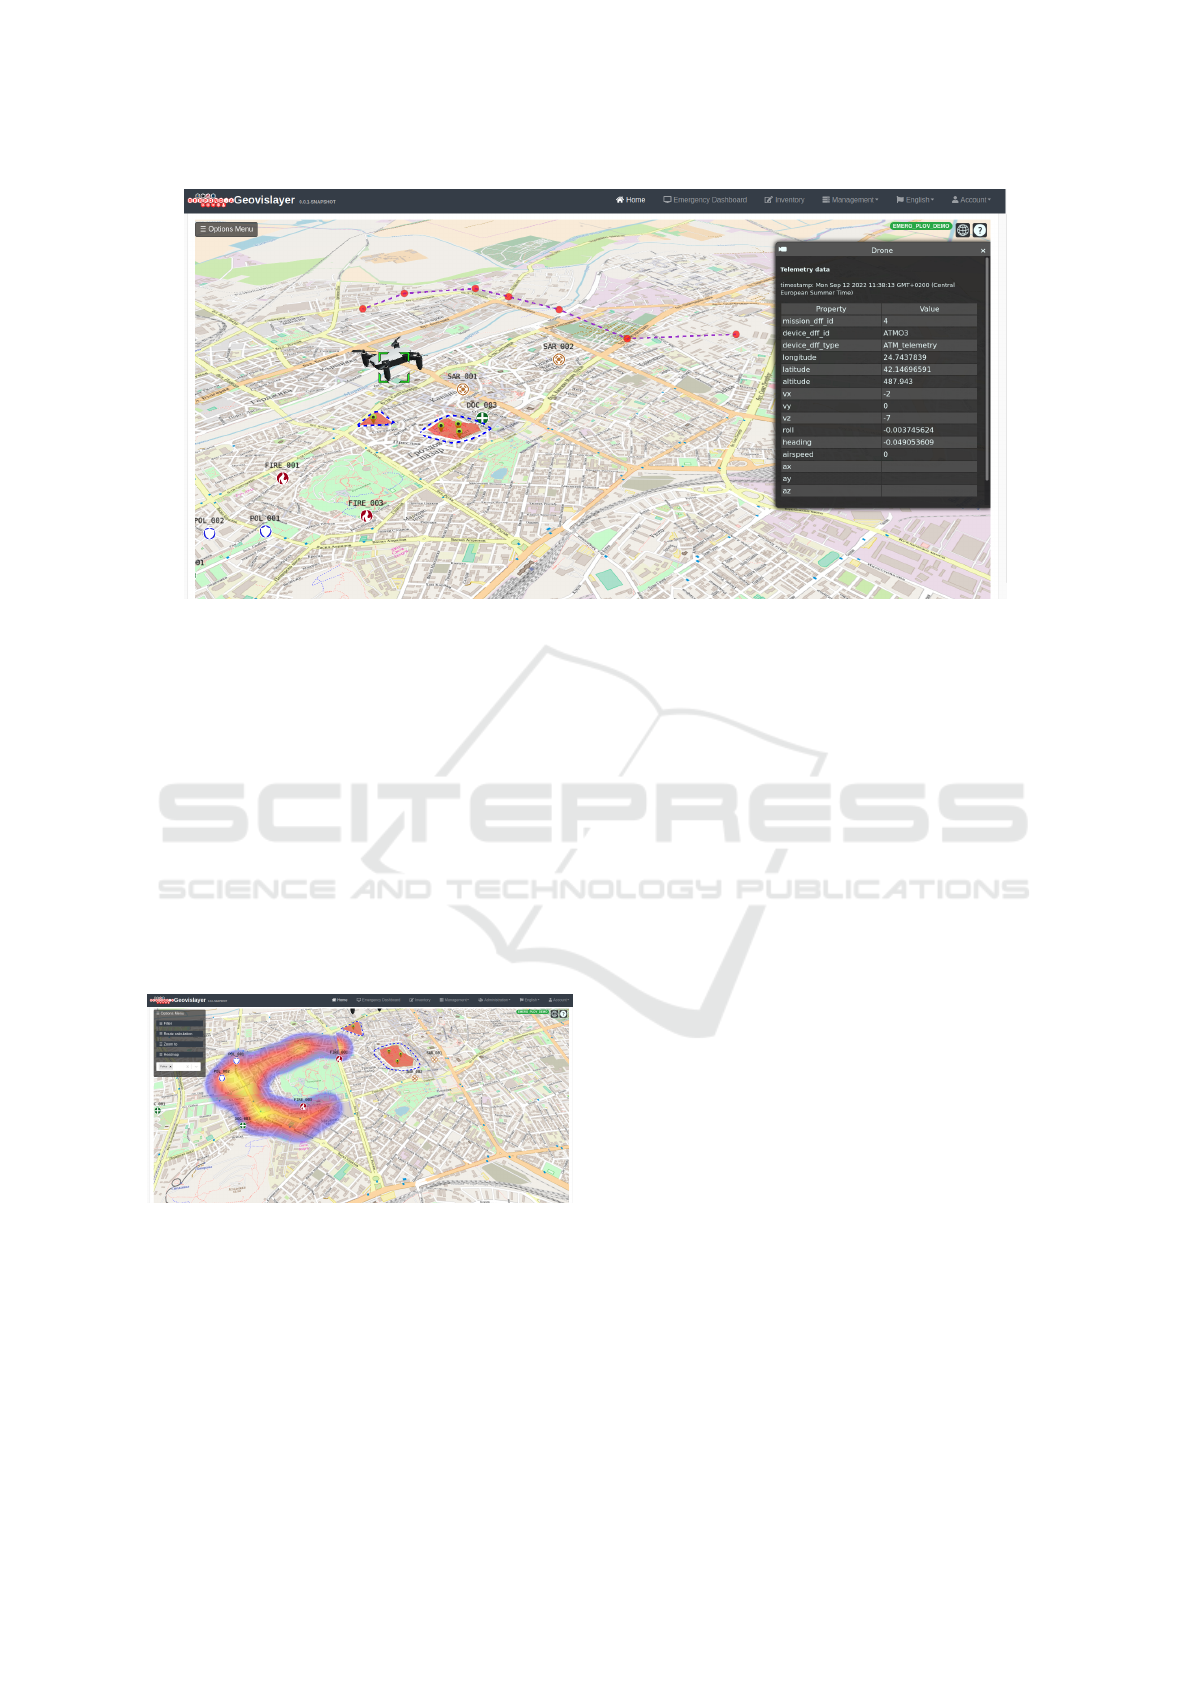
Figure 6: Flying drone details with activated visualisation of the flight plan.
about statistics of alarms, numbers of exchanged
messages, number of injured people treated.
• Reporting: Creation of summary reports about the
evolution of the emergency from the beginning to
the end.
• Geospatial statistics: This helps understanding the
movements of first responders in the field, extract-
ing quantitative data about areas visited, distances
they have traveled, time to reach some locations,
time they have spent in a dangerous zone, and
so on. Visual representations such as charts and
heatmaps are used (Fig. 7).
Figure 7: Heatmap with positions from a filtered first re-
sponder.
5 DESCRIPTION OF SPATIAL
DATA MANAGEMENT
MODULES
5.1 Web Interface Folder Structure and
Components
Folder structure of the project consist on several fold-
ers with functional components in them. Main folder
is “modules” folder. This is where most of the web
application functionalities reside. Inside this folder,
we have:
• “account” folder: Components for account man-
agement functionalities.
• “administration” folder: Components web admin-
istration functionalities.
• “login” folder: Components for login/logout
functionalities.
Most of the visual components of the web application
are in the following folders:
• “emergencies” folder: Component that show the
emergency dashboard.
• “inventory” folder: Components for creating new
shapes in the emergency.
• “map” folder: Components for the main 3D
geospatial visualization of an emergency.
5.2 Cesium as the Core GIS Component
The main web interface component is where the emer-
gency map and information are embedded in the web-
3D Geospatial Data Management Architecture for Common Operational Picture Functionalities in Emergency Response
55

site, using CesiumJS, an open source javascript li-
brary for creating 3D globes and maps.
When an emergency is selected in the emergency
dashboard, this component automatically loads.
Cesium’s WebMapServiceImageryProvider function
loads a base map for the world globe and a detailed
map of the emergency setting from Geoserver. In the
process of loading the component, there are several
API calls to retrieve emergency information. There
are three types of calls:
• API calls made only once, when the component
loads:
– /generalTypes/list: Returns a list of all types
(FR + shapes) in the emergency.
– /settings/getSettingById?settingId: Returns set-
ting basic information.
– /GeoJson/minimumBboxByEmergency? emer-
gencyId: Returns the minimum bounding rect-
angle of last positions of FRs and shapes of in-
terest.
• API calls made when the component loads and
also every time information is updated:
– /firstResponders/lastPosition?emergencyId:
Returns a list of FRs and its positions in the
emergency.
– /GeoJson/lastPositionByEmergency? emergen-
cyId: Returns a list of shapes of interest and its
positions in the emergency.
– /deviceInfo/getLastTelemetriesByEmergencyId?
emergencyId: Returns a list of drones and its
data in the emergency.
• API calls made when the operator selects a spe-
cific entity (first responder or drone):
– /deviceInfo/getLastDataEnvironmentById? re-
sponderId: Returns environment data provided
by the device the selected FR is wearing or car-
rying.
– /deviceInfo/getLastVitalSignsById?responderId:
Returns health data provided by the device the
selected FR is wearing.
– /deviceInfo/getMissionByDeviceId?deviceId:
Returns mission information of the selected
drone.
5.2.1 Initial Flight to the Emergency Location
When the main component has loaded and the initial
information has been retrieved from the API, the first
operation that is done is an initial camera flight to the
center of the bounding rectangle of the emergency.
For this operation, Cesium’s CameraFlyTo function
is used and the coordinates are obtained from /Geo-
Json/minimumBboxByEmergency?emergencyId API
call.
5.2.2 Information Visualization
The World globe, map layers and emergency enti-
ties are visualized using Cesium’s Viewer component.
Any Cesium function has to be inside this component.
Cesium has different kind of components for visual-
izing Entities. The ones used in this application are
the following:
• ModelGraphics: loads 3D models in glTF format
(drones, buildings, ...).
• PolylineGraphics: used for representing drone
flight plan, line shape of interest, and route infor-
mation.
• BillboardGraphics: loads an image representing
a first responder type or any other point as a shape
of interest.
• LabelGraphics: used for showing a first respon-
der’s code.
• PolygonGraphics: used for showing polygon
shape of interest.
• PointGraphics: used for representing drone’s mis-
sion waypoints.
5.2.3 3 D Terrain
With Cesium, apart from imagery layers, specific ter-
rain layer can be imported. In our case, we import 3D
terrain using CesiumTerrainProvider function.
• From a DEM (Digital Elevation Model), tiles
in quantized-mesh format are created with open
source project: cesium-terrain-builder-docker.
• The 3D terrain is hosted in an open source server:
cesium-terrain-server.
5.2.4 Heatmap
Using WebMapServiceImageryProvider too, a
heatmap layer of positions of first responders can
be represented. This layer is created in Geoserver
applying a transformation to a style.
5.2.5 User Interaction
User can move the view in any direction and can se-
lect any entity displayed in the viewer. When an entity
is selected, a description is shown with EntityDescrip-
tion component.
GISTAM 2023 - 9th International Conference on Geographical Information Systems Theory, Applications and Management
56
There is also a menu function called “Zoom to”
where user can redirect the camera to any first respon-
der or shape of interest in the emergency. Cesium’s
CameraFlyTo function is used, as for the initial cam-
era position.
There is an specific component for creation of
new shapes in the emergency. Cesium viewer’s 3D
globe is loaded, an the user can select what emer-
gency wants to work on. The user can manually draw
point, line or polygon shapes in any place of the map,
assign a category to the shape and save it. Cesium
has a ScreenSpaceEventHandler function for manag-
ing user clicks over the Cesium Viewer. Once the new
shapes are saved, they are included in the Emergency
Database and can be visualized using the CC applica-
tion or any other application that uses the API.
5.3 Geoserver Map Creation Process
The process for serving a map with Geoserver starts
obtaning an OpenStreetMap file of the wanted area.
This map has to be processed into a PostGIS database
with Imposm tool (https://imposm.org/). Applying a
specific mapping in Imposm, converts the map infor-
mation into several database tables. Then, Geoserver
allows to import these tables. Each one works as
a layer in Geoserver. For visualizing a layer like a
typical map, an specific style has to be applied to
each layer. For the creation of the whole map, we
are not using all the layers, just a custom selection
of them. The desired layers must be grouped into
a ”layer group”. The order in which the layers are
added when creating this group is important.
Once the map is created, it is served to the CC
application by WMS (Web Map Service) standard.
6 PERFORMANCE EVALUATION
The performance of the multiple tasks and function-
alities is affected by the database size. Therefore, re-
search to evaluate how this size would affect the in-
teraction of the user with the application is needed.
For instance, one of the features of the CC appli-
cation is the initial flight described in section 5.2.1.
To calculate the bounding rectangle of the last posi-
tions received of first responders in an emergency, the
/GeoJson/minimumBboxByEmergency?emergencyId
API call has been implemented using PostGIS.
Another way to calculate the bounding rectangle
is to make use of WPS functions implemented in
Geoserver. In order to know what is the more efficient
way to perform the calculation a time comparison has
been made.
The main factor for the time comparison is the
number of registers saved in the database, because of
this, different scenarios have been defined. In Table 1,
the first column specifies the frequency with which a
record is received, the second column defines the du-
ration in which the data is received and the third one,
the total number of records received for each FR in
that scenario. For example, the first row specifies that
1 record is received every 300 seconds during 3 hours.
Each scenario has been tested with a different number
of first responders (1, 5, 15 and 25).
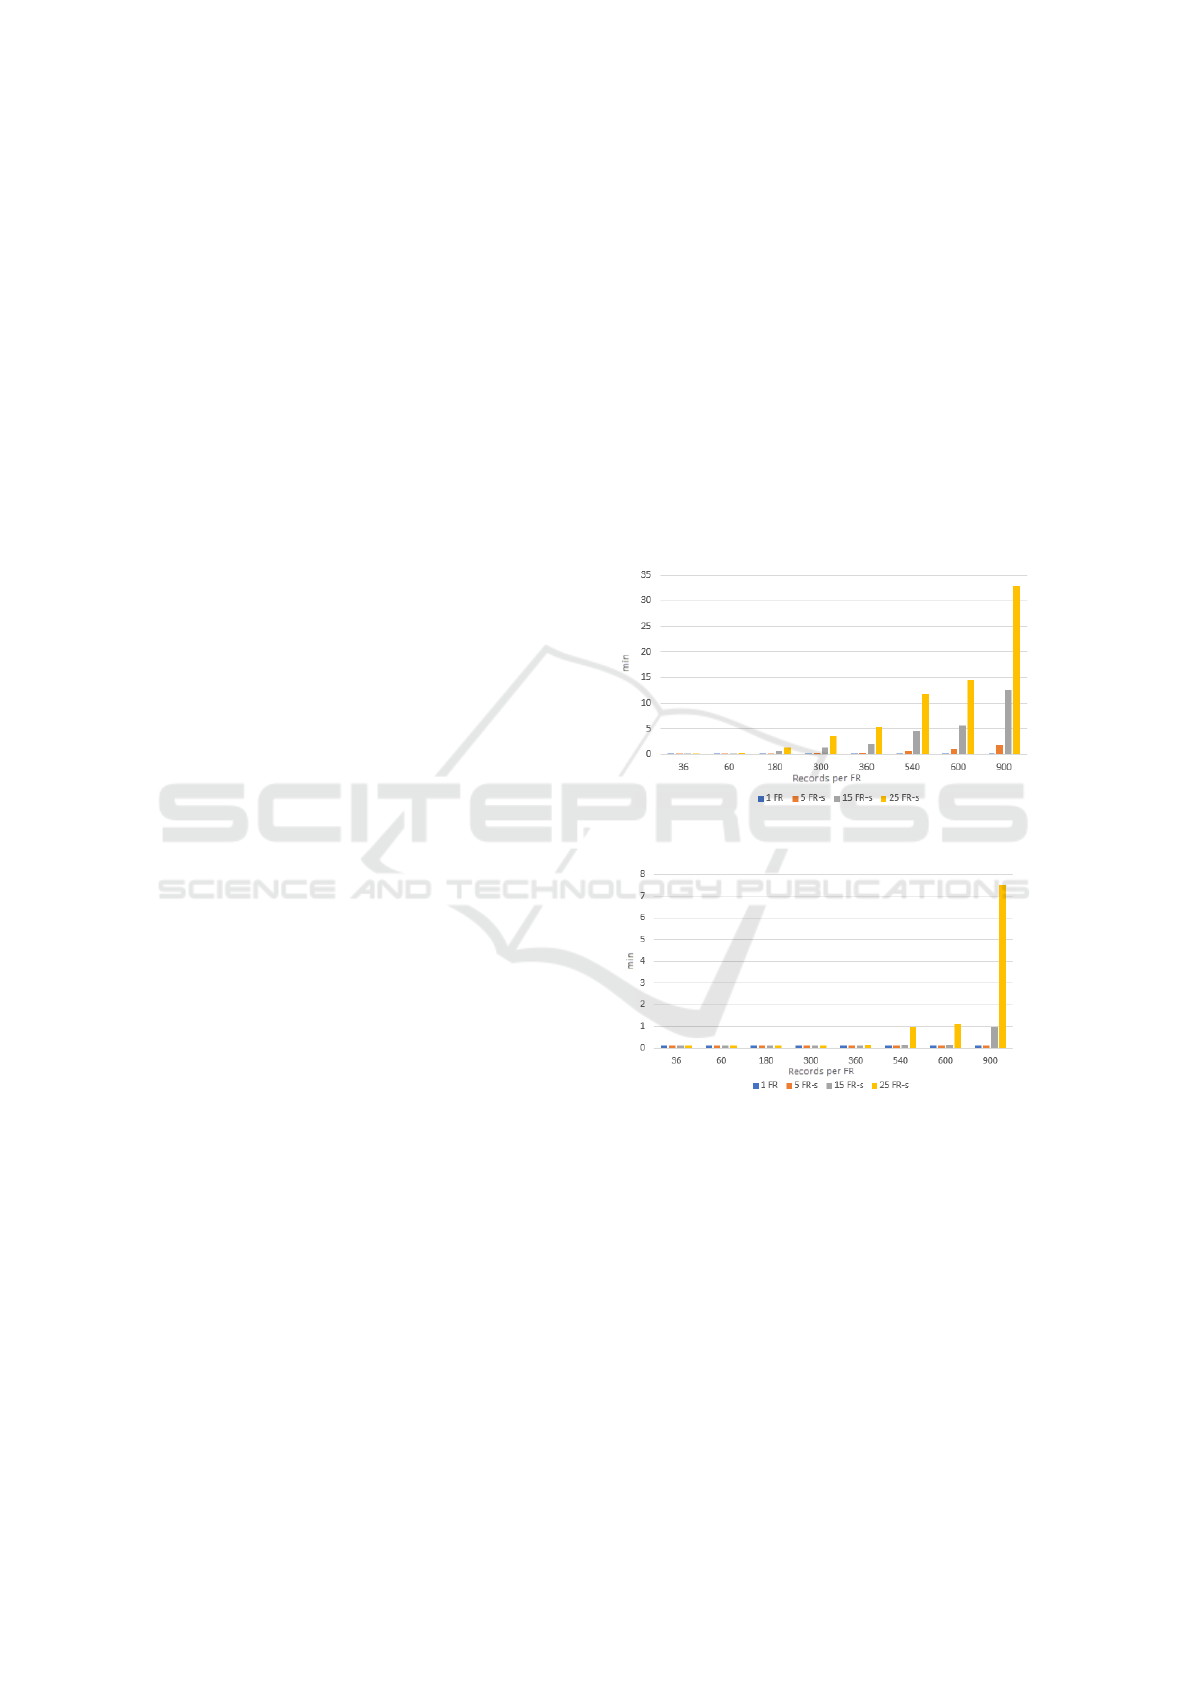
The data obtained (Table 2) show that the response
time increases exponentially from 300 records per FR
in the case of the api (Fig. 8) and from 540 records
per FR in the case of Geoserver (Fig. 9).
Figure 8: API response time comparison.
Figure 9: Geoserver response time comparison.
Focusing on scenarios with more records (Fig.
10), the response of the API, in the worst case, is
2746% slower than Geoserver’s (the case of 1 record
every minute during 5 hours with 25 first responders).
Therefore, as future work, it is necessary to improve
the implementation of the API to make it scalable.
3D Geospatial Data Management Architecture for Common Operational Picture Functionalities in Emergency Response
57
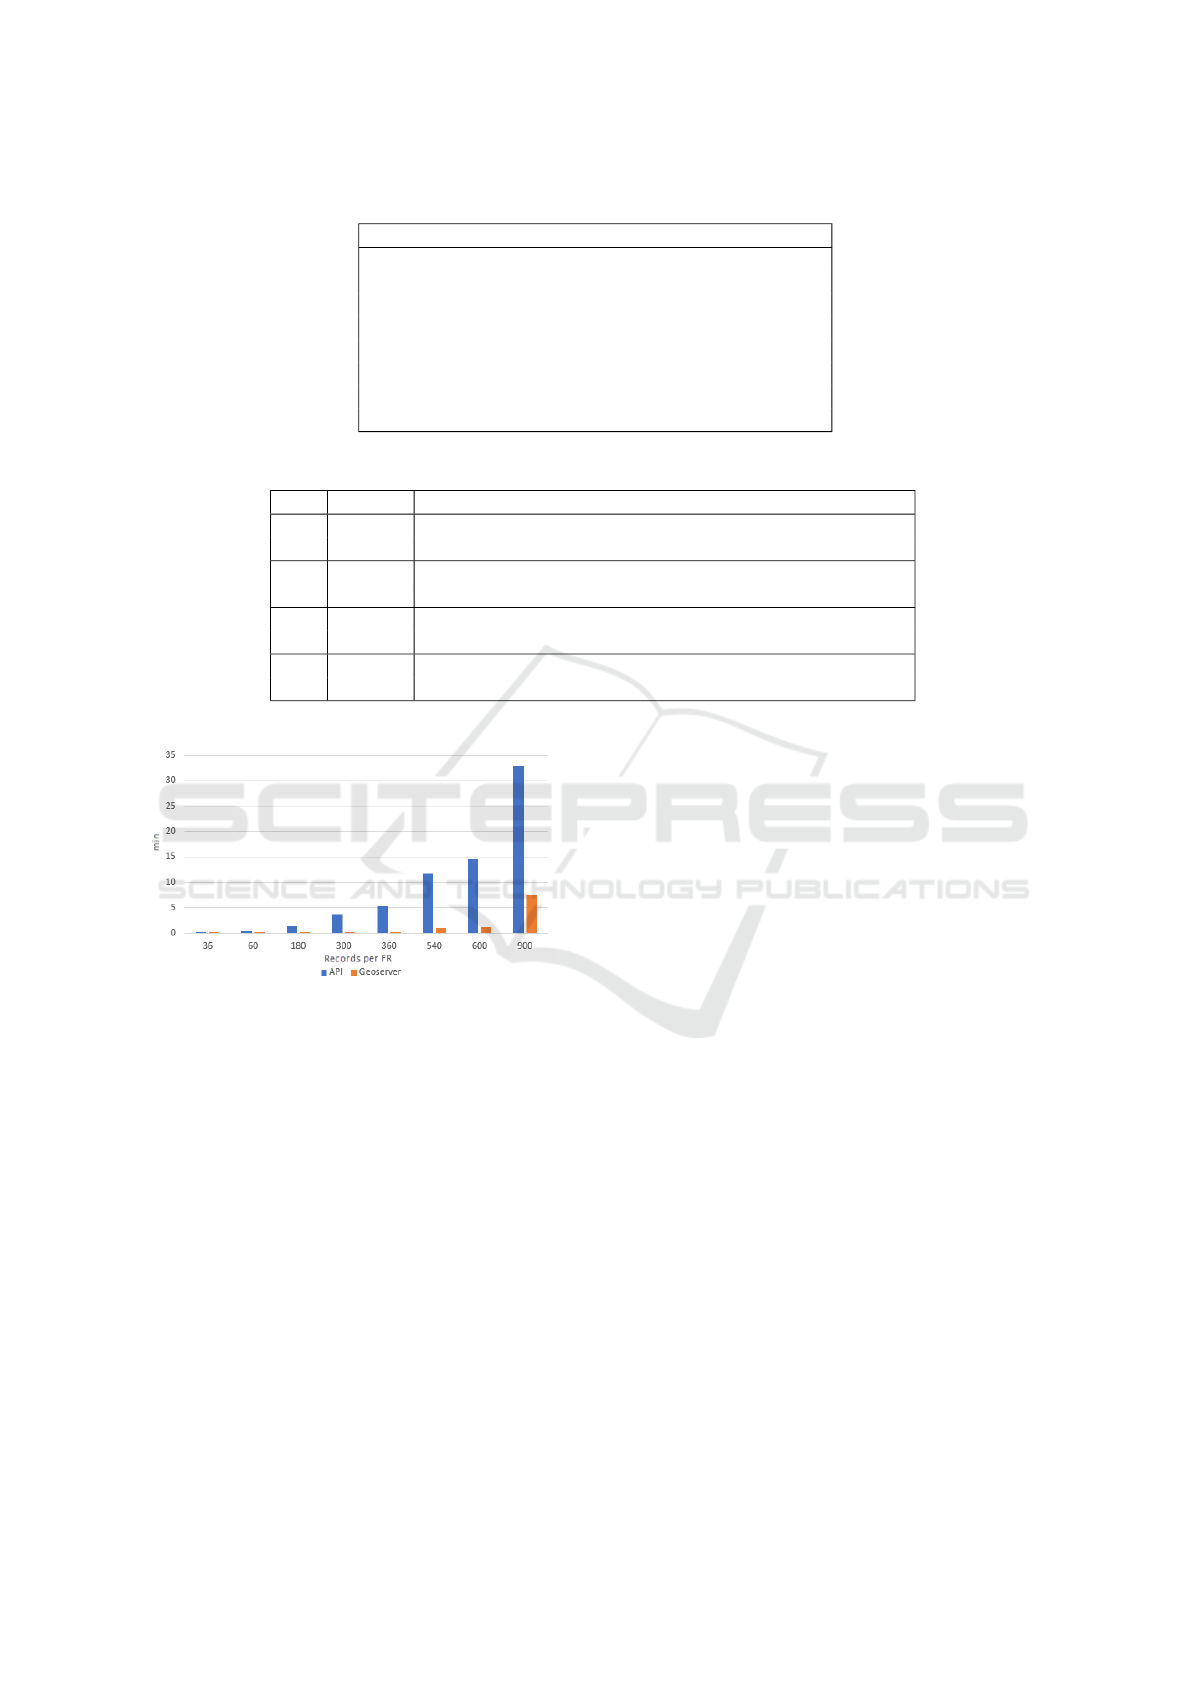
Table 1: Definition of number of records per FR.
Time Period (s) Duration (h) Total records (per FR)
300 3 36
300 5 60
60 3 180
60 5 300
30 3 360
30 5 600
20 3 540
20 5 900
Table 2: API and Geoserver (GEO) response times in seconds, according to records per FR.
FRs Method 36 60 180 300 360 540 600 900
1
API 0.08 0.10 0.10 0.12 0.12 0.13 0.15 0.25
GEO 0.10 0.10 0.10 0.10 0.10 0.11 0.11 0.11
5
API 0.10 0.12 0.20 0.30 0.39 0.70 0.92 1.90
GEO 0.10 0.10 0.11 0.11 0.10 0.12 0.12 0.13
15
API 0.13 0.15 0.60 1.40 2.00 4.60 5.70 12.60
GEO 0.11 0.11 0.12 0.13 0.10 0.14 0.15 1.00
25
API 0.18 0.28 1.40 3.70 5.30 11.80 14.60 32.80
GEO 0.11 0.12 0.12 0.13 0.20 1.00 1.10 7.50
Figure 10: Comparison between API and Geoserver times
for 25 first responders.
7 DISCUSSION AND FUTURE
WORK
Results show the quantitative impact of the amount
of records and the frequency of sensor data captured
when performing some geospatial tasks needed to op-
erate the web 3D GIS application, depending on the
method used. The differences show that working on
the scalability of the solution when developing cus-
tom functions is a must. To do so, the application
and evaluation of geospatial stream processing frame-
works is envisioned.
Moreover, expected future improvements will also
cover the update of the routing network, so that short-
est path algorithms are dynamically adapted to areas
that need to be avoided, and extending these algo-
rithms for evacuation means. In addition, an easier
creation and adaptation of the geographical regions
cartography in the application by means of semi-
automatic tools is planned.
8 CONCLUSIONS
This paper has described the architecture and a soft-
ware solution developed to support first responders,
with a special focus given to the technology stack
used for a 3D geospatial data management. The archi-
tecture is prepared to be able to interact with real-time
data coming from different heterogeneous sources
that support an emergency during its Response stage.
Evaluations have been carried out to understand the
impact that the number of first responders and the fre-
quency of the data received have in geospatial compu-
tational tasks such as the calculation of the bounding
box that contains all the spatial elements to be repre-
sented. An exponential increase of the response times
is shown, with the need to address scalability ap-
proaches through geospatial stream processing frame-
works. The solution has been designed to visualize
and manage emergencies, aimed to be used inside an
emergency command and control center. However,
the developed components and the global architecture
presented can be extended to be used in other dif-
ferent Command and Control (CC) applications be-
GISTAM 2023 - 9th International Conference on Geographical Information Systems Theory, Applications and Management
58

yond emergency management, where spatial capabil-
ities can be of special help, such as smart cities and
transportation and logistic sectors.
ACKNOWLEDGEMENTS
The research work presented in this article has been
sup- ported by the European Commission under the
Horizon 2020 Programme, through funding of the
RESPOND-A project (G.A. 883371).
REFERENCES
Abdalla, R. (2016). Evaluation of spatial analysis applica-
tion for urban emergency management. SpringerPlus,
5.
Arregui, H., Irigoyen, E., Cejudo, I., Simonsen, S., Ribar,
D., Kourtis, M., Spyridis, Y., Stathakarou, N., and
Batistatos, M. (2022). An augmented reality frame-
work for first responders: the respond-a project ap-
proach. pages 1–6.
Bandrova, T., Zlatanova, S., and Kone
ˇ
cn
´
y, M. (2012).
Three-dimensional maps for disaster management.
volume I-4.
Bennet, J. (2010). OpenStreetMap. Packt Publishing Ltd.
Dijkstra, E. W. (1959). A note on two problems in connex-
ion with graphs. Numerische mathematik, 1(1):269–
271.
Endsley, M. R. (2021). Situation awareness. Handbook of
human factors and ergonomics, pages 434–455.
Gao, X., Zhang, J., Zou, R., Li, J., and Cao, Z. (2022).
Multi-user collaborative virtual emergency drill sys-
tem for urban road emergencies. ISPRS Annals of the
Photogrammetry, Remote Sensing and Spatial Infor-
mation Sciences, X-3/W2-2022:9–15.
Hart, P., Nilsson, N., and Raphael, B. (1968). A formal
basis for the heuristic determination of minimum cost
paths. IEEE Transactions on Systems Science and Cy-
bernetics, 4(2):100–107.
Hong, J.-H., Lu, Y.-H., and Chen, C.-H. (2019). The use
of cctv in the emergency response: A 3d gis perspec-
tive. The International Archives of Photogramme-
try, Remote Sensing and Spatial Information Sciences,
42:19–25.
Iacovella, S. (2017). GeoServer Beginner’s Guide: Share
Geospatial Data Using Open Source Standards. Packt
Publishing Ltd.
Jagusiak, B. and Pokorski, G. (2022). Application of trans-
port security system symbology for emergency mass
notification systems. Transport Problems: an Inter-
national Scientific Journal, 17(3).
Kolawole, O. and Hunukumbure, M. (2022). A drone-based
3d localization solution for emergency services. In
ICC 2022-IEEE International Conference on Commu-
nications, pages 1–6. IEEE.
Li, B., Wu, J., Pan, M., and Huang, J. (2015). Application
of 3D WebGIS and real-time technique in earthquake
information publishing and visualization. Earthquake
Science, 28:223–231.
Momjian, B. (2001). PostgreSQL: Introduction and Con-
cepts. Addison-Wesley Longman Publishing Co., Inc.,
USA.
Mysiris, P., Doulamis, N., Doulamis, A., Sourlas, V., and
Amditis, A. (2018). Pervasive 3d reconstruction to
identify hidden 3d survival spaces for search and
rescue management. In 2018 IEEE 16th Intl Conf
on Dependable, Autonomic and Secure Comput-
ing, 16th Intl Conf on Pervasive Intelligence and
Computing, 4th Intl Conf on Big Data Intelligence
and Computing and Cyber Science and Technology
Congress(DASC/PiCom/DataCom/CyberSciTech),
pages 808–813.
Paraskeva, C. (2016). A Digital Elevation Model for Cyprus
based on the ALOS 2 W3D30 Digital Surface Model.
https://doi.org/10.6084/m9.figshare.3159991.v1.
Raible, M. (2016). The JHipster Mini-Book. Lulu.com.
Shah, S. A., Seker, D. Z., Hameed, S., and Draheim, D.
(2019). The rising role of big data analytics and IoT
in disaster management: Recent advances, taxonomy
and prospects. IEEE Access, 7:54595–54614.
Treurniet, W. and Wolbers, J. (2021). Codifying a crisis:
Progressing from information sharing to distributed
decision-making. Journal of Contingencies and Crisis
Management, 29(1):23–35.
Verykokou, S., Ioannidis, C., Athanasiou, G., Doulamis, N.,
and Amditis, A. (2018). 3d reconstruction of disaster
scenes for urban search and rescue. Multimedia Tools
and Applications, 77.
Walls, C. (2016). Spring Boot in Action. Manning Publica-
tions Co., USA, 1st edition.
Zlatanova, S. (2008). SII for emergency response: the 3D
challenges.
Zlatanova, S., Oosterom, P., and Verbree, E. (2004).
3D technology for improving disaster management:
GEO-DBMS and positioning. Proceedings of The
IEEE - PIEEE.
3D Geospatial Data Management Architecture for Common Operational Picture Functionalities in Emergency Response
59
