
Framework and Algorithms for Data Analytics, Semantic Querying and
Realistic Modelling of Traffic
Sagar Pathrudkar
1
, Guido Schroeer
2
, Vijaya Sarathi Indla
1
and Saikat Mukherjee
1
1
Siemens Technology, India
2
Siemens Mobility, Germany
Keywords:
Traffic Analytics, Semantic Data Models, Driving Behavior, Real2Sim, Simulation-Based Testing, State
Space Explosion.
Abstract:
Infrastructure elements would be crucial in enabling autonomous mobility at scale to provide centrally shared
insights and possibly planning and control. Infrastructure mounted multi-sensor perception systems observe
traffic and generate data in object list format which typically consists of timestamped vehicle trajectories and
metadata about the vehicles, ie, their type, dimensions, etc. Such data is huge in volume and its analysis
is difficult due to the spatiotemporal sequential nature of the data. In this work, we present framework and
algorithms to semantically model and analyze this data in the context of map geometry to gain statistics and
insights at an actionable level of abstraction. We start with algorithms to process common 2D-HDmap formats
to extract map features - roads, lanes, junctions, etc. We then present meaningful traffic KPIs and statistics
that describe traffic patterns. We finally describe methods to abstract the traffic patterns and driving behaviors
into parametrized functions for various applications.
1 INTRODUCTION
Infrastructure mounted multi-sensor based traffic per-
ception solutions observe traffic over long periods of
time and gather huge amounts of data. This data is
rich given its multi-sensor nature and can provide ex-
tremely valuable insights wrt traffic patterns, driving
behaviors and critical scenarios in the given map ge-
ometry. In this work we present framework and algo-
rithms to address following questions:
1. How to analyze this data to find insights about
traffic behavior in order to identify scenarios of
interest for a junction?
2. How to represent this data in a semantic fashion
and calculate traffic KPIs and statistics to index
this data so that we can partition it based on a con-
dition of interest?
3. How to draw insights wrt microscopic KPIs which
describe the driving behavior of vehicles and
macroscopic KPIs which describe the statistical
simulation of traffic?
4. How to semantically analyze this data so as to
gain insights at an actionable level of abstraction?
1.1 The Problem
The road-traffic ecosystem is a complex system char-
acterized by high-dimensionality, nonlinearity, non-
stationarity and stochasticity. To develop miscella-
neous solutions that would work in open-loop/ closed-
loop, analysis and modelling of such a complex sys-
tem is a challenge. Any first principles based analy-
sis/ modelling would essentially be only an approxi-
mation of such a complex system. Due to the high-
dimensionality (high number of influencing variables
involved), first-principle based approaches are prone
to under-modelling. Due to the high nonlineari-
ties, it would be subject to simplification and conse-
quently bias. Due to the stochasticities, model based
approaches would involve simplifying assumptions
about additive/multiplicative nature of the stochastic
component and may not estimate the random compo-
nent of the system as well as the deterministic com-
ponent. And due to the nonstationary nature, it may
not account for the evolving behavior of the system
over time, ie, the model’s parameters would need to
be updated dynamically adapting to the changes in the
subtle characteristics of the complex system.
Real world data captures all these complexities. If
there is nonlinearity, it is reflected in real world data.
240
Pathrudkar, S., Schroeer, G., Indla, V. and Mukherjee, S.
Framework and Algorithms for Data Analytics, Semantic Querying and Realistic Modelling of Traffic.
DOI: 10.5220/0011838900003479
In Proceedings of the 9th International Conference on Vehicle Technology and Intelligent Transport Systems (VEHITS 2023), pages 240-247
ISBN: 978-989-758-652-1; ISSN: 2184-495X
Copyright
c
2023 by SCITEPRESS – Science and Technology Publications, Lda. Under CC license (CC BY-NC-ND 4.0)

Any randomness is also captured by real world data.
When the system properties change or evolve over
time, it is also reflected by real world data. So it be-
comes necessary to use real world data to understand
and model the road-traffic system.
1.2 Main Contributions
Given the absolutely huge volume and variety of traf-
fic data that is observed, it becomes crucial to de-
velop efficient and scalable algorithms to process,
condense, analyze and abstract this data. Multi-sensor
traffic data that is observed typically consists of the
trajectories followed by different vehicles, ie, the
timestamped GPS coordinates, velocities of the vehi-
cles, their bounding boxes and orientations (heading/
yaw angles) at each timestamp, metadata such as the
vehicle type (car, bus, motorcycle, etc). This effec-
tively describes what kind of vehicle showcased what
sort of driving pattern/ maneuvers in that geolocation.
The conditioning on geolocation implies that another
feature of the traffic data or another variable required
for complete description or representation of traffic
data is the map geometry in which the driving or traf-
fic maneuvers occurred. So vehicle trajectories data
make sense only when put in the context of map ge-
ometry - junctions, roads, lanes, etc - their locations
and boundaries.
The two major ways of describing the maps - Open-
Drive standards and Lanelet2 maps - encode the in-
formation regarding the map elements such as road
geometries, lane widths/lengths, junctions, elevation
profiles, etc. So the first step to analyzing traffic
data in the context of a map geometry is naturally
the extraction of this feature-level (roads, lanes, junc-
tions) information from the OpenDrive and/or Lanelet
maps.
Also to gain meaningful insights from such huge data,
it is important to condense data into meaningful or se-
mantic representation. Such semantic representation
should abstract all the discrete and independent enti-
ties in the real world road-traffic ecosystem and model
their relationships and interactions accordingly. This
would enable description of traffic patterns and driv-
ing behavior in a semantic fashion that allows in-
sights at actionable level of abstraction. We design
the schema of the semantic traffic database to repre-
sent static entities of the map, ie, roads, lanes, junc-
tions and the dynamic entities of the map, ie, vehicles,
etc and their relationships. The resulting graph when
traversed for a vehicle essentially describes its entire
journey in the map or road network.
1.3 Related Work
Semantic traffic models have been constructed us-
ing semantic and geographic information of trajec-
tory data happens along network infrastructure si-
multaneously (Haubrich et al., 2014). In (Mirboland
and Smarsly, 2018), a generative model of 3D ur-
ban scenes is proposed which is able to reason not
only about the geometry and objects present in the
scene, but also about the high-level semantics in the
form of traffic patterns. An extendable model rep-
resenting road network logics (RNL) which allows
the integration of traffic semantic information is pro-
posed in (L
´
ecu
´
e et al., 2012) for navigation and de-
cision making. Entity-entity and entity-environment
interactions with simple, feed-forward computations
in each timestep within an overall temporal model
of an agent’s behavior are demonstrated in (Buechel
et al., 2017). One of the key elements in the ADAS
system is to develop an algorithm to understand the
driver behaviors which can detect and analyze com-
mon driving maneuvers, such as making turns, on
an individual-by-individual basis – in (Bachmann,
2011), a position-based turn detection algorithm for
detecting turns from vehicle data and GPS coordi-
nates. A novel method of trajectory description is pro-
posed to establish the semantic model for automatic
traffic violation events detection in (Wei et al., 2014).
In our previous work (Pathrudkar, 2021) we briefly
described the semantic graph database for modelling
vehicle driving patterns in the context of road geom-
etry and motivate the problem of generating realistic
driving behavior for AV testing in simulation.
Section 2 describes the broad system overview
through the steps involved, database design, deter-
ministic and data-driven algorithms involved in devel-
oping the system. Section 3 describes the map pro-
cessing algorithms to extract the map features such
as road, lanes and junctions. Section 4 describes the
semantic graph database of traffic and how it can be
used to describe the driving behavior of vehicles at
a semantic level along with a few graph data science
applications to draw insights from the database. Sec-
tion 5 describes how the data can statistically be used
to abstract the driving behavior of vehicles. Finally,
Section 6 provides concluding remarks and discusses
the next steps in this stream of work.
2 SYSTEM OVERVIEW
The Traffic Analytics system (Figure 1) has two main
pillars. The first being the high level framework to
process data from its object list stage into various lev-
Framework and Algorithms for Data Analytics, Semantic Querying and Realistic Modelling of Traffic
241

els of analytics insights. And second being the al-
gorithms used to compute traffic KPIs, perform se-
mantic analysis and also process the maps to contex-
tualize the traffic data. The framework processes the
traffic data in stages - first it takes the object list data
from multi-sensor perception systems along with the
map geometry for that data either in OpenDrive or
Lanelet map format. It then extracts the map features
such as the boundaries of various roads and/or lanes
along with the geometries of various junctions - ap-
proach angles, junction radii, etc. It then describes
the semantic journey of the vehicle trajectory through
the network - at what time the vehicle was travelling
through which lane, at what time it crossed which
junction, taking what kind of turn (straight, left, right
or u-turn), what was the turning speed and the turn-
ing angle. This information is then represented in a
semantic graph database. Many traffic KPIs that de-
scribe the traffic behavior are also computed to de-
scribe the traffic patterns and driving behaviors - time
headways, distance headways, accelerations, jerks,
throughput at a junction, network speed, density, flow
rate from various entry nodes, etc.
We also process the semantic traffic database using
multiple graph data science algorithms generating ad-
ditional insights. We use centrality algorithms to gen-
erate ranking insights such as which junctions are
more important wrt specific traffic maneuvers for ex-
amples sharp higher speed turns making the junction
more dangerous than others. We use community al-
gorithms to generate clustering and grouping insights
such as which specific junctions and vehicles can be
sliced into sub-databases without losing much infor-
mation allowing additional insights such as particu-
lar types of vehicles travel through particular kinds of
junctions at particular times along with more efficient
processing. We use similarity algorithms to generate
insights such as which types of vehicles exhibit simi-
lar behavior or which kinds of junctions create similar
kind of traffic, etc. We finally use link prediction al-
gorithms to identify which vehicles and junctions are
likely to form a link, ie, which kind of vehicles are
likely to generate what kind of driving maneuver at
what kind of junction with what probability.
The traffic analytics framework finally abstracts
the traffic statistics and semantics into parameterized
functions or probability distributions. Such functions
realistically model the traffic and driving behaviors
and can be used to represent these complex system
while developing and testing any products and solu-
tions that operate with real world traffic.
3 ALGORITHMS TO EXTRACT
MAP FEATURES
Figure 2 demonstrates the vehicle trajectories from
an area shown in Figure 3. The trajectories make
sense only when put in the context of a map geom-
etry. Hence it is crucial to capture the various map
features such as junctions, roads, lanes and their con-
figurations and geometries.
3.1 OpenDrive Map Format
The geometry of the roads in OpenDrive (ASA, 2020)
is characterized by a central reference line. 3 differ-
ent coordinate systems used Figure 4. The s-t coordi-
nate system traverses the length and orientation of the
road curve, the u-v system indicates the starting ori-
entation of a road curve, and the inertial x-y system
that provides as a global reference for junctions and
road starting positions. The lane width is described
using the s-t system, while the shape of the reference
line is described in the u-v system. The shape can be
described in different ways such as linear, parameter-
ized cubic polynomial, arcs, spirals, etc Figure 6.
3.2 Road and Lane Boundaries
Extraction from OpenDrive Map
Format
To analyze the trajectories data in conjunction with
maps data, we need to convert the vehicle coordinate
to the s-t system. There is no direct way to do this,
so we first convert it into the u-v system. The road
geometry is taken as mentioned in the curve type (pa-
rameterized cubic polynomial, linear, arc, spiral, etc)
. The road is a parametric (wrt parameter p) curve
(Figure 6) in the u-v system. From the transformed
vehicle u-v coordinates we find the length of the nor-
mal to this curve and the point of intersection of this
curve. The length of the normal gives the t coordinate.
The length of the curve from starting point to point of
intersection gives the s coordinate. We find the value
of the s coordinate by measuring the distance travelled
over its centerline from the starting point. We do this
by calcuating path integral over the centerline. We get
the value for the t coordinate using the perpendicular
distance to the curve from the point of interest. We
use this (s,t) coordinate to describe the (x,y) coordi-
nate’s road section and lane.
VEHITS 2023 - 9th International Conference on Vehicle Technology and Intelligent Transport Systems
242
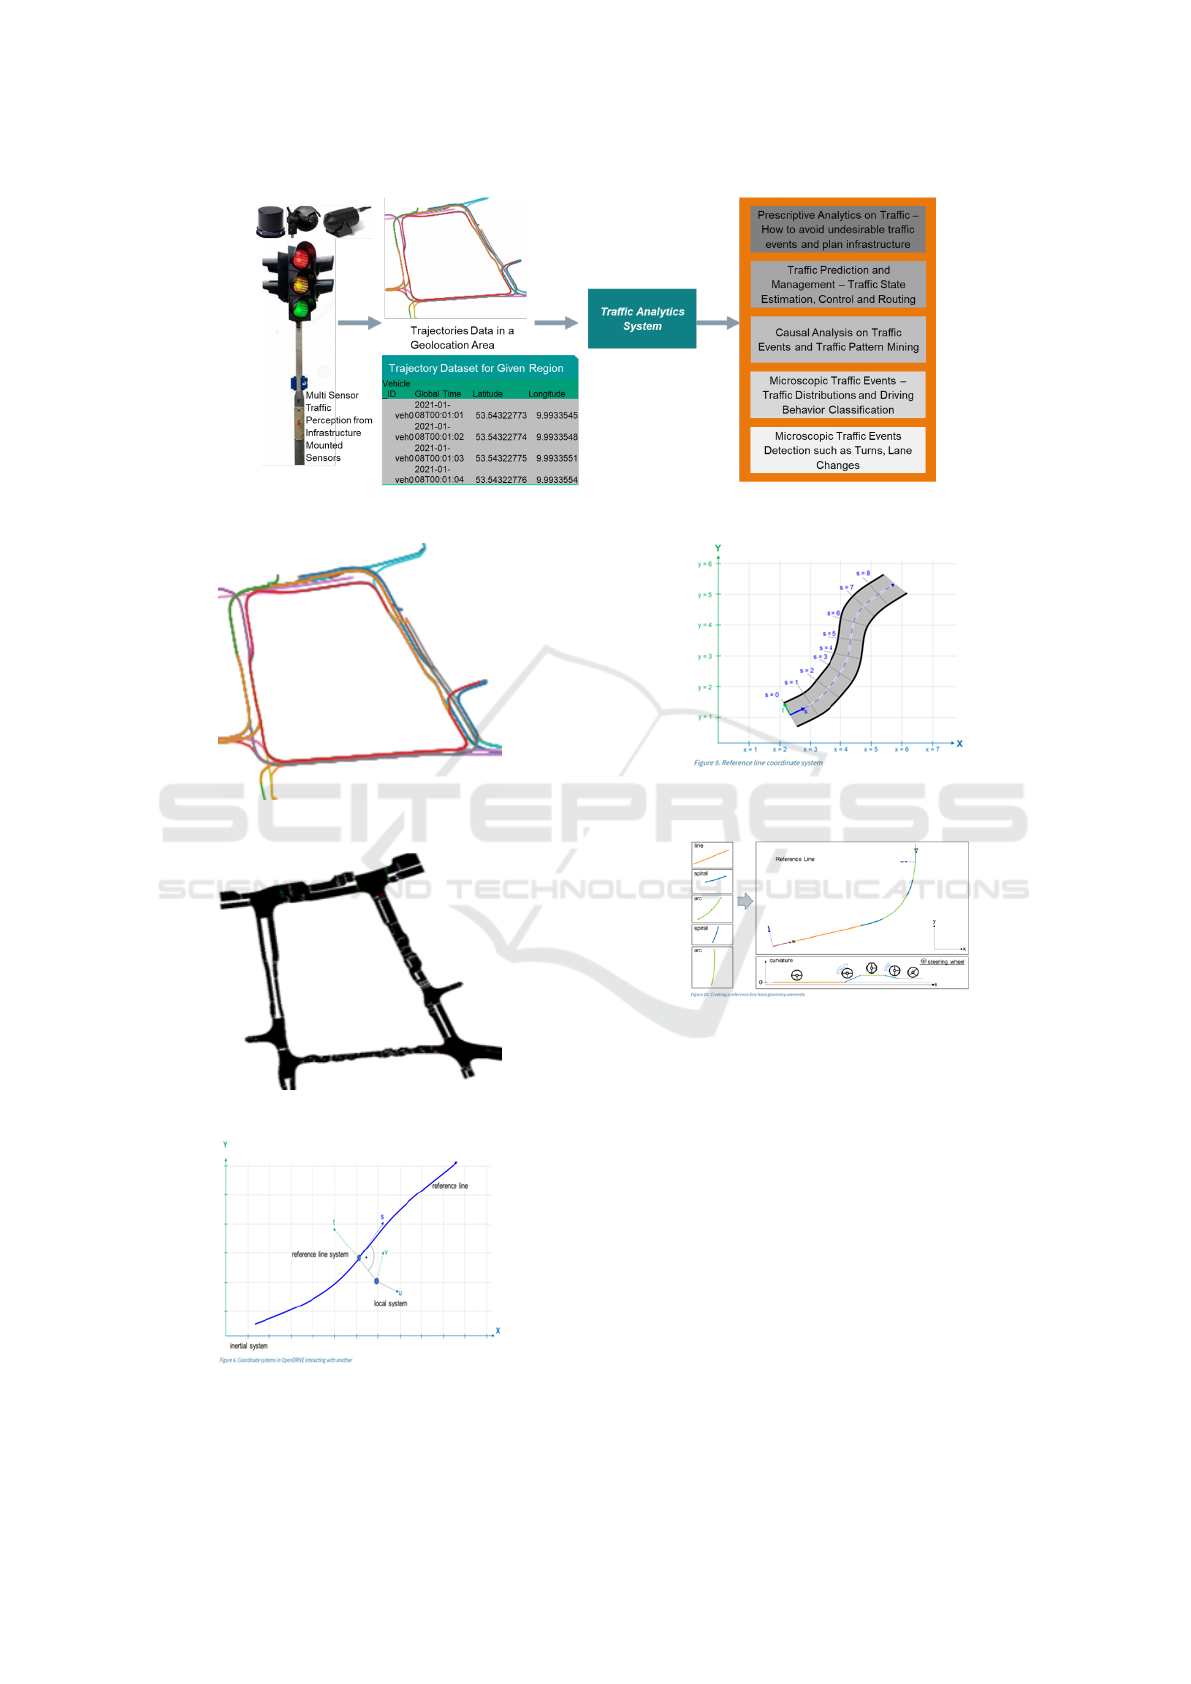
Figure 1: System for Traffic Statistics and Semantic Analytics.
Figure 2: Vehicle trajectories in a geographical area.
Figure 3: Map of the geographical area.
Figure 4: Coordinate systems in OpenDrive map format
(ASA, 2020).
Figure 5: Example of roads, lanes and sections in XODR
(ASA, 2020).
Figure 6: Parameterized descriptions of road format (ASA,
2020).
3.3 Junction Location and
Configuration Identification
A junction in OpenDRIVE (ASA, 2020) format is de-
fined by the list of incoming and connecting roads.
Connecting roads are what form the junction neces-
sarily while the incoming roads are those that enter
and exit the junction at various directions. A refer-
ence line is provided for each of these roads in terms
of different geometries as mentioned in the previous
sections. A transformation is required between the in-
ertial x-y system and the coordinates of the local u-v
system that is headed along the direction of beginning
of the road geometry to retrieve the junction coordi-
nates in the x-y system. The steps of extraction are as
follows: 1. For each of the junction nodes, connect-
Framework and Algorithms for Data Analytics, Semantic Querying and Realistic Modelling of Traffic
243
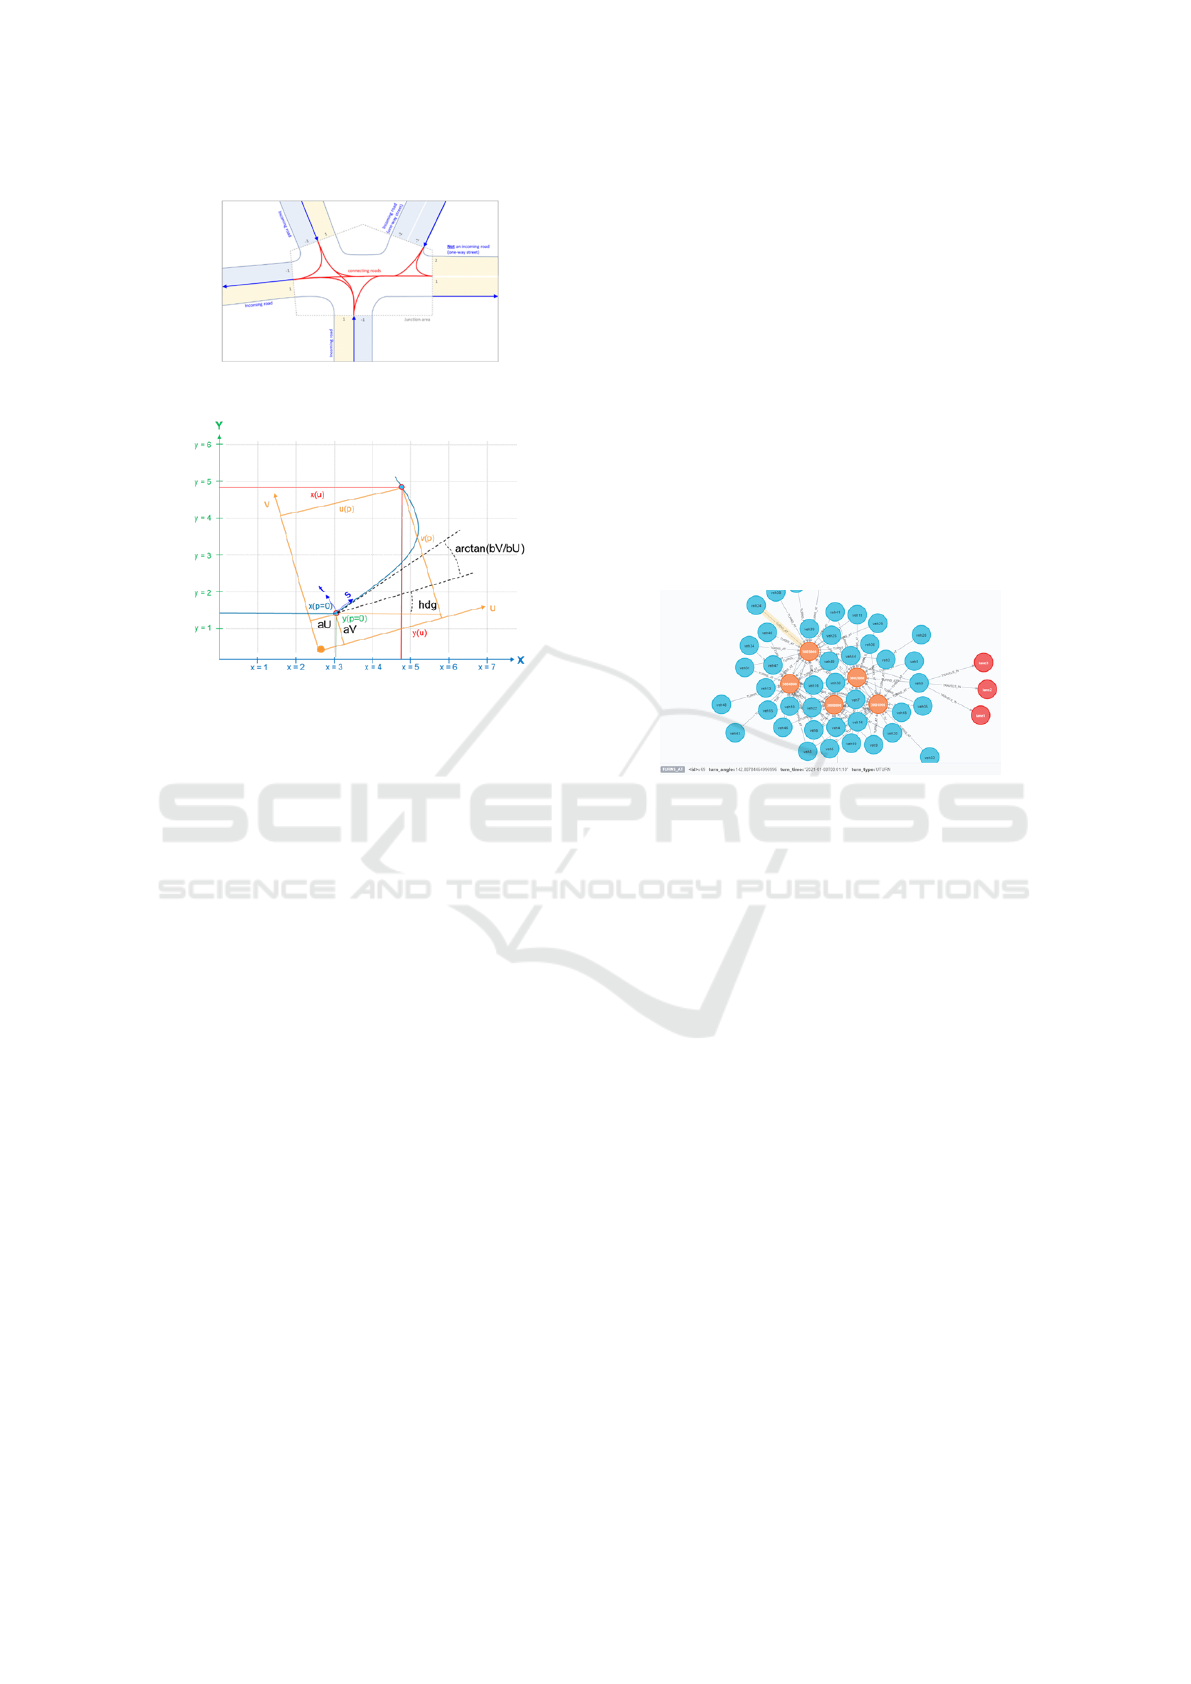
Figure 7: Junction as defined the OpenDrive map format.
Figure 8: x-Y to u-v coordinate conversion in OpenDrive
HDmap format.
ing roads are identified. 2. The end geometries of the
connecting roads are chosen to be transformed. 3. For
each of the geometry, the u-v endpoint is transformed
to x-y frame as follows 1. A translation by (aU, aV)
2. A rotation by angle ‘hdg’ (The heading angle pro-
vided for a given u-v frame) 3. A translation by (x0,
y0) where (x0, y0) represents the start point of the ge-
ometry in the inertial x-y frame. 4. Once the critical
points are identified in the x-y plane, the centroid of
the convex hull of the points is used as a definition
of junction position (mean of the coordinates) and the
standard deviation is used as a measure of the radius
of the junction. (A scale factor of 1.5 is introduced to
allow for robustness)
4 SEMANTIC ANALYSIS OF
TRAFFIC DATA
In this section we present the semantic database de-
sign and algorithms to generate meaningful insights
and statistics from traffic data.
4.1 Semantic Database of Traffic
To analyze the road-traffic ecosystem at a location
from the real-world data, all the entities which are
static such as junctions, roads and lanes and ones that
are dynamic such as vehicles need to be represented
at a common level of abstraction along with the kind
of interaction that happen between these entities. Se-
mantic data models are an excellent choice as they can
store the traffic data in a way that captures the rela-
tionships or events and parameterizes an AV test sce-
nario in an intuitive, expandable and easily analyzable
manner. We define the schema for the database such
that the junctions, lanes and vehicles are represented
as nodes. The lane and junctions have attributes cor-
responding to their positions and boundaries. The
vehicles have attributes corresponding to their trajec-
tories which are timestamped paths followed by the
vehicles. The relationships between the vehicle and
junction are characterized by turn type, turning speed,
turning angle and turning time. The relationships be-
tween the lanes and vehicles are characterized by en-
try times and exit times of the vehicles into and out of
lanes.
Figure 9: Graphical visualization of a semantic traffic
database of a five-junction area.
4.2 Example Traffic Statistics and
Insights from the Semantic
Database
The traffic database can then be statistically analyzed
to gain interesting insights such as below. The idea
is to use these insights to smartly design the exper-
imental scenarios of simulation-based testing of au-
tonomous vehicles. For example, in Figure 11, a scat-
ter plot shows the distribution of turning speed and
turning angle pairs. Such analysis can be used to
determine the more likely combinations or combina-
torial ranges of turning speed – turning angle pairs
as well as the anomalies and edge or corner cases.
In the below plot it can be seen that the turn angle-
speed pairs are mainly clustered in two areas which
cover only about half of the combinatorial state space.
Speed variability at an intersection can also be de-
scribed.
4.3 Graph Data Science Applications on
Traffic Database
The semantic database of traffic further opens up a
multitude of use cases in the form of graph algorithms
VEHITS 2023 - 9th International Conference on Vehicle Technology and Intelligent Transport Systems
244
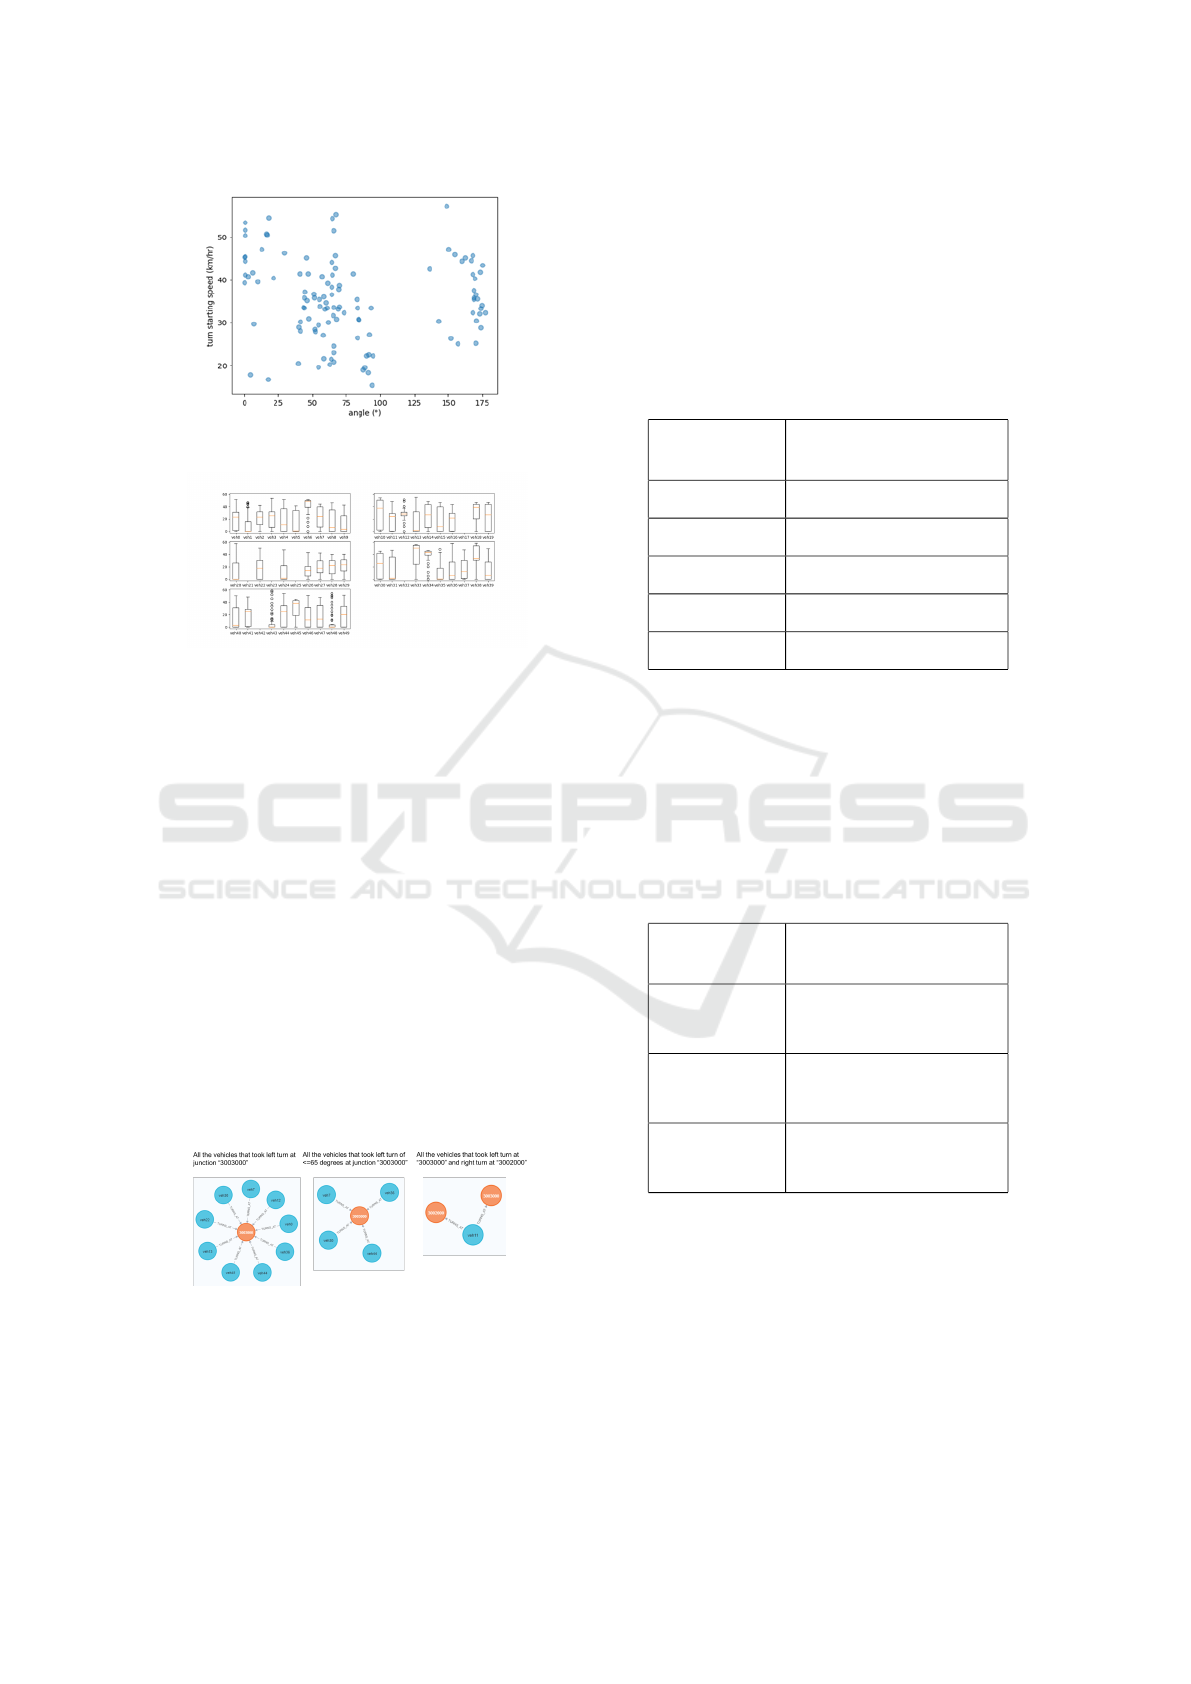
Figure 10: Scatter plot showing the distribution of turning
speeds and turn angles.
Figure 11: Box plots of vehicle speed distributions in the
traffic network.
and graph data science algorithms. The main themes
are community detection (group clustering or parti-
tions options), importance assignment or centrality
(creating hierarchy of the nodes in terms of a prede-
fined parameter), similarity detection (evaluation of
likeliness of different nodes) and heuristic link pre-
diction (estimating the chance of two nodes forming
a link), etc.
4.3.1 Basic Statistics and Insights from
Semantic Traffic Database
Through our framework, semantic queries can be used
for interesting insights on traffic patterns. For exam-
ple as shown in Figure 12, we can query information
such as all the left turn events that happened at a par-
ticular junction, that were of a particular angle and
involved vehicles which also took a right turn at an-
other junction.
Figure 12: Basic Queries and corresponding Results from
Semantic traffic database.
4.3.2 Centrality Algorithms - Node Importance
Through centrality algorithms, we can identify which
junctions or vehicles saw more activity as weighted
by composite properties that are for example, directly
proportional to turning speed and inversely propor-
tional to turning radius.
Table 1: Centrality – Ranking the junctions based on the
traffic busy-ness.
name of junc-
tion
score
”3003000”
1.73347910
”3004000”
1.39484522
”3002000”
1.22697023
”3000000”
0.94313098
”3001000”
0.93407434
4.3.3 Community Algorithms - Slice Database
We can use the community set of algorithms from
graph data science to partition our database into
smaller chunks for more efficient analysis. This can
also be used to cluster a group of junctions and vehi-
cles that have common interactions from other set(s).
Table 2: Community – Cluster the database of full map and
all vehicles into sub-map and subset of vehicles.
commmunity
id
names of nodes
”0”
[”3003000”, ”veh5”,
”veh6”, ”veh8”, ”veh9”,
”veh13”]
”1”
[”3004000”, ”veh10”,
”veh12”, ”veh15”,
”veh24”, ”veh31”]
”2”
[”3000000”, ”veh0”,
”veh3”, ”veh3”,
”veh11”, ”veh26”]
4.3.4 Similarity Algorithms - Node Similarity
Similarity algorithms can be used to identify which
pairs of vehicles and junctions exhibit similar behav-
ior to one another.
Framework and Algorithms for Data Analytics, Semantic Querying and Realistic Modelling of Traffic
245
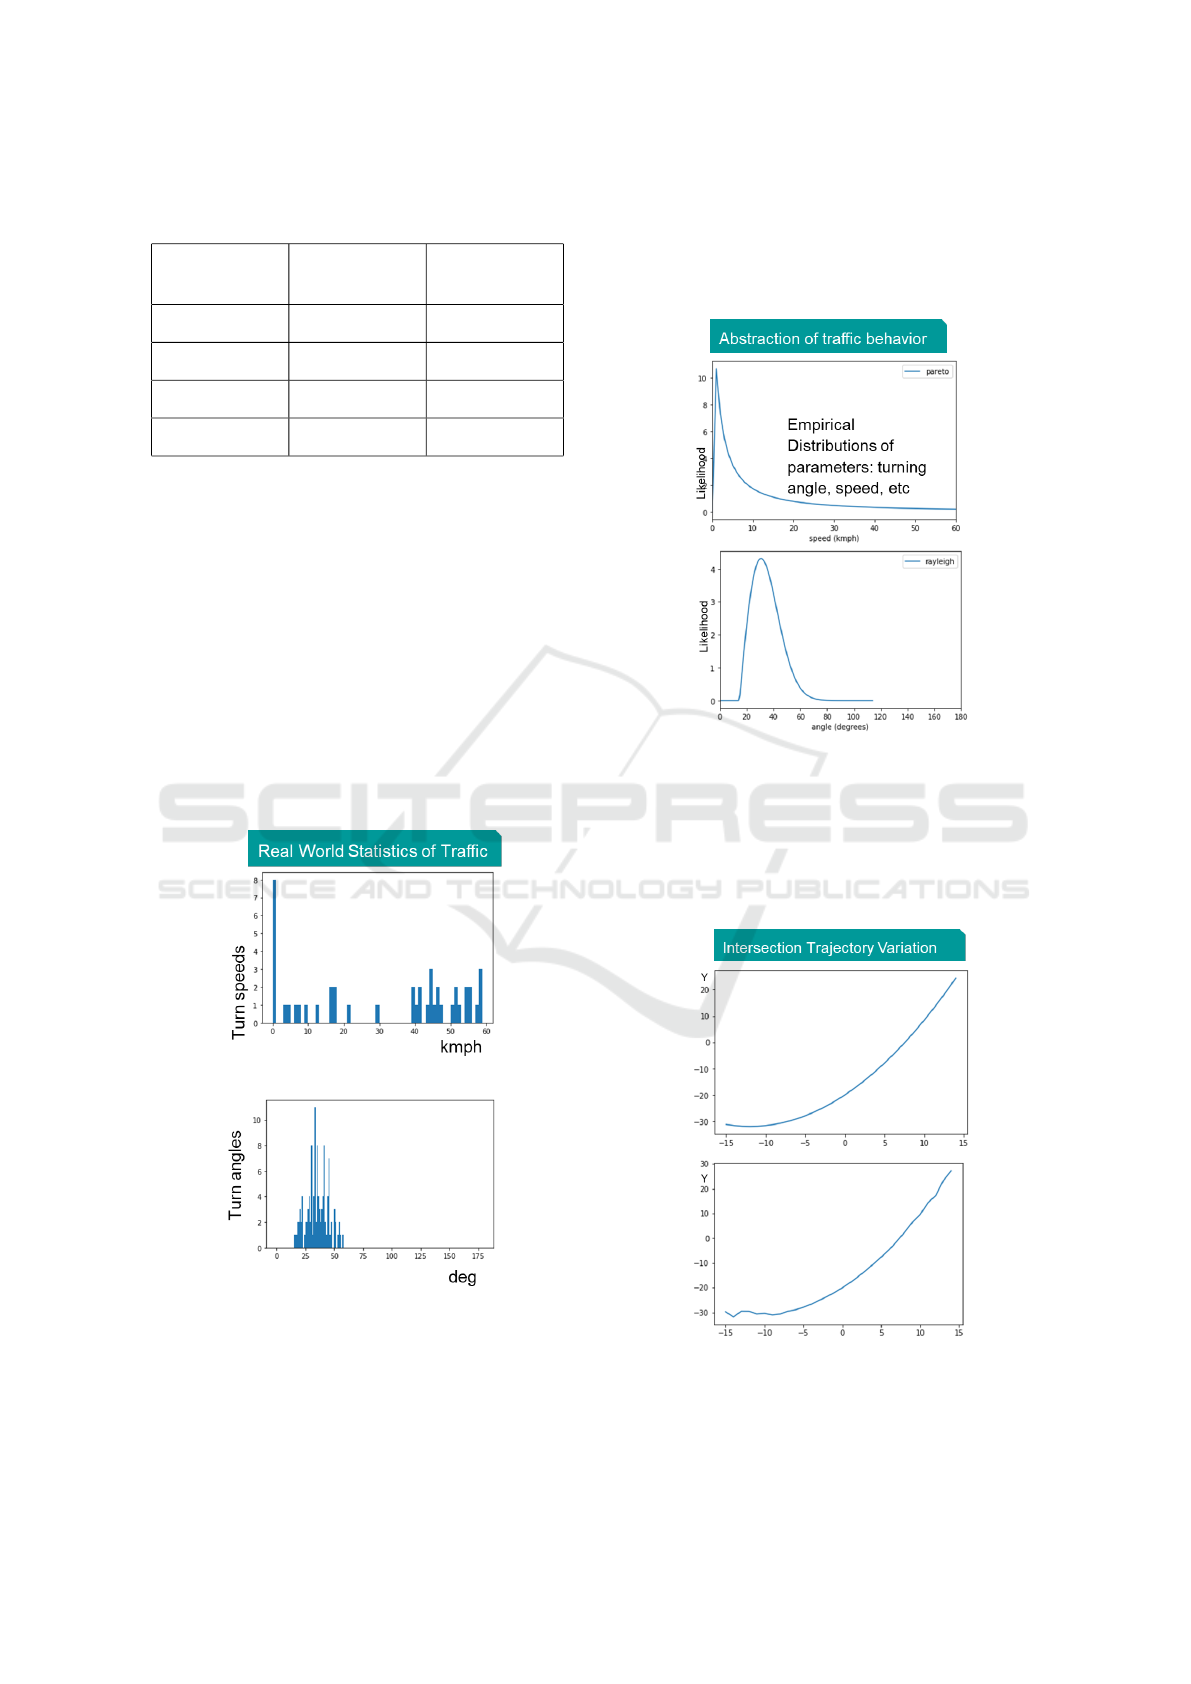
Table 3: Similarity – which pairs of vehicles or junction
exhibit similar behavior to each others.
name of first
node
name of sec-
ond node
similarity
”veh4”
”veh19” 1.0
”veh5”
”veh6” 1.0
”veh3”
”veh0” 1.0
”veh5”
”veh8” 1.0
5 DRIVING BEHAVIOR
MODELLING AND
ABSTRACTION
In this section we show how real world traffic data
can be used to model the driving behavior using pa-
rameterized functions. For the simple scenario of a
vehicle turning at an intersection, multiple factors in-
fluence and multiple variables describe its behavior.
Main variables that can be attributed to a turn are the
turning speed, turning angle and general turn trajec-
tory. We abstract all three from captured real world
data into parameterized functions.
Figure 13: Histogram of (left) turning speed and angle at an
intersection.
The captured data can be visualized in histograms
to understand general descriptive statistics and empir-
ical distribution of the variable. It can then be fit into
cumulative distribution functions based on the his-
togram as percentage of data before a specific value
to describe the cumulative probability at that value.
Many probability distribution functions can be used
based on general shape of the distribution.
Figure 14: Fitted empirical distributions describing turning
behavior wrt turning speed and angle.
Finally these distributions can be sampled from
and resulting samples can be used for many appli-
cations such as edge-case evaluation, scenario vari-
ations, scenario augmentation for simulation based
testing of AV stacks.
Figure 15: Trajectory Generation and Variation for Realistic
Scenarios in Simulation-based testing of AV stacks.
VEHITS 2023 - 9th International Conference on Vehicle Technology and Intelligent Transport Systems
246

6 CONCLUSIONS AND FUTURE
WORK
In this paper we have presented Traffic Analytics Sys-
tem that analyses real world data and represents the
road-traffic ecosystem in a semantic fashion. Our
framework produces traffic analytics insights at ac-
tionable level of abstraction due to the semantic na-
ture of the database constructed and analyzed. We
also presented map-processing algorithms to extract
map features such as roads, lanes and junctions. We
also presented graph data science applications on the
semantic database of traffic. Finally we presented
how real world traffic data can be used to abstract
driving behavior which can in turn be used to gen-
erate realistic scenarios for simulation based testing
of AV stacks.
REFERENCES
(2020). Asam opendrive (version ¿= 1.6.0). institutional
members of the asam opendrive. Released date Nov.
Bachmann, C. (2011). Multi-sensor data fusion for traffic
speed and travel time estimation. Master’s thesis, Uni-
versity of Toronto.
Bashir, F., Khokhar, A., and Schonfeld, D. (2005). Auto-
matic object trajectory-based motion recognition us-
ing gaussian mixture models. In 2005 IEEE Inter-
national Conference on Multimedia and Expo, pages
1532–1535. IEEE.
Buechel, M., Hinz, G., Ruehl, F., Schroth, H., Gyoeri,
C., and Knoll, A. (2017). Ontology-based traffic
scene modeling, traffic regulations dependent situa-
tional awareness and decision-making for automated
vehicles. In 2017 IEEE Intelligent Vehicles Sympo-
sium (IV), pages 1471–1476. IEEE.
Clarke, E., Klieber, W., Novacek, M., and Zuliani, P.
(2011). Model checking and the state explosion prob-
lem. In LASER Summer School on Software Engineer-
ing, pages 1–30, Berlin, Heidelberg. Springer.
Coelho, M. (2017). Distributed system behavior modeling
of urban systems with ontologies, rules and message
passing mechanisms. Master’s thesis, University of
Maryland, College Park.
Fan, S., Sun, Y., Lee, J., and Ha, J. (2020). A co-simulation
platform for powertrain controls development. SAE
Technical Paper, (2020-01-0265).
Fellendorf, M. and Vortisch, P. (2010). Microscopic traf-
fic flow simulator vissim. In Fundamentals of Traffic
Simulation, pages 63–93. Springer, New York, NY.
Haubrich, T., Seele, S., Herpers, R., M
¨
uller, M. E., and
Becker, P. (2014). A semantic road network model
for traffic simulations in virtual environments: Gener-
ation and integration. In 2014 IEEE 7th Workshop on
Software Engineering and Architectures for Realtime
Interactive Systems (SEARIS), pages 43–50. IEEE.
Hong, J., Sapp, B., and Philbin, J. (2019). Rules of the
road: Predicting driving behavior with a convolutional
model of semantic interactions. In Proceedings of the
IEEE/CVF Conference on Computer Vision and Pat-
tern Recognition, pages 8454–8462.
Kalra, N. and Paddock, S. (2016). Driving to safety: How
many miles of driving would it take to demonstrate
autonomous vehicle reliability? Transportation Re-
search Part A: Policy and Practice, 94:182–193.
Knull, J. E. (2017). Turn detection and analysis of turn pa-
rameters for driver characterization. Master’s thesis,
The University of Western Ontario.
L
´
ecu
´
e, F., Schumann, A., and Sbodio, M. L. (2012). Ap-
plying semantic web technologies for diagnosing road
traffic congestions. In International Semantic Web
Conference, pages 114–130. Springer.
Medrano-Berumen, C. and Akbas, M. (2019). Abstract
simulation scenario generation for autonomous vehi-
cle verification. In 2019 SoutheastCon, pages 1–6.
IEEE.
Mirboland, M. and Smarsly, K. (2018). A semantic model
of intelligent transportation systems. In EG-ICE.
Noyce, D., Chittori, M., Santiago-Chaparro, K., and Bill,
A. R. (2016). Automated turning movement counts
for shared lanes using existing vehicle detection in-
frastructure. Technical report, NCHRP IDEA Project
177.
Pathrudkar, S. e. a. (2021). Scevar (scenario variations)
database: Real world statistics driven scenario vari-
ations for av testing in simulation. In 13th ACM Web
Science Conference.
Wei, F., Guo, W., Liu, X., Liang, C., and Feng, T. (2014).
Left-turning vehicle trajectory modeling and guide
line setting at the intersection. Discrete Dynamics in
Nature and Society, 2014.
Wu, T., Qin, J., and Wan, Y. (2019). Tost: A topo-
logical semantic model for gps trajectories inside
road networks. ISPRS International Journal of Geo-
Information, 8(9):410.
Yu, C., Zhang, C., Tian, G., and Liang, L. (2012). Vehi-
cle trajectory description for traffic events detection.
In Advances on Digital Television and Wireless Multi-
media Communications, pages 228–235. Springer.
Zhang, C., Liu, Y., Zhao, D., and Su, Y. (2014). Roadview:
A traffic scene simulator for autonomous vehicle sim-
ulation testing. In 17th International IEEE Confer-
ence on Intelligent Transportation Systems (ITSC),
pages 1160–1165. IEEE.
Zhang, H., Geiger, A., and Urtasun, R. (2013). Understand-
ing high-level semantics by modeling traffic patterns.
In Proceedings of the IEEE International Conference
on Computer Vision, pages 3056–3063.
Framework and Algorithms for Data Analytics, Semantic Querying and Realistic Modelling of Traffic
247
