
Classification of H&E Images via CNN Models with XAI Approaches,
DeepDream Representations and Multiple Classifiers
Leandro Alves Neves
1 a
, Jo
˜
ao Manuel Cardoso Martinez
1
, Leonardo H. da Costa Longo
1
,
Guilherme Freire Roberto
2 b
, Tha
´
ına Aparecida Azevedo Tosta
3 c
, Paulo Rog
´
erio de Faria
4 d
,
Adriano Mota Loyola
5 e
, S
´
ergio Vitorino Cardoso
5 f
, Adriano Barbosa Silva
6 g
,
Marcelo Zanchetta do Nascimento
6 h
and Guilherme Botazzo Rozendo
1 i
1
Department of Computer Science and Statistics (DCCE), S
˜
ao Paulo State University (UNESP),
Rua Crist
´
ov
˜
ao Colombo, 2265, 15054-000, S
˜
ao Jos
´
e do Rio Preto-SP, Brazil
2
Institute of Mathematics and Computer Science (ICMC), University of S
˜
ao Paulo (USP),
Av. Trabalhador S
˜
ao-carlense, 400, 13566-590, S
˜
ao Carlos-SP, Brazil
3
Science and Technology Institute, Federal University of S
˜
ao Paulo (UNIFESP),
Avenida Cesare Mansueto Giulio Lattes, 1201, 12247-014, S
˜
ao Jos
´
e dos Campos, S
˜
ao Paulo, Brazil
4
Department of Histology and Morphology, Institute of Biomedical Science,
Federal University of Uberl
ˆ
andia (UFU), Av. Amazonas, S/N, 38405-320, Uberl
ˆ
andia-MG, Brazil
5
Area of Oral Pathology, School of Dentistry, Federal University of Uberl
ˆ
andia (UFU),
R. Cear
´
a - Umuarama, 38402-018, Uberl
ˆ
andia-MG, Brazil
6
Faculty of Computer Science (FACOM), Federal University of Uberl
ˆ
andia (UFU),
Avenida Jo
˜
ao Naves de
´
Avila 2121, Bl.B, 38400-902, Uberl
ˆ
andia-MG, Brazil
Keywords:
Histological Images, Grad-CAM, LIME, DeepDream Representations, Classification.
Abstract:
The study of diseases via histological images with machine learning techniques has provided important ad-
vances for diagnostic support systems. In this project, a study was developed to classify patterns in histo-
logical images, based on the association of convolutional neural networks, explainable artificial intelligence
techniques, DeepDream representations and multiple classifiers. The images under investigation were repre-
sentatives of breast cancer, colorectal cancer, liver tissue, and oral dysplasia. The most relevant features were
associated by applying the Relief algorithm. The classifiers used were Rotation Forest, Multilayer Perceptron,
Logistic, Random Forest, Decorate, IBk, K*, and SVM. The main results were areas under the ROC curve
ranging from 0.994 to 1, achieved with a maximum of 100 features. The collected information allows for
expanding the use of consolidated techniques in the area of classification and pattern recognition, in addition
to supporting future applications in computer-aided diagnosis.
1 INTRODUCTION
In image analysis, feature extraction techniques re-
quire specific conditions for processing natural data
a
https://orcid.org/0000-0001-8580-7054
b
https://orcid.org/0000-0001-5883-2983
c
https://orcid.org/0000-0002-9291-8892
d
https://orcid.org/0000-0003-2650-3960
e
https://orcid.org/0000-0001-9707-9365
f
https://orcid.org/0000-0003-1809-0617
g
https://orcid.org/0000-0001-8999-1135
h
https://orcid.org/0000-0003-3537-0178
i
https://orcid.org/0000-0002-4123-8264
in its raw form. For decades, a machine learning sys-
tem required careful engineering to define the best at-
tributes for the pattern classification process. Part of
the difficulties in this process was minimized by us-
ing approaches based on the concept of deep learning,
especially from convolutional neural networks (CNN)
(LeCun et al., 2015).
It is important to highlight that the use of a
CNN, via corresponding deep features with a classi-
fier external to the model, is capable of providing ap-
proaches that can result in efficient and computation-
ally accessible models (Dabeer et al., 2019). Studies
in the Literature show that hybrid models, that use
354
Neves, L., Martinez, J., Longo, L., Roberto, G., Tosta, T., de Faria, P., Loyola, A., Cardoso, S., Silva, A., do Nascimento, M. and Rozendo, G.
Classification of HE Images via CNN Models with XAI Approaches, DeepDream Representations and Multiple Classifiers.
DOI: 10.5220/0011839400003467
In Proceedings of the 25th International Conference on Enterprise Information Systems (ICEIS 2023) - Volume 1, pages 354-364
ISBN: 978-989-758-648-4; ISSN: 2184-4992
Copyright
c
2023 by SCITEPRESS – Science and Technology Publications, Lda. Under CC license (CC BY-NC-ND 4.0)
attribute selection from CNN with classifiers external
to the architecture, can present results equal to or even
better than those provided by a specific CNN model
(Coccia, 2020). In hybrid approaches, an essential
step is to choose the most relevant attributes, espe-
cially when external classifiers are used to categorize
deep features. Thus, the methods available in the Lit-
erature that focus on deep learning models, with the
use of transfer learning, use supervised methods to
perform rankings and, consequently, effectively iden-
tify the most significant features for the classification
process (Zeng et al., 2015).
Despite the previously mentioned advances, it is
still possible to investigate the discriminative capac-
ity of hybrid models and deep features based on dif-
ferent strategies of image representations (Adadi and
Berrada, 2018), such as explainable artificial intelli-
gence (XAI) methods (Mahendran and Vedaldi, 2016;
Vedaldi and Zisserman, 2013; Yosinski et al., 2015).
Thus, it is possible to use the features present in the
average pooling layer, applied as a structural regular-
izing strategy of a CNN, to define the main regions
that supported the classification. Relevant techniques
can be explored to support the classification process
of a CNN, such as gradient-weighted class activation
mapping (Grad-CAM) (Rajaraman et al., 2018; Reyes
et al., 2020), locally-interpretable model-agnostic ex-
planation (LIME) (Rajaraman et al., 2018; Reyes
et al., 2020; De Sousa et al., 2019) and DeepDream
(DD) (To
˘
gac¸ar et al., 2021; Mordvintsev et al., 2015;
Suzuki et al., 2017). In this context, we present a hy-
brid model capable of analyzing histological images
stained with Hematoxylin-Eosin (H&E), considering
deep features obtained from LIME, Grad-CAM and
DD representations. These associations are relevant
contributions for improving the computer-aided diag-
nosis, with new strategies and insights involving the
pattern recognition of H&E images. The main contri-
butions of this study are summarized as:
• Definition of a hybrid model based on the combi-
nation of representations (LIME, Grad-CAM and
DD), corresponding deep features and different
classifiers;
• Indication of the most appropriate associations
considering the strategies explored here in order
to classify H&E images, representatives of breast
cancer, colorectal cancer, liver tissue and oral dys-
plasia.
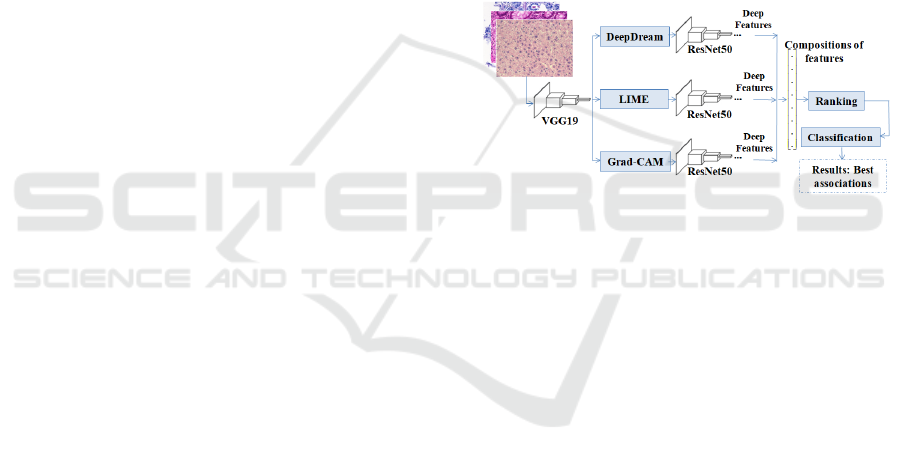
2 METHODOLOGY
The proposed model was developed in stages. The
first step consists of applying the VGG19 network
(Simonyan and Zisserman, 2014), with the transfer
learning strategy via ImageNet Large Scale Visual
Recognition Challenge (ILSVRC) (ImageNet, 2021),
and fine-tuning to get a deep learning model based on
each of the H&E datasets. The second step considered
the application of DeepDream, LIME and Grad-CAM
techniques to extract representations from the H&E
images, using the trained model via the previous step.
The third step is to use the ResNet50 model (He et al.,
2016), also using transfer learning, to extract the deep
features from the representations acquired on the sec-
ond step. The fourth step was defined to apply the
ReliefF algorithm (Urbanowicz et al., 2018) in order
to rank the most relevant features. Finally, the fifth
step includes the classification of the most relevant
features via multiple classifiers. An overview of the
proposal is shown in Figure 1.
Figure 1: An overview of the proposed strategy for investi-
gating H&E images.
The VGG19 and ResNet50 architectures were
chosen based on their qualities of efficiency and depth
for the analysis, classification and image processing
tasks, according to ImageNet ILSVRC 2014 and 2015
(Shallu and Mehra, 2018; Russakovsky et al., 2015).
In addition, these models were successfully explored
in studies of histological samples (Shallu and Mehra,
2018; Roberto et al., 2021; Tenguam et al., 2022), un-
like the strategy proposed here.
2.1 Context of Application: Histological
Images
The proposed approach in this study was tested on
images scientifically relevant, such as H&E images
of colorectal tumors, breast cancer and liver tissue.
• Colorectal Cancer (CR). This dataset consists of
histological images derived from 16 H&E-stained
sections of T3 or T4 stage colorectal cancer. The
histological sections were digitized into full slide
imaging (WSI), using a Zeiss MIRAX MIDI scan-
ner with pixel resolution 0.465µm. The samples
were categorized into benign or malignant groups
(Sirinukunwattana et al., 2017). In this work, 151
Classification of HE Images via CNN Models with XAI Approaches, DeepDream Representations and Multiple Classifiers
355

images with dimensions of 775x522 pixels were
used, divided into 67 benign cases and 84 malig-
nant cases.
• Breast Cancer (UCSB). This dataset is composed
of 58 histological images (benign with 32 cases
and malignant with 26 examples) obtained from
biopsies stained with H&E. All images were pro-
vided by the University of California Santa Bar-
bara (Gelasca et al., 2008). The images have di-
mensions of 768x896 pixels, RGB color model
and a 24-bit quantization rate.
• Liver tissue (LG). This dataset considers sam-
ples named liver gender (LG) from the study
presented by the Atlas of Gene Expression in
Mouse Aging Project (AGEMAP) (AGEMAP,
2020). The dataset consists of images with dimen-
sions of 417x312 pixels representing liver tissue
from mice separated as male and female. Thus,
these two classes represent the gender of the col-
lected sample, totaling 265 examples: male with
150 images and female with 115 samples.
• Oral Dysplasia (DYSP). This dataset was obtained
through 30 slices of tissue from the tongue of
mice. Each sample was stained with H&E, previ-
ously subjected to a carcinogen during two exper-
iments carried out in 2009 and 2010. This investi-
gation was approved by the Committee on Ethics
in the Use of Animals, under protocol number
038/39 at the Federal University of Uberl
ˆ
andia.
A total of 66 histological images were obtained
using the LeicaDM500 optical microscope at 400
magnification —-(2022). The image dataset used
in this work was composed of healthy samples
(benign) and severe dysplasia (malignant) with
74 and 222 cases, respectively. The images have
a resolution of 2048 × 1536 pixels (Silva et al.,
2022).
Figure 2 illustrates samples from each dataset with
their respective groups.
2.2 Step 1 - Deep Learning Model for
Each H&E Dataset
The VGG19 architecture was implemented to perform
the image extraction via techniques DD, Grad-CAM
and LIME, using the transfer learning strategy for rec-
ognizing the most important features of the activation
layer. Specifically, the representations were obtained
from the average pooling layer, as it contains the main
features for the classification process. The approach
based on transfer learning was defined from the Ima-
geNet dataset, allowing the classification and pattern
recognition in contexts with a few samples (Emilio
Soria Olivas, 2009).
It is important to highlight that the fine-tuning
process was applied to distinguish each dataset with
the corresponding groups: benign and malignant for
breast cancer, colorectal and oral dysplasia datasets;
male and female for LG samples. The learning rate
was 0.01, with training through the k-fold cross-
validation approach, with k=5, and a total of 10
epochs, as acceptable conditions in relation to those
observed in the specialized Literature. After train-
ing, the CNN models were applied to distinguish each
type of image. The accuracy values (Acc) and Loss
in each H&E set were obtained to illustrate the per-
formance of the CNN applied directly to the images
(Table 1).
Table 1: Acc and Loss values achieved via VGG19 on each
H&E dataset.
VGG19 UCSB CR LG DYSP
Acc(%) 59.80 85.60 71.50 89.60
Loss(%) 6.40 2.12 3.14 2.05
From the VGG19 fine-tuning process, it can be
seen that the Acc rates ranged from 59.80% to
89.60%, with highlights for the DYSP and CR sets
with the highest values. This interval was used as a
reference to know the obtained gains after applying
the proposed model. Also, it is observed that the Loss
rate was from 2.05% to 6.40%.
2.3 Step 2 - Application of the CNN
Models with DD, Grad-CAM E
LIME
In this step the original image representations using
DeepDream, LIME and Grad-CAM were extracted.
Further details on these techniques are discussed in
the following subsections.
2.3.1 DeepDream Approach
DeepDream (DD) is a simulation technique based on
the imaginary dimension of the human brain (Mord-
vintsev et al., 2015). This approach was defined to
indicate patterns (or features) in histological images
(or features), considering algorithmic pareidolia from
the information on the layers of a CNN (Suzuki et al.,
2017). Hence, the patterns observed in an image were
included on the output data and processed with the
other data extracted on the training step. For this pro-
posal, we used the same parameters as explored by
the authors in (Mordvintsev et al., 2015). In a prac-
tical point of view, from a given layer on a CNN,
ICEIS 2023 - 25th International Conference on Enterprise Information Systems
356
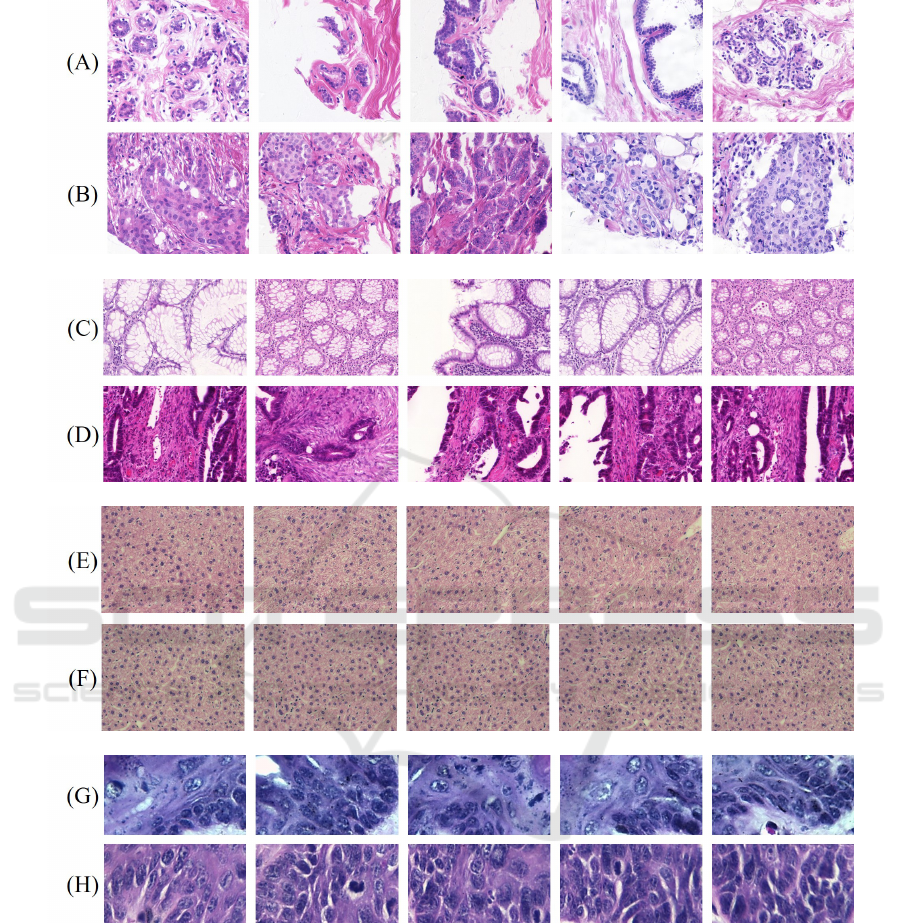
Figure 2: Examples of H&E samples: UCSB, benign (A) and malignant (B); CR, benign (C) and malignant (D); LG, class 0
(E) and class 1 (F); DYSP, benign (G) and malignant (H).
the DD algorithm uses specific neurons and its acti-
vations to reverse the information flow in a way that
the input image is adjusted until the network stabi-
lizes. This implies that for this to work the image
was altered, not the network, so it could combine the
original features on the image and the ones featured
on the selected layer. This outputs a new image from
what is ’observed’ by the network on the target layer’s
level. More precisely, the algorithm changes the orig-
inal images, so they can reflect the patterns learned
by the CNN (To
˘
gac¸ar et al., 2021; Mordvintsev et al.,
2015; Suzuki et al., 2017) and supplying a new set of
images for the analysis.
The DD images were extracted from CNN’s 20th
layer considering 40 iterations of adjustments, using
5 octaves (or scales of analysis), with a 1.4 ratio (or
scale factor), in relation to each other’s sizes. These
conditions allowed the exploration of patterns from
the smaller to the largest levels of abstraction and re-
inforce the details on the output images. Some exam-
ples of the images resulting from the application of
this technique are in Figure 3.
Classification of HE Images via CNN Models with XAI Approaches, DeepDream Representations and Multiple Classifiers
357
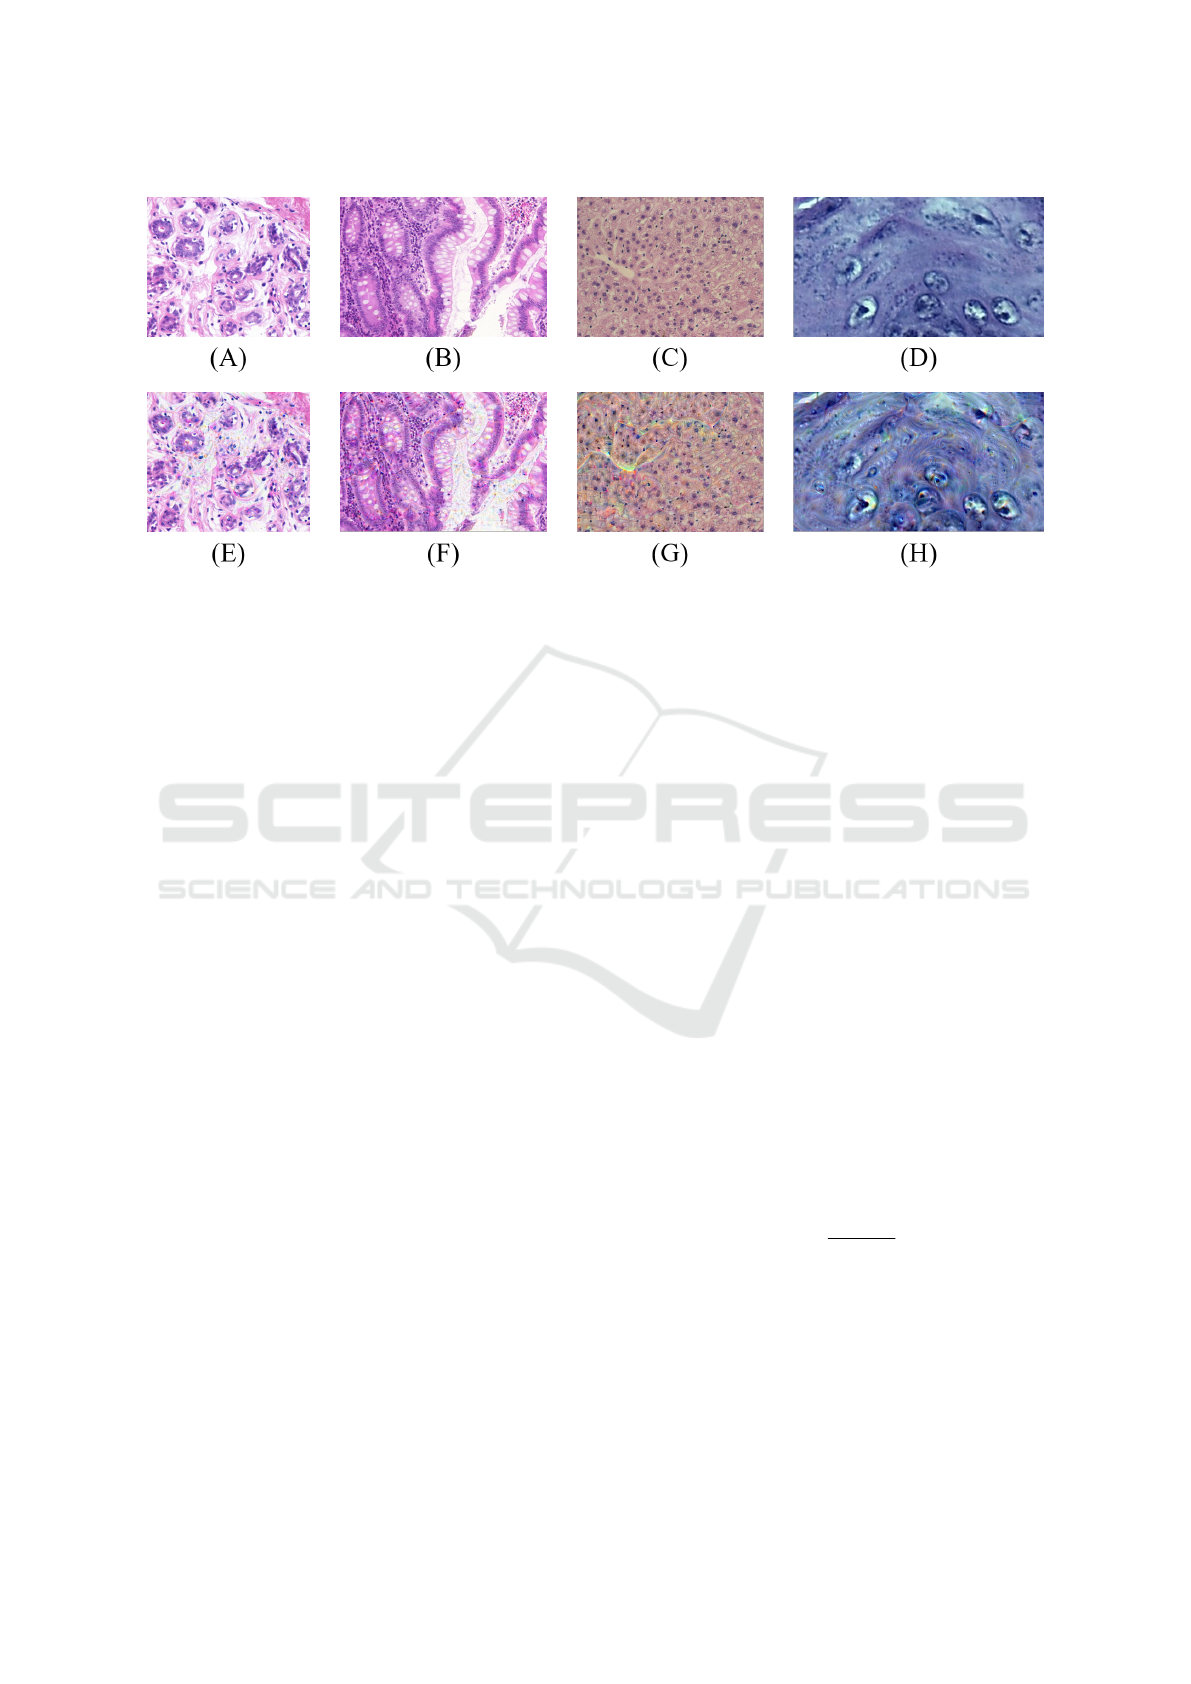
Figure 3: Examples of DD representations extracted from the samples of each H&E image dataset: UCSB original image
(A) e DD-UCSB (E); CR original image (B) e DD-CR (F); LG original image (C) e DD-LG (G); DYSP original image (D) e
DD-DYSP (H).
2.3.2 LIME Approach
The LIME technique was explored as a strategy
to provide local interpretability (histological sam-
ple level) for the complex classification defined via
VGG19 model. This occurred by approximating the
local complex model to a simple model (for instance,
a linear model) around the input sample to be inter-
preted (Ribeiro et al., 2016). The LIME technique au-
tomatically performed this process. In this work, the
technique allowed dividing the input image into seg-
ments called superpixels and selecting the ones that
most contributed to the output. The obtained super-
pixels were responsible for providing the explanation
of the classification of the analyzed sample (Ribeiro
et al., 2016).
Each explanation is obtained considering the pre-
dictions provided by the CNN model when analyzing
a number of perturbations on the original input, in our
experiments we used 1000. These perturbations are
created by removing segments of the image randomly,
which allows investigating which are the regions that
are most related to the original output when compar-
ing their similarities for the predictions with the same
model. Finally, the explanations were representations
of the 5 superpixels that most contributed to the out-
put classification.
In Figure 4, some examples of LIME representa-
tions obtained from H&E images are illustrated.
2.3.3 Grad-CAM Technique
A class activation mapping (CAM) made it possible
to know the regions of the image that supported the
prediction of the convolutional network explored here
(Zhou et al., 2016). Thus, the Grad-CAM technique
was the chosen model, a generalization of the CAM
approach, as it does not require a single type of layer
for map generation. Also, Grad-CAM uses the ReLU
function to avoid the influence of negative weights
present in the layer, especially considering that these
are not part of the regions commonly used to define
the final classification. Thus, in our proposal, the re-
sult of the Grad-CAM technique for a c class was un-
derstood as a weighted sum of deep features maps,
as presented by (Rajaraman et al., 2018; Reyes et al.,
2020), and summarized as:
GradM
c
(x, y) = ReLU(
∑
k
α
c
k
f
k
(x, y)), (1)
where f
k
(x, y) indicated the activation of a space
element (x, y) in the kth feature map; α
c
k
was the
weight obtained by calculating the gradient of a pre-
diction score; S
c
concerns the kth feature map.
As a complement, α
c
k
was obtained from:
α
c
k
=
∑
x,y
∂S
c
∂ f
k
(x, y)
. (2)
In order to implement this technique, the Grad-
CAM package for PyTorch was used to extract the ac-
tivation classes from the images, representing a heat
map (color map) with colors defined according to the
degree of activation of the analyzed region: blue for
the regions of lower activation; red for areas of great-
est activation; and colors between blue and red for
ICEIS 2023 - 25th International Conference on Enterprise Information Systems
358
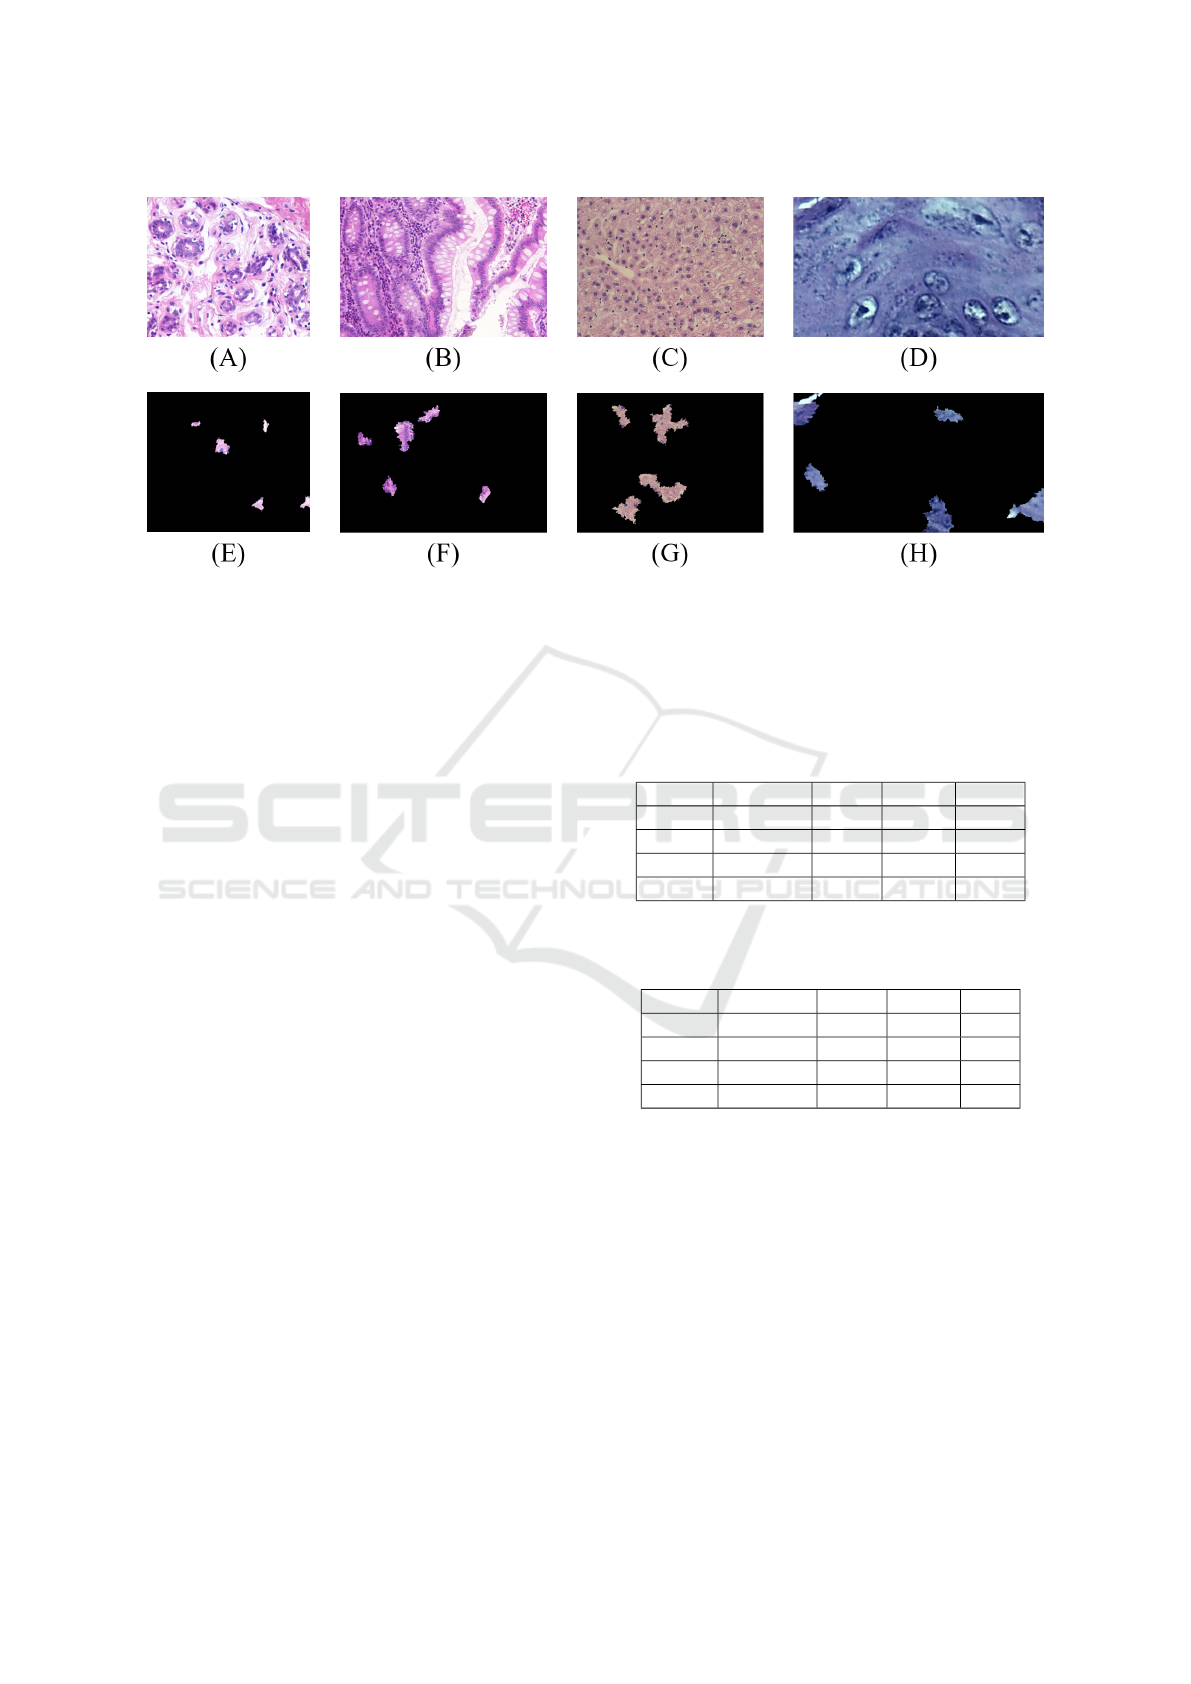
Figure 4: LIME representations obtained from the H&E samples: UCSB original (A) e LIME-UCSB (E); CR original (B) e
LIME-CR (F); LG original (C) e LIME-LG (G); DYSP original (D) e LIME-DYSP (H).
intermediate levels of activations. Thus, the images
were obtained from the VGG19 network, specifically
from the average pooling layer. Figure 5 shows some
Grad-CAM representations obtained from the H&E
images.
2.4 Step 3 - ResNet50: Definition of the
Deep Features
In this step, the obtained images via DD, LIME
and Grad-CAM techniques were given as input to
the ResNet50 model, considering the k-fold cross-
validation process, as indicated in the first two steps.
Then, the feature vectors were defined from the val-
ues (deep features) of a specific CNN layer, accord-
ing to the model described by (To
˘
gac¸ar et al., 2021).
The chosen layer was the average pooling, which con-
tains the obtained average from each feature map (Lin
et al., 2013). The obtained values were used to com-
pose the feature vectors. It is important to highlight
that, for the extraction step of the feature vectors,
the composition considered all the deep features ex-
tracted from the original H&E images and the corre-
sponding DD, LIME and Grad-CAM representations.
This composition was given as input for the next step.
Tables 2 and 3 present the performances consid-
ering the accuracy and loss values, respectively, for
the different types of images. It is important to note
that these values were used as benchmarks in rela-
tion to the results achieved with the proposed model.
Thus, from these values, it is noted that the best per-
formances were with the original images. The highest
rate achieved through a representation was approxi-
mately 71%, CR dataset, with DD images. In this
dataset, the accuracy value was 81% via original im-
ages.
Table 2: Accuracy values (%) achieved with the ResNet50
model after processing each type of image from each
dataset.
Originals CAM LIME DD
UCSB 60.50 56.60 50.00 56.40
CR 81 55.10 49.80 71.50
LG 68.80 54.20 59.30 62.70
DYSP 78.20 63.50 63.20 58.60
Table 3: Loss values via ResNet50 model for each type of
image from each dataset.
Originals CAM LIME DD
UCSB 6.46 6.44 6.77 7.50
CR 2.23 2.22 2.16 2.17
LG 1.37 1.36 1.42 1.57
DYSP 2.36 2.44 2.35 2.70
2.5 Step 4 - Feature Ranking
Each feature vector was analyzed by applying the Re-
liefF algorithm, capable of identifying the most rele-
vant and generalizable elements. This algorithm uses
a statistical method inspired by learning based on the
instance (Duda et al., 2012), considering comparative
calculations between the data stored in each instance
of the ranking process. Thus, the quality and rele-
vance of each feature are estimated, assigning weights
used to define the best ranking (Urbanowicz et al.,
2018). Here, the Weka package was used to apply
the ReliefF algorithm (of Waikato, 2019).
Classification of HE Images via CNN Models with XAI Approaches, DeepDream Representations and Multiple Classifiers
359
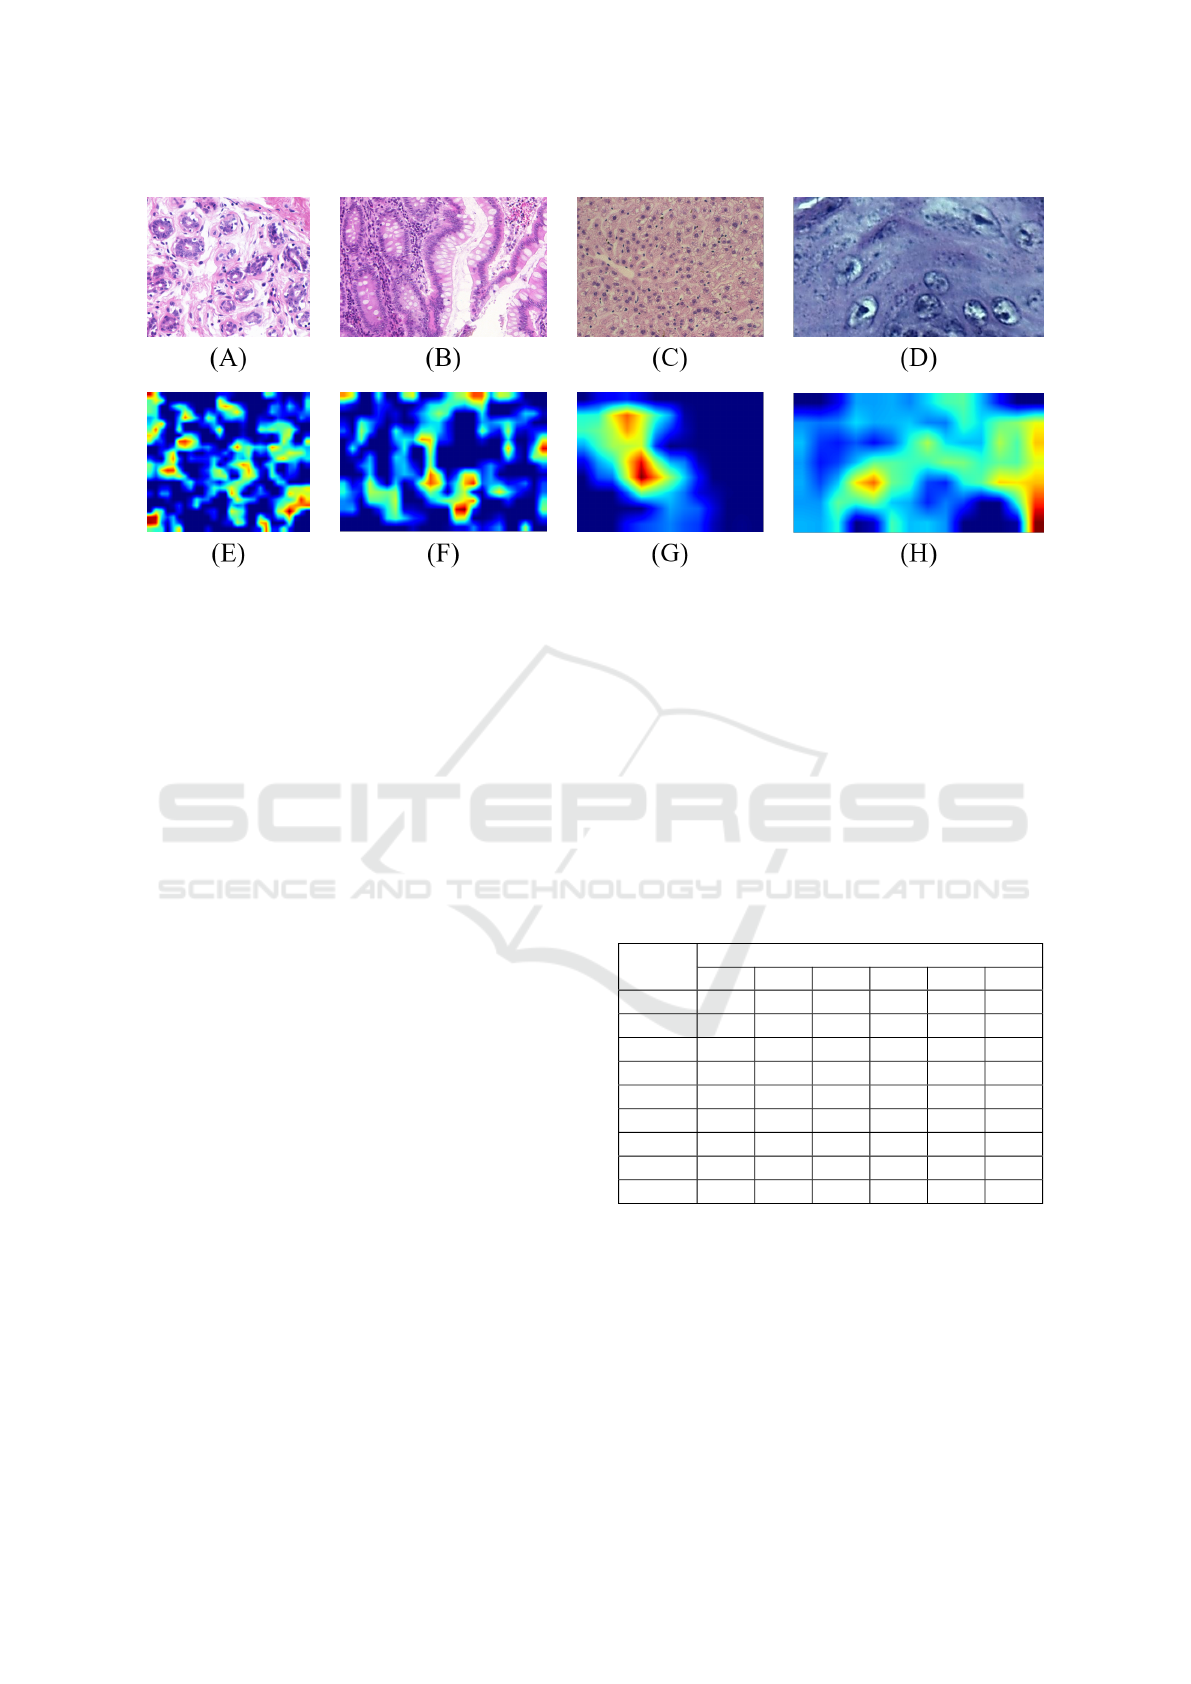
Figure 5: Grad-CAM representations obtained from H&E samples: original UCSB (A) and Grad-CAM-UCSB (E); original
CR (B) and Grad-CAM-CR (F); original LG (C) and Grad-CAM-LG (G); original DYSP (D) and Grad-CAM-DYSP (H).
2.6 Step 5 - Classification
The classification capacity of the features was ana-
lyzed by exploring different methods, such as: Mul-
tilayer Perceptron (MP), Logistic (LG) and Support
Vector Machine (SVM) - based on function; Ran-
dom Forest (RandF), based on decision tree; Rotation
Forest (RotF) and Decorate (Dec) - based on meta-
learning; KStar and K-nearest neighbor (IBk) - based
on lazy learning (Duda et al., 2012).
Performance analyzes were performed with differ-
ent compositions of features, with 10, 20, 30, 40, 50
and 100 best-ranked values. This strategy was use-
ful to know the combination capable of providing the
best performances. The metrics explored were area
under the ROC curve and F1-score.
3 DEVELOPMENT
ENVIRONMENT
The CNN models were developed and executed on
the Google Colab platform, using the Python lan-
guage. Some scripts were also executed on a com-
puter with an Intel processor, Core i3-6006U 2.0GHz,
4 GB RAM memory and cloud computing. The DD,
LIME and Grad-CAM techniques were defined via
a PyTorch framework, considering Archivision and
Torch libraries.
4 RESULTS AND DISCUSSION
The proposed methodology was applied to each H&E
dataset and the AUC values are displayed on Tables 4
to 7, considering the different experiments with clas-
sifiers and number of features. For each dataset, the
highest AUC measure with the fewest features was
highlighted in bold.
Table 4: Area under ROC curve for each classifier applied
to the UCSB dataset.
Number of features
10 20 30 40 50 100
RotF 0.992 0.995 0.983 0.995 0.984 0.985
MP 0.990 0.995 0.984 0.971 0.977 0.994
Log 0.976 0.971 0.969 0.963 0.960 0.971
RandF 0.978 0.991 0.989 0.984 0.993 0.988
Dec 0.987 0.990 0.986 0.986 0.947 0.987
KStar 0.990 0.999 0.990 0.970 0.975 0.970
IBk 0.921 0.921 0.933 0.945 0.945 0.976
SVM 0.869 0.904 0.904 0.904 0.923 0.923
Average 0.963 0.971 0.967 0.965 0.963 0.974
Considering the results displayed on Tables 4 to
7, it is noted that the highest averages with the low-
est number of features were defined by exploring 30
(CR), 40 (DYSP) and 100 (UCSB and LG) descrip-
tors.
When individual distinctions are considered,
maintaining the highest rate criterion with a reduced
number of descriptors, the AUC values were also ex-
pressive: 0.994 in the UCSB dataset, via the MP clas-
sifier and 100 attributes; 1 in the CR dataset with
ICEIS 2023 - 25th International Conference on Enterprise Information Systems
360
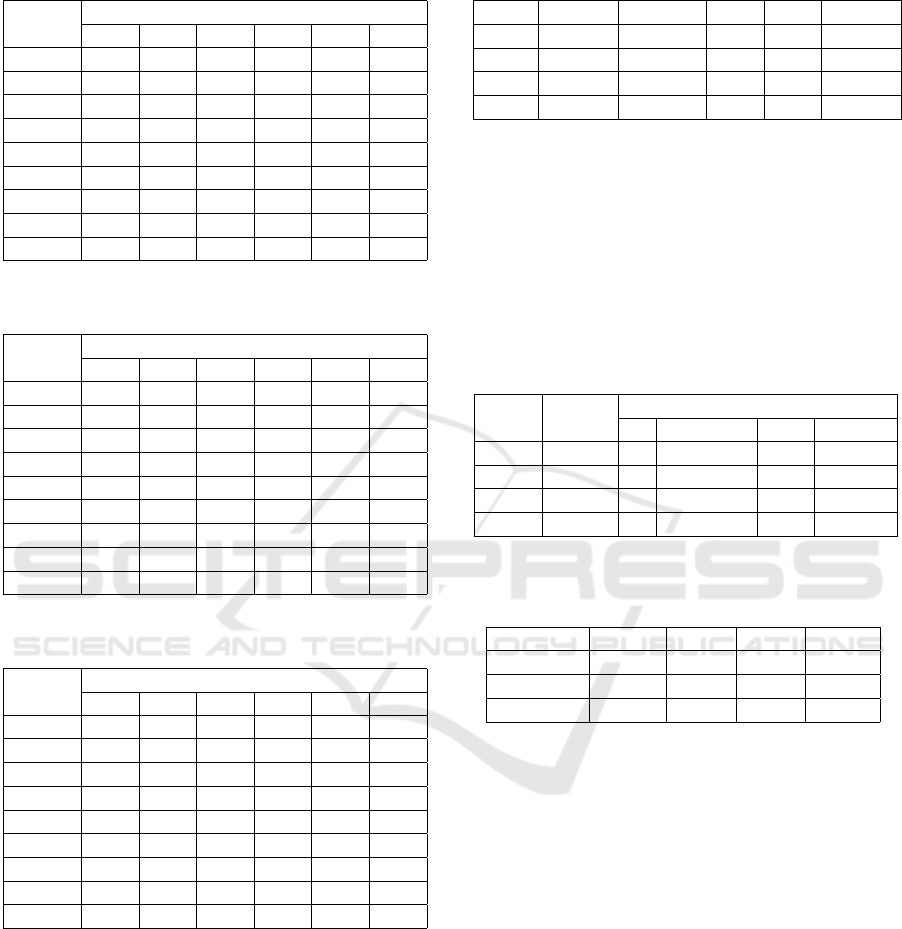
Table 5: Area under ROC curve for each classifier applied
to the CR dataset.
Number of features
10 20 30 40 50 100
RotF 0.999 0.998 0.999 0.999 0.998 0.998
MP 0.997 0.995 0.998 1 1 1
Log 0.990 0.992 0.995 0.995 0.995 0.996
RandF 0.999 0.999 0.999 1 0.999 1
Dec 0.998 0.999 0.999 1 0.999 0.999
KStar 0.998 0.999 1 1 1 0.996
IBk 0.974 0.966 0.993 1 1 0.993
SVM 0.966 0.959 0.966 0.986 0.980 0.973
Average 0.990 0.988 0.993 0.997 0.996 0.994
Table 6: Area under ROC curve for each classifier applied
to the LG dataset.
Number of features
10 20 30 40 50 100
RotF 0.988 0.993 0.993 0.998 0.998 0.999
MP 0.995 0.997 0.997 0.997 0.997 0.998
Log 0.971 0.992 0.996 0.994 0.994 0.994
RandF 0.996 0.997 0.997 0.996 0.997 0.995
Dec 0.993 0.995 0.997 0.997 0.993 0.996
KStar 0.989 0.997 0.996 0.996 0.995 0.997
IBk 0.955 0.975 0.978 0.967 0.966 0.981
SVM 0.969 0.987 0.980 0.980 0.983 0.987
Average 0.982 0.991 0.992 0.990 0.990 0.993
Table 7: Area under ROC curve for each classifier applied
to the DYSP dataset.
Number of features
10 20 30 40 50 100
RotF 0.988 0.985 0.986 0.993 0.990 0.975
MP 0.988 0.992 0.997 0.997 0.998 0.999
Log 0.978 0.996 0.994 0.989 0.989 0.980
RandF 0.989 0.988 0.994 0.994 0.995 0.992
Dec 0.993 0.986 0.992 0.998 0.995 0.989
KStar 0.988 0.970 0.975 0.994 0.987 0.988
IBk 0.936 0.917 0.966 0.973 0.977 0.977
SVM 0.939 0.946 0.959 0.959 0.966 0.959
Average 0.975 0.972 0.983 0.987 0.987 0.982
KStar and 30 attributes; 0.998 in the LG dataset with
RotF and 40 descriptors; 0.999 in the DYSP dataset,
MP and 100 attributes.
From values highlighted previously, a summary
of these associations is shown in Table 8, with infor-
mation about the total number of features, classifiers
and metrics. Therefore, in relation to the F1-Score,
it is noted that the quality of each result is important,
with values above 0.96, another fact that reinforces
the ability of the model developed here to classify dif-
ferent sets of H&E images.
Table 8: Summary of the best associations resulting from
the proposed method.
Features Classifier AUC Acc F1-Score
UCSB 100 MP 0.994 96.50 0.965
CR 30 Kstar 1 100 1
LG 100 RotF 0.999 99.20 0.992
DYSP 40 Dec 0.998 97.90 0.980
Also, Table 9 displays the distributions of the at-
tributes that defined the main associations (Table 8. It
is observed that the obtained features from the origi-
nal images were the most occurrence, followed by the
LIME, DD and Grad-CAM representations. Specifi-
cally, on the UCSB dataset, it is possible to verify that
the best solution involved only attributes of original
images.
Table 9: Percentage (%) distribution of features composing
the best solutions achieved.
Dataset Features
Percentage (%)
DD Grad-CAM LIME Originals
UCSB 100 3 2 9 86
CR 30 0 0 0 100
LG 100 1 0 0 99
DYSP 40 0 0 5 95
Table 10: Average accuracy (%) and gain of the proposed
method in relation to the ResNet50 approach.
UCSB CR LG DYSP
ResNet50 60.50 81.00 68.80 78.24
Proposed 96.50 100 99.20 97.90
Gain 36.00 19.00 30.40 19.66
At last, it was possible to achieve significant im-
provement for accuracy (Acc) and F1-Score, for in-
stance in relation to the performance of the ResNet50
applied directly on the original images, which is a
widely used approach for this specific field of study.
The best results for both methods are illustrated on
Table 10. The values resulting from the proposed
method were selected from the individual classifica-
tion for each type of H&E image, considering the
highest value with the lowest number of features.
The Acc values ranged between 96.50% (UCSB) and
100% (CR), while for the ResNet50 it ranged be-
tween 60.50% (UCSB) to 81% (CR). The difference
between these values indicates a gain ranging from
19% (CR) to 36% (UCSB) when using the proposed
method. It is also noticeable that the results for F1-
Score achieved values close to 1, which indicates
the high quality of the classification for this method:
0.937 (UCSB); 0.985 (CR); 0.982 (LG); and 0.968
(DYSP).
Classification of HE Images via CNN Models with XAI Approaches, DeepDream Representations and Multiple Classifiers
361

Table 11: Overview of the accuracy values (%) obtained by different approaches for colorectal cancer image classification.
Author Method Accuracy
Proposed VGG19+ResNet50 with DeepDream, Grad-CAM and LIME 100%
(Roberto et al., 2021)
ResNet50 with fine-tuning, multiscale and multidimensional
handcrafted features
99.39%
(Nanni et al., 2018) 8 CNN models, handcrafted features 97.60%
(Nanni et al., 2020) 9 CNN models, handcrafted features 97.50%
(Nanni et al., 2019) 6 CNN model, handcrafted features 97.00%
(Candelero et al., 2020)
Le-Net, multiscale and multidimensional handcrafted features,
Haralick, LBP
91.06%
Table 12: Overview of the accuracy values (%) obtained by different approaches for breast cancer image classification.
Author Method Accuracy
(Hassan et al., 2022)
4 CNN models and handcrafted features (Haralick,
histogram, RSHD, LDEP, SURF, DSIFT)
96.97%
Proposed VGG19+ResNet50 with DeepDream, Grad-CAM and LIME 96.50%
(Nanni et al., 2020) 9 CNN models, handcrafted features 96.33%
(Nanni et al., 2018) 8 CNN models, handcrafted features 95.00%
(Kausar et al., 2019) Color normalization, Haar wavelet and proposed CNN 91.00%
(Candelero et al., 2020)
Le-Net, multiscale and multidimensional handcrafted features,
Haralick, LBP
90.52%
(Roberto et al., 2021)
ResNet50 with fine-tuning, multiscale and multidimensional
handcrafted features
89.66%
(Sethy and Behera, 2022)
3 CNN models and handcrafted features (GLCM, HOG,
LBP)
84.20%
An overview of the results obtained with the pro-
posed method in relation to other approaches is shown
in Tables 11-14. Our method has provided rele-
vant results in all tested image groups and is situ-
ated among some state-of-the-art approaches. For in-
stance, we have obtained better accuracy values for
the classification of colorectal and oral dysplasia his-
tology images than the presented related work. More-
over, none of the related work has applied a similar
approach wherein explainable artificial intelligence
methods were used as a complementary input to the
CNN models. We believe this might be a viable ap-
proach for enhancing the performance of traditional
deep learning methods.
5 CONCLUSION
In this paper, we proposed a method that employs the
analysis on the performance of a hybrid model using
convolutional neural networks (CNNs), explainable
artificial intelligence techniques (Grad-CAM, LIME),
Deep Dream and multiple classifiers for the classifi-
cation of H&E histological images. The VGG19 ar-
chitecture supplied the model for extracting the im-
ages using each technique. From the ResNet50 archi-
tecture, we extracted deep features that were ranked
and selected using the Relief algorithm to compose
the feature vector for classification. The best results
were obtained from the proposed combination and in-
dicated a superior performance in relation to the clas-
sification using a CNN, an approach that is widely
used for this task. The achieved results can contribute
significantly to the expansion of the combined use of
these and other consolidated techniques in H&E im-
age classification, in order to improve techniques for
pattern recognition in this type of application. There-
fore, the results and observations presented in this
study are helpful for the development of techniques
and algorithms for computer-aided diagnostic appli-
cations that target histological images.
In future works, new classification approaches
could be explored to complement those proposed
here, in addition to providing new observations on
their advantages about each other. Moreover, Further-
more, new deep features from distinct CNN architec-
tures can provide other perspectives for the analysis
of H&E images.
ICEIS 2023 - 25th International Conference on Enterprise Information Systems
362
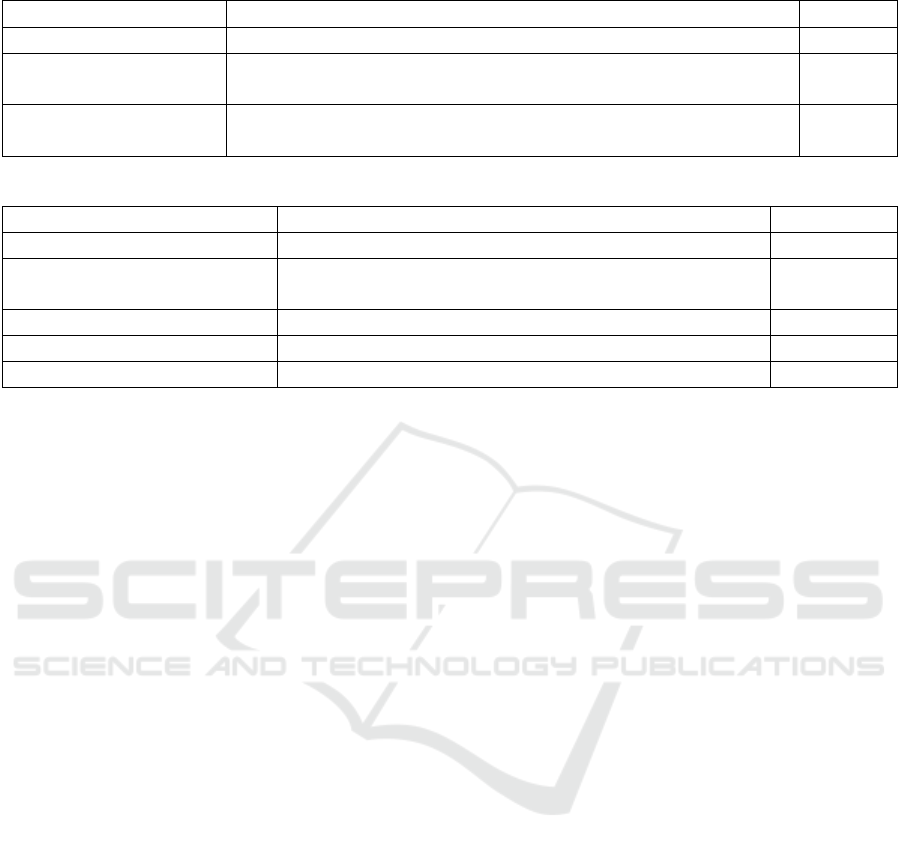
Table 13: Overview of the accuracy values (%) obtained by different approaches for oral dysplasia image classification.
Author Method Accuracy
Proposed VGG19+ResNet50 with DeepDream, Grad-CAM and LIME 97.90%
(Azarmehr et al., 2022)
Neural architecture search and handcrafted features
(morphological and non-morphological)
95.20%
(Adel et al., 2019) Handcrafted features (SIFT, SURF, ORB) 92.80%
(Silva et al., 2022) Handcrafted features (morphological and non-morphological) 92.40%
Table 14: Overview of the accuracy values (%) obtained by different approaches for liver image gender classification.
Author Method Accuracy (LG)
(Nanni et al., 2019) 6 CNN models and handcrafted features 100%
(Roberto et al., 2021)
ResNet50 with fine-tuning, multiscale and multidimensional
handcrafted features
99.62%
Proposed VGG19+ResNet50 with DeepDream, Grad-CAM and LIME 99.20%
(Andrearczyk and Whelan, 2017) Texture-CNN 98.20%
(Watanabe et al., 2016) GIST handcrafted features 93.70%
ACKNOWLEDGEMENTS
This study was financed in part by the: National
Council for Scientific and Technological Develop-
ment CNPq (Grants #153904/2021-6, #313643/2021-
0 and #311404/2021-9); the State of Minas Gerais Re-
search Foundation - FAPEMIG (Grant #APQ-00578-
18); the State of S
˜
ao Paulo Research Foundation -
FAPESP (Grant #2022/03020-1); Coordenac¸
˜
ao de
Aperfeic¸oamento de Pessoal de N
´
ıvel Superior -
Brasil (CAPES).
REFERENCES
Adadi, A. and Berrada, M. (2018). Peeking inside the black-
box: A survey on explainable artificial intelligence
(xai). IEEE Access, PP:1–1.
Adel, D., Mounir, J., El-Shafey, M., Eldin, Y. A., Masry,
N. E., Abdelraouf, A., and Elhamid, I. S. A. (2019).
Oral epithelial dysplasia computer aided diagnostic
approach. pages 313–318. Institute of Electrical and
Electronics Engineers Inc.
AGEMAP, N. I. o. A. (2020). The atlas of gene expression
in mouse aging project (agemap). https://ome.grc.nia.
nih.gov/iicbu2008/agemap/index.html. Access date:
04/05/2020.
Andrearczyk, V. and Whelan, P. F. (2017). Deep learning
for biomedical texture image analysis. Proceedings of
the Irish Machine Vision & Image Processing Confer-
ence. Irish Pattern Recognition & Classification Soci-
ety (IPRCS).
Azarmehr, N., Shephard, A., Mahmood, H., Rajpoot, N.,
and Khurram, S. A. (2022). Automated oral epithelial
dysplasia grading using neural networks and feature
analysis. In Medical Imaging with Deep Learning.
Candelero, D., Roberto, G. F., do Nascimento, M. Z.,
Rozendo, G. B., and Neves, L. A. (2020). Selec-
tion of cnn, haralick and fractal features based on evo-
lutionary algorithms for classification of histological
images. In 2020 IEEE International Conference on
Bioinformatics and Biomedicine (BIBM), volume 1,
pages 2709–2716. IEEE.
Coccia, M. (2020). Deep learning technology for improv-
ing cancer care in society: New directions in cancer
imaging driven by artificial intelligence. Technology
in Society, 60:101198.
Dabeer, S., Khan, M. M., and Islam, S. (2019). Can-
cer diagnosis in histopathological image: Cnn based
approach. Informatics in Medicine Unlocked, page
100231.
De Sousa, I. P., Vellasco, M. M. B. R., and Da Silva, E. C.
(2019). Local interpretable model-agnostic explana-
tions for classification of lymph node metastases. Sen-
sors (Basel, Switzerland), 19(13).
Duda, R. O., Hart, P. E., and Stork, D. G. (2012). Pattern
classification. John Wiley & Sons.
Emilio Soria Olivas, Jose David Martin Guerrero, M. M. S.
J. R. M. B. A. J. S. L. (2009). Handbook Of Research
On Machine Learning Applications and Trends: Algo-
rithms, Methods and Techniques. Information Science
Reference-Imprint of: IGI Publishing.
Gelasca, E. D., Byun, J., Obara, B., and Manjunath, B.
(2008). Evaluation and benchmark for biological im-
age segmentation. In IEEE International Conference
on Image Processing.
Hassan, A. H., Wahed, M. E., Atiea, M. A., and Metwally,
M. S. (2022). A hybrid approach for classification
breast cancer histopathology images. Frontiers in Sci-
entific Research and Technology, 3(1):1–10.
He, K., Zhang, X., Ren, S., and Sun, J. (2016). Deep resid-
ual learning for image recognition. In Proceedings of
the IEEE conference on computer vision and pattern
recognition, pages 770–778.
Classification of HE Images via CNN Models with XAI Approaches, DeepDream Representations and Multiple Classifiers
363

ImageNet (2021). Imagenet large scale visual recognition
challenge (ilsvrc).
Kausar, T., Wang, M., Idrees, M., and Lu, Y. (2019). Hwd-
cnn: Multi-class recognition in breast histopathology
with haar wavelet decomposed image based convolu-
tion neural network. Biocybernetics and Biomedical
Engineering, 39(4):967–982.
LeCun, Y., Bengio, Y., and Hinton, G. (2015). Deep learn-
ing. nature, 521(7553):436.
Lin, M., Chen, Q., and Yan, S. (2013). Network in network.
Mahendran, A. and Vedaldi, A. (2016). Visualizing
deep convolutional neural networks using natural pre-
images. International Journal of Computer Vision,
120.
Mordvintsev, A., Olah, C., and Tyka, M. (2015). Inception-
ism: Going deeper into neural networks.
Nanni, L., Brahnam, S., Ghidoni, S., and Maguolo, G.
(2019). General purpose (genp) bioimage ensemble of
handcrafted and learned features with data augmenta-
tion. CoRR, abs/1904.08084.
Nanni, L., Ghidoni, S., and Brahnam, S. (2018). Ensemble
of convolutional neural networks for bioimage classi-
fication. Applied Computing and Informatics.
Nanni, L., Ghidoni, S., Brahnam, S., Liu, S., and Zhang,
L. (2020). Ensemble of handcrafted and deep learned
features for cervical cell classification. In Nanni, L.,
Brahnam, S., Brattin, R., Ghidoni, S., and Jain, L., ed-
itors, Deep Learners and Deep Learner Descriptors
for Medical Applications. Intelligent Systems Refer-
ence Library, volume 186, pages 117–135. Springer.
of Waikato, T. U. (2019). weka weka 3 - data mining with
open source machine learning software in java.
Rajaraman, S., Candemir, S., Kim, I., Thoma, G., and An-
tani, S. (2018). Visualization and interpretation of
convolutional neural network predictions in detecting
pneumonia in pediatric chest radiographs. Applied
Sciences, 8(10):1715.
Reyes, M., Meier, R., Pereira, S., Silva, C. A., Dahlweid,
F.-M., Tengg-Kobligk, H. v., Summers, R. M., and
Wiest, R. (2020). On the interpretability of artificial
intelligence in radiology: challenges and opportuni-
ties. Radiology: artificial intelligence, 2(3):e190043.
Ribeiro, M. T., Singh, S., and Guestrin, C. (2016). ”why
should i trust you?”: Explaining the predictions of any
classifier. In Proceedings of the 22nd ACM SIGKDD
International Conference on Knowledge Discovery
and Data Mining, KDD ’16, page 1135–1144, New
York, NY, USA. Association for Computing Machin-
ery.
Roberto, G. F., Lumini, A., Neves, L. A., and do Nasci-
mento, M. Z. (2021). Fractal neural network: A new
ensemble of fractal geometry and convolutional neu-
ral networks for the classification of histology images.
Expert Systems with Applications, 166:114103.
Russakovsky, O., Deng, J., Su, H., Krause, J., Satheesh,
S., Ma, S., Huang, Z., Karpathy, A., Khosla, A.,
Bernstein, M., Berg, A. C., and Fei-Fei, L. (2015).
ImageNet Large Scale Visual Recognition Challenge.
International Journal of Computer Vision (IJCV),
115(3):211–252.
Sethy, P. K. and Behera, S. K. (2022). Automatic classifica-
tion with concatenation of deep and handcrafted fea-
tures of histological images for breast carcinoma diag-
nosis. Multimedia Tools and Applications, 81:9631–
9643.
Shallu and Mehra, R. (2018). Breast cancer histology im-
ages classification: Training from scratch or transfer
learning? ICT Express, 4(1):248.
Silva, A. B., Martins, A. S., Tosta, T. A. A., Neves, L. A.,
Servato, J. P. S., de Ara
´
ujo, M. S., de Faria, P. R., and
do Nascimento, M. Z. (2022). Computational analysis
of histological images from hematoxylin and eosin-
stained oral epithelial dysplasia tissue sections. Expert
Systems with Applications, 193:116456.
Simonyan, K. and Zisserman, A. (2014). Very deep con-
volutional networks for large-scale image recognition.
arXiv preprint arXiv:1409.1556.
Sirinukunwattana, K., Pluim, J. P., Chen, H., Qi, X., Heng,
P.-A., Guo, Y. B., Wang, L. Y., Matuszewski, B. J.,
Bruni, E., Sanchez, U., et al. (2017). Gland segmen-
tation in colon histology images: The glas challenge
contest. Medical image analysis, 35:489–502.
Suzuki, K., Roseboom, W., Schwartzman, D. J., and Seth,
A. K. (2017). A deep-dream virtual reality platform
for studying altered perceptual phenomenology. Sci-
entific reports, 7(1):1–11.
Tenguam, J. J., Da Costa Longo, L. H., Silva, A. B.,
De Faria, P. R., Do Nascimento, M. Z., and Neves,
L. A. (2022). Classification of h&e images explor-
ing ensemble learning with two-stage feature selec-
tion. In 2022 29th International Conference on Sys-
tems, Signals and Image Processing (IWSSIP), vol-
ume CFP2255E-ART, pages 1–4.
To
˘
gac¸ar, M., C
¨
omert, Z., and Ergen, B. (2021). Enhanc-
ing of dataset using deepdream, fuzzy color image
enhancement and hypercolumn techniques to detec-
tion of the alzheimer’s disease stages by deep learning
model. Neural Computing and Applications, pages 1–
13.
Urbanowicz, R. J., Meeker, M., La Cava, W., Olson, R. S.,
and Moore, J. H. (2018). Relief-based feature selec-
tion: Introduction and review. Journal of biomedical
informatics, 85:189–203.
Vedaldi, A. and Zisserman, A. (2013). Deep inside con-
volutional networks: Visualising image classification
models and saliency maps. preprint.
Watanabe, K., Kobayashi, T., and Wada, T. (2016). Semi-
supervised feature transformation for tissue image
classification. PLoS ONE, 11(12):1–20.
Yosinski, J., Clune, J., Nguyen, A., Fuchs, T., and Lipson,
H. (2015). Understanding neural networks through
deep visualization.
Zeng, Z., Zhang, H., Zhang, R., and Yin, C. (2015). A
novel feature selection method considering feature in-
teraction. Pattern Recognition, 48(8):2656–2666.
Zhou, B., Khosla, A., Lapedriza, A., Oliva, A., and Tor-
ralba, A. (2016). Learning deep features for discrim-
inative localization. In Proceedings of the IEEE con-
ference on computer vision and pattern recognition,
pages 2921–2929.
ICEIS 2023 - 25th International Conference on Enterprise Information Systems
364
