
An Energy Management Unit for Predictive Solar Energy Harvesting IoT
Anuj Justus Rajappa
1 a
, Adnan Sabovic
1
, Burcu Celikkol
3
, Michiel Aernouts
1
, Philippe Reiter
1
,
Siegfried Mercelis
1
, Peter Hellinckx
2
and Jeroen Famaey
1
1
IDLab, University of Antwerp - imec, Sint-Pietersvliet 7, 2000 Antwerp, Belgium
2
IDLab, University of Antwerp, Groenenborgerlaan 171, 2020 Antwerp, Belgium
3
OnePlanet Research Center, Bronland 10, Wageningen, 6708 WH, Netherlands
Keywords:
EMU, Energy Management Unit, Energy Awareness, Energy Harvesting, Energy Aware Scheduler, Energy
Prediction, Modular.
Abstract:
As the need for stand-alone energy harvesting devices increases, the alleviation of the ecological and economic
impact of their production and maintenance is possible by increasing battery life while reducing needed bat-
tery capacity. However, the increasing energy requirements of far-edge Artificial Intelligence and long-range
wireless transmissions in the Internet of Things threaten to demand ever-larger battery capacities for such re-
mote devices. Dynamic adaptation of device operation based on harvestable energy – i.e., energy awareness –
is a proposed solution and can be implemented using an energy management unit. Standardizing this unit as a
separate, active electronic component with standardized drivers can simplify overall system development and
benefit existing devices. Hence, we propose a novel interface that allows decoupling this unit from the rest
of the system, independent of the power management unit in use. As a first step, we developed a prototype
that uses the proposed interface to make existing, solar energy-based, third-party devices energy-aware with
provisions to be cross-compatible with differing power management units. The prototype was evaluated using
an air quality sensing device and improved the overall device’s transmission rate.
1 INTRODUCTION
Energy Harvesting (EH) embedded devices and sys-
tems are widely encouraged due to their self-sufficient
nature and the flexibility they provide during the
installation and maintenance (Chetto and Queudet,
2016). These devices usually harvest energy from un-
intentional ambient power sources (e.g., light, wind,
heat, motion, etc.) (Shaikh and Zeadally, 2016), that
are not under any artificial control for the intents of
powering the device, and use the energy harvested for
their normal operation. Due to the nature of their
energy source, these devices have a low impact on
the ecosystem compared to a purely battery-powered
(Kang et al., 2013; Hamers, 2020) or grid-powered
device (Yue et al., 2021).
Current Energy Harvesting Internet of Thing(s)
(EH-IoT) devices often execute their tasks periodi-
cally with fixed time intervals (Kjellby et al., 2018;
Bhusal et al., 2020; Kjellby et al., 2019; Ramson
a
https://orcid.org/0000-0001-8167-9171
et al., 2021), without taking their available energy
budget into account. Consequently, this leads to
power failures during periods with a low energy yield.
On the other hand, excess energy is not optimally used
during periods with a high energy yield. Having a
large energy reservoir such as large capacity batter-
ies or super capacitors might solve this issue, but that
leads to higher costs, greater waste after end-of-life
and larger form-factors (Shaikh and Zeadally, 2016).
Ideally, devices should change their behavior based
on their currently available energy, which will re-
quire energy-aware task scheduling (EATS) schemes
for energy management (Babayo et al., 2017), where
the device’s behaviour is altered by scheduling tasks
based on the energy availability. For this purpose, re-
searchers have developed energy-aware task schedul-
ing algorithms for low power – and even battery-less
– Internet of Things (IoT) (Sabovic et al., 2022; Del-
gado and Famaey, 2021). However, there are two vari-
ations of the same question whose answer is impor-
tant to increase the EATS’s performance, “How much
energy will be available after a certain time period?”
Anuj, J., Sabovic, A., Celikkol, B., Aernouts, M., Reiter, P., Mercelis, S., Hellinckx, P. and Famaey, J.
An Energy Management Unit for Predictive Solar Energy Harvesting IoT.
DOI: 10.5220/0011839500003482
In Proceedings of the 8th International Conference on Internet of Things, Big Data and Security (IoTBDS 2023), pages 39-50
ISBN: 978-989-758-643-9; ISSN: 2184-4976
Copyright
c
2023 by SCITEPRESS – Science and Technology Publications, Lda. Under CC license (CC BY-NC-ND 4.0)
39
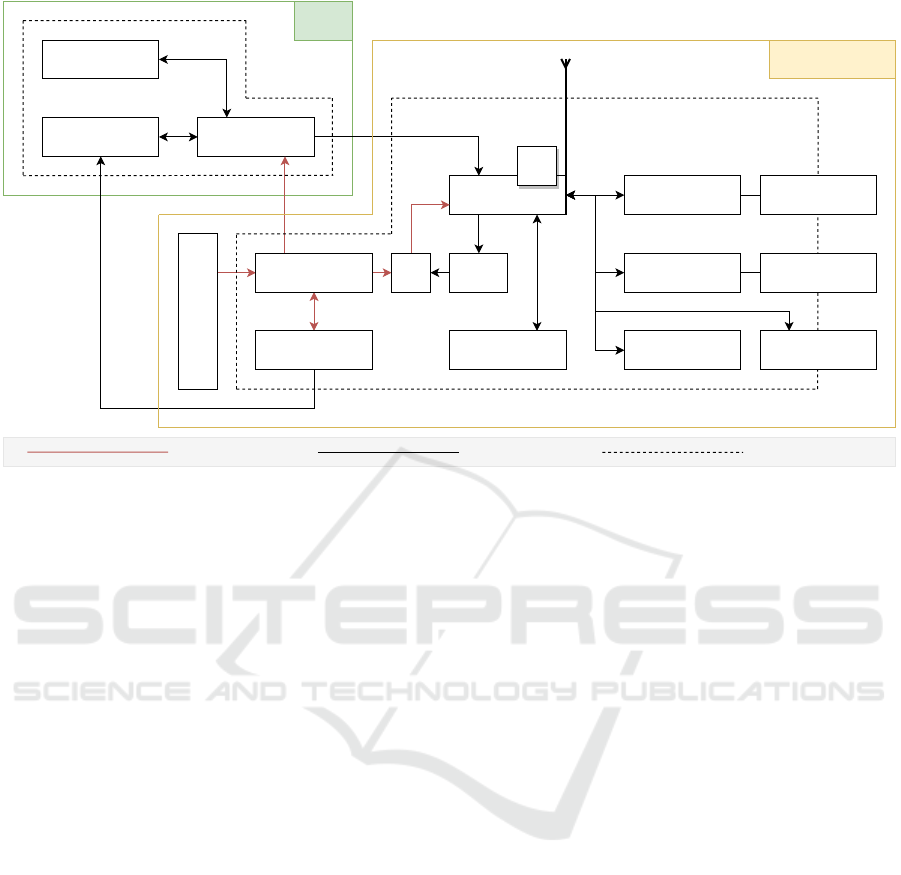
Nordic NRF52840 DK
APDS-9960
(Light sensor)
Active voltage divider
Solar charger
(PMU)
Li-ion battery
Arduino
MKR LTE-M
SIM
card
Serial flash
Watchdog
timer
Switch
SPI
Potentiostat
Potentiostat
RH/T sensorReal time clock
I2C
Gas sensor II
Gas sensor I
Antenna
Solar panel
Novel interface
(communication)
One Planet sensor box
(Third party device)
Data busPower Enclosure boundary
Prototype
(EMU)
Novel interface
(measure voltage)
Figure 1: Overall system block diagram.
(first question) and “When will a certain amount of
energy be available?” (second question). As both
questions are concerned with future available energy,
prediction algorithms, which allow the device to act
proactively, are used to answer them (Shafik et al.,
2018; Cammarano et al., 2016).
In this paper, unlike most of the current State of
the Art (SotA) techniques discussed in Section 2, we
focus on the second form of the question and answer
it with an Auto-regressive Integrated Moving Aver-
age (ARIMA) based energy prediction algorithm. A
simple EATS scheme uses the answer obtained (i.e.
the timing information) to maximize the efficient uti-
lization of harvested energy in a real EH-IoT device,
which is usually not the case in current SotA sys-
tems as the implementations based on the ARIMA
algorithm are often limited to simulation in this con-
text (Ji et al., 2009; Tanha et al., 2021). The pro-
posed predictive system is more adaptive and energy-
efficient compared to periodic polling-based reactive
techniques (Sabovic et al., 2022), which might require
a backup battery for continuous operation (Anagnos-
tou et al., 2018). Another novelty in our approach
is that, unlike most of the current SotA systems that
combine everything into one EH-IoT device, we sep-
arated the EATS scheme from the rest of the system
by building it into a prototype (cf. Section 4) i.e.
the energy management unit (EMU). This allows us
to add energy awareness (i.e., EATS) to non-energy-
aware third-party devices, through the proposed novel
interface, with ease. This idea was validated using
OnePlanet sensor box (Hofman et al., 2022) equipped
with Arduino as the third-party device and the corre-
sponding overall system block diagram with only the
significant connections is shown in Figure 1. The ex-
perimental setup used for validation is shown in Fig-
ure 5. In this paper, the role of EMU is associated
with optimal control of power consumed by the de-
vice with respect to time, while the role of the power
management unit (PMU) is associated with harvest-
ing maximum power from the energy harvester.
Other differences in our approach from most of
the current SotA are listed in Table 1. It includes han-
dling power cycles (Rodriguez Arreola et al., 2022),
due to energy shortages and additional overhead due
to energy predictions, which are usually unaccounted
by the current SotA energy prediction systems in
EH-IoT.
2 RELATED WORK
Current SotA techniques extensively use energy pre-
diction for answering the first question – i.e., “How
much energy will be available after a certain time pe-
riod ?” –, and use the energy information obtained
to improve their task scheduling schemes. Statistical
models, such as Exponentially Waited Moving Aver-
age (EWMA) (Kansal et al., 2007), Weather Condi-
tioned Moving Average (WCMA)(Recas Piorno et al.,
2009) and similar (Noh and Kang, 2011; Dehwah
et al., 2017), split a day into different time slots
IoTBDS 2023 - 8th International Conference on Internet of Things, Big Data and Security
40

Table 1: Difference between current SotA and our approach.
Current SotA approach Our approach
Requires accumulated energy data from time slots
older than at least a day (Kansal et al., 2007; Re-
cas Piorno et al., 2009; Cammarano et al., 2012;
Kosunalp, 2016; Stricker and Thiele, 2022; Yamin
and Bhat, 2021) for prediction. Hence, non-volatile
memory access to store day(s) old data and avoid
data loss is required, if the power cycle (Rodriguez
Arreola et al., 2022) is less than two days
Non-volatile memory access to store the time slot
data for prediction is not required as it can be col-
lected within a few minutes in the field. If the power
cycle is less than a few minutes, then the required
data can be augmented (cf. Section 3.2.2)
Overheads, such as the energy required to collect
data in the field for prediction are not usually con-
sidered as prediction overhead (Cammarano et al.,
2016; Stricker and Thiele, 2022; Yamin and Bhat,
2021)
Overheads associated with data collection in the
field for prediction purposes are mostly accounted
for and reported in Section 4 and Table 2
Accumulated solar energy (Yamin and Bhat, 2021;
Stricker and Thiele, 2022) or harvested power
(Cammarano et al., 2016; Kansal et al., 2007) is
the prediction variable. This variable’s present value
is measured in an EH-IoT device using either some
undisclosed circuitry (Yamin and Bhat, 2021) or so-
lar current with or without voltage (Kansal et al.,
2007; Dehwah et al., 2017), whose accuracy dis-
tortions due to PMU are not discussed. Training
a prediction model with this variable often requires
device-specific parameters, such as the characteris-
tics of its solar panels or training data collected from
a similar device, thus locking the trained model to
those device parameters (Stricker and Thiele, 2022;
Yamin and Bhat, 2021; Cammarano et al., 2016;
Kansal et al., 2007). Hence, changing a device pa-
rameter might often require retraining the prediction
model
Instantaneous solar irradiance is the prediction vari-
able. The present value of this variable is measured
using a dedicated light sensor, hence it is not af-
fected by the PMU (cf. last paragraph, Section 5).
Solar irradiance is the only variable used for training
the prediction model. The model’s predictions are
integrated with time and device parameters, such as
the efficiency of its solar panel, PMU, etc., for cal-
culating the actual harvestable energy (cf. Equation
1). As these device parameters can be changed even
during the run-time and are not involved in the pre-
diction model’s training process, it enables our pro-
totype to be plugged into different devices without
retraining the model
Long-term timekeeping (days) despite the power cy-
cles (Rodriguez Arreola et al., 2022) is required for
identifying time slots with respect to a day and for
managing old data (Cammarano et al., 2012; Kansal
et al., 2007; Stricker and Thiele, 2022; Yamin and
Bhat, 2021)
Long-term timekeeping is not required as there is
no need to identify any time slot with respect to a
day. Data older than a few minutes are usually not
required and are discarded
Prediction horizon is from short to long (minutes to
days) (Cammarano et al., 2016)
Prediction horizon is very short (seconds to min-
utes)
Aperiodic sleep is not possible as the device needs
to periodically collect the data for prediction (Cam-
marano et al., 2016; Kansal et al., 2007; Dehwah
et al., 2017; Yamin and Bhat, 2021)
Aperiodic sleep is possible as the missing periodic
data can be obtained using data augmentation (cf.
Section 3.2.2)
and records the energy accumulated in those time
slots during the present and previous days, which
is later used for predicting future energy accumula-
tion. PROfile Energy Prediction (Pro-Energy) (Cam-
marano et al., 2012) is based on data from previ-
ous days, but only typical days, which are charac-
terized as sunny, rainy, cloudy or mixed, are stored.
It analyzes the present-day weather condition and
matches it with the closest profile, whose time slot
data are then used for prediction. PROfile En-
ergy prediction model with Variable Length Times-
lots (Pro-Energy-VLT) (Cammarano et al., 2016) is
based on Pro-Energy but the granularity of time slots
for the profile are varied, based on the dynamics of
power source. Improved PROfile Energy Prediction
(IPro-Energy) (Muhammad et al., 2017) is based on
An Energy Management Unit for Predictive Solar Energy Harvesting IoT
41

Pro-Energy but the previous days recorded are based
on how old they are rather than typical day character-
ization. It uses an additional parameter called ‘smart-
ing factor’ that takes into account the rate of change of
energy between the time slots. Enhanced Pro-Energy
(Enhanced-Pro) (Deb and Roy, 2021) handles a previ-
ous day’s data similar to IPro-Energy but is also based
on Pro-Energy. It adds two new parameters: the tun-
ing factor, and the fine adjustment index to refine the
accuracy.
Machine learning algorithms are also used for pre-
dicting energy (Stricker and Thiele, 2022; Yamin and
Bhat, 2021). For instance, Q-learning-based solar
energy prediction (QL-SEP) (Kosunalp, 2016) is an
algorithm based on EWMA with an additional pa-
rameter called ‘daily ratio’, which is calculated us-
ing Q-learning. However, when dealing with short
term energy predictions in solar-based EH low-power
devices, statistical models are preferred to stochastic
and machine learning models (Wahba et al., 2020;
Bergonzini et al., 2009) due to their suitability in
terms of accuracy and overhead.
3 ENERGY AWARE TASK
SCHEDULER
This section describes our EATS, which consists of a
task scheduling algorithm aided by the energy predic-
tion algorithm. EATS is responsible for scheduling
tasks associated with actions such as sense and trans-
mit in the third-party device.
3.1 Task Scheduler
The prototype of EMU uses an energy-adaptive,
cyclic-scheduler to schedule independent atomic
tasks in the third-party device with the goal of max-
imizing the efficient utilization of harvested energy,
thereby decreasing residual energy utilization from
energy reservoirs. This is done in four steps. First,
the prototype checks the battery voltage and proceeds
to the next step if it is above the lower limit; else it
rechecks after a predefined period. Second, the proto-
type selects the task to execute next. Third, it calcu-
lates the waiting period (cf. Section 3.2.3) and waits
in sleep mode while collecting the energy required
to execute this task. However, this step is skipped
if the battery voltage is above the upper limit. Fi-
nally, it executes the task and the cycle repeats. Cal-
culating the waiting period based on the required and
harvestable energy is what makes the cyclic sched-
uler energy adaptive. It is done using energy predic-
tion. This scheduler can also be replaced with more
complex ones (Sabovic et al., 2022) (Delgado and
Famaey, 2021) based on task priorities and dependen-
cies, deadlines, etc.
3.2 Energy Prediction
A univariate time series forecasting technique is used
by the prototype of EMU for energy prediction, us-
ing the non-seasonal ARIMA model (Tanha et al.,
2021). The univariate being forecast is solar irradi-
ance, whose historical time series data is used to train
the model. Two functions, represented in Figure 2,
were used to implement the ARIMA model in the pro-
totype. Function 1 stores the observed data from the
prototype and calculates the residuals (difference be-
tween observed and predicted value). Function 2 uses
the observed data and residuals to predict the wait
time for accumulating a certain amount of energy.
Measured
harvester power
Energy required
(Er)
ARIMA model
Predict harvester
power in next
time point
Store / Update
the data and
time slot info.
Calculate
residuals
Net energy
>= Er ?
YES
NO
Function 1 Function 2
Number of time
slots to wait
Figure 2: Implemented ARIMA model abstract.
The consecutive data samples observed and pre-
dicted have equal time intervals (sample period) be-
tween them, which can be used to split the time do-
main into multiple, equally spaced time slots. A sam-
ple collected at the end of a time slot also belongs to
the beginning of the next time slot. The average of
the samples belonging to the beginning and end of a
particular time slot is assumed to be valid throughout
that time slot; i.e., if S
a
ir
and S
z
ir
are the solar irradiance
data measured at the beginning and end of a time slot,
then the solar energy harvested per m
2
in that time
slot is given by multiplying
S
a
ir
+S
z
ir
2
with the sample
period.
The observed data belonging to the beginning or
end of a time slot are called lag values and it is the
input to the Auto-regressive (AR) part of the ARIMA
algorithm. The difference between the observed data
and the corresponding prediction is called the resid-
uals or lagged forecast errors and it is the input to
the Moving Average (MA) part of the ARIMA al-
gorithm. The values P,D and Q are parameters that
define a ARIMA(P,D,Q) model, obtained after train-
ing the model using a custom framework in Python,
that uses the auto arima() function provided by ‘pm-
darima’ (Taylor G. Smith, 2022) Python library. P
represents the number of autoregressive terms, D rep-
resent the order of differencing required to convert a
time series data from non-stationary to stationary, and
Q is the number of residuals used by the prediction
IoTBDS 2023 - 8th International Conference on Internet of Things, Big Data and Security
42
model. After training the model, an intercept value
along with arrays of length P and Q containing co-
efficients corresponding to the AR and MA part of
the prediction model are obtained. The P,D,Q values,
coefficients and the intercept value are transferred to
the embedded platform of the prototype, described in
Section 4, and are used by the ARIMA model im-
plemented in it using the C language. The number
of lag values required by the model in the field for
prediction is given by max(P+D,Q). To complete the
training process within a reasonable time frame, the
P,D,Q values were constrained to 10, thus the maxi-
mum number of lag values possibly required by the
model would be 20. If each value consumes 4 bytes,
the worst case memory consumption by the lag values
will be 80 bytes.
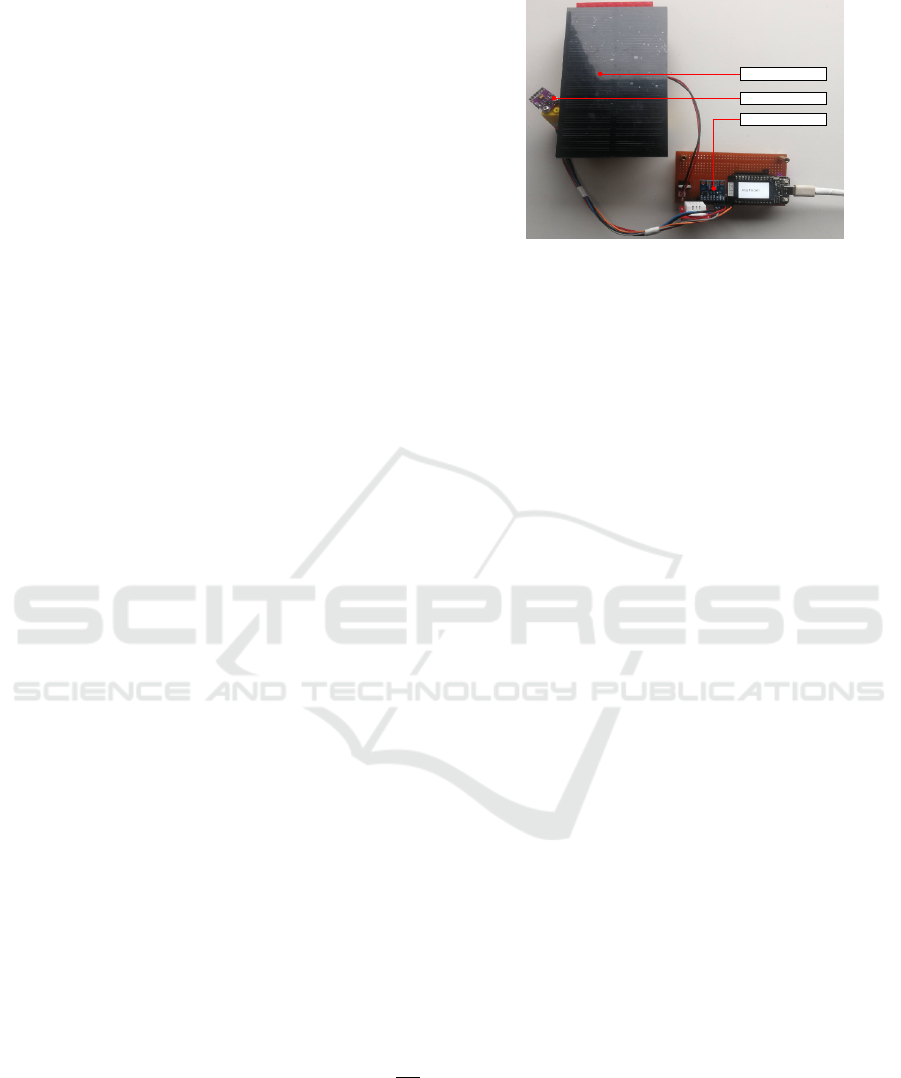
3.2.1 Training and Testing
The dataset to train and test the model was col-
lected using a custom setup (Anuj Justus Rajappa,
2022a; Anuj Justus Rajappa, 2022b), shown in figure
3, which includes a solar panel (Seed Studio, 2022)
and APDS-9960 light sensor (BROADCOM, 2022)
whose surfaces are placed on the same plane and as
close to one another as possible, without obstruct-
ing the incoming light. The INA226 power sensor
(Texas Instruments, 2022) was used to collect the so-
lar panel’s open circuit voltage (V
ocv
) and closed cir-
cuit current (I
ccc
), while the light sensor was used
to collect the solar irradiance data. An additional
DHT22 temperature and humidity sensor (Aosong
Electronics Co.,Ltd, 2022) was used to record the
environmental data. The sensors were sampled ev-
ery 200ms and logged. The setup was placed in-
doors, next to a curtain-less glass window facing
south-west in Antwerp (Belgium) between August
of 2021 and February of 2022. The total data col-
lected over around 120 days consumes approximately
2GB in memory and is publicly accessible (Anuj Jus-
tus, 2022). ARIMA(5,1,0) was obtained after train-
ing with the dataset obtained between 12-11-2021 to
15-01-2022 and testing was done with the dataset ob-
tained between 24-01-2022 to 03-02-2022 due to their
continuity in time. The performance of the model
with the shortest prediction horizon (cf. Section 4)
is shown in Figure 4a. The root mean square error
(RMSE) for the prediction is around 7.99 × 10
−2
mW
cm
2
,
which is two orders of magnitude less than the aver-
age operating range during daytime.
3.2.2 Deployment and Data Augmentation
Once the prediction model is trained and its parame-
ters are transferred to the prototype of EMU, the past
Irradiance sensor
Power(VI) sensor
Solar panel
Figure 3: Custom setup for compiling historical dataset.
and present solar irradiance measurements from the
field are required to predict the future value(s) of that
variable, which is obtained using an APDS-9960 light
sensor (BROADCOM, 2022) attached to the proto-
type. The sensor is disabled when not in use by is-
suing an I2C command to improve the prototype’s
energy efficiency. The nature of the data required is
time series; i.e., it must have a constant sampling pe-
riod. Due to uncertainty in the energy availability, it is
not possible to guarantee that the system will wake-up
at regular intervals to collect the data for prediction.
Besides, the wake-ups would also be costly in terms
of energy consumption. So, whenever data is miss-
ing and is required for prediction, the required data is
augmented with naive prediction using the previously
observed data; i.e. using the previous observed data to
fill the missing data. This also applies when the pre-
diction horizon spans across more than one time slot.
Assume the current time slot as T and the consecutive
two time slots as T+1 and T+2. When predicting for
the end of T+1, actual observed data until T is used as
lag values. When predicting for the end of T+2, the
lag value from the end of T+1 is required. Since it is
in the future, the lag values are augmented by using
the lag value from the end of time slot T. This will
add to the prediction error such that it increases as the
prediction horizon lengthens, as shown in Figure 4b.
3.2.3 Calculating Wait Time
Let T be the current time slot. T + 1, T + 2, T + 3, . ..
represent the consecutive time slots in the future with
sample period SP. Let IR
a
T +n
and IR
z
T +n
be the solar
irradiance prediction for the beginning and end of the
time slot T+n, where n ∈ N. The harvested energy for
that time slot (Ehv
T +n
) is calculated using the Equa-
tion 1, where PV
area
is the surface area of the solar
panel with efficiency PV
e f f
and PMU
e f f
is the effi-
ciency of the PMU, which can be obtained from the
datasheet of the solar panel and PMU, respectively.
An Energy Management Unit for Predictive Solar Energy Harvesting IoT
43
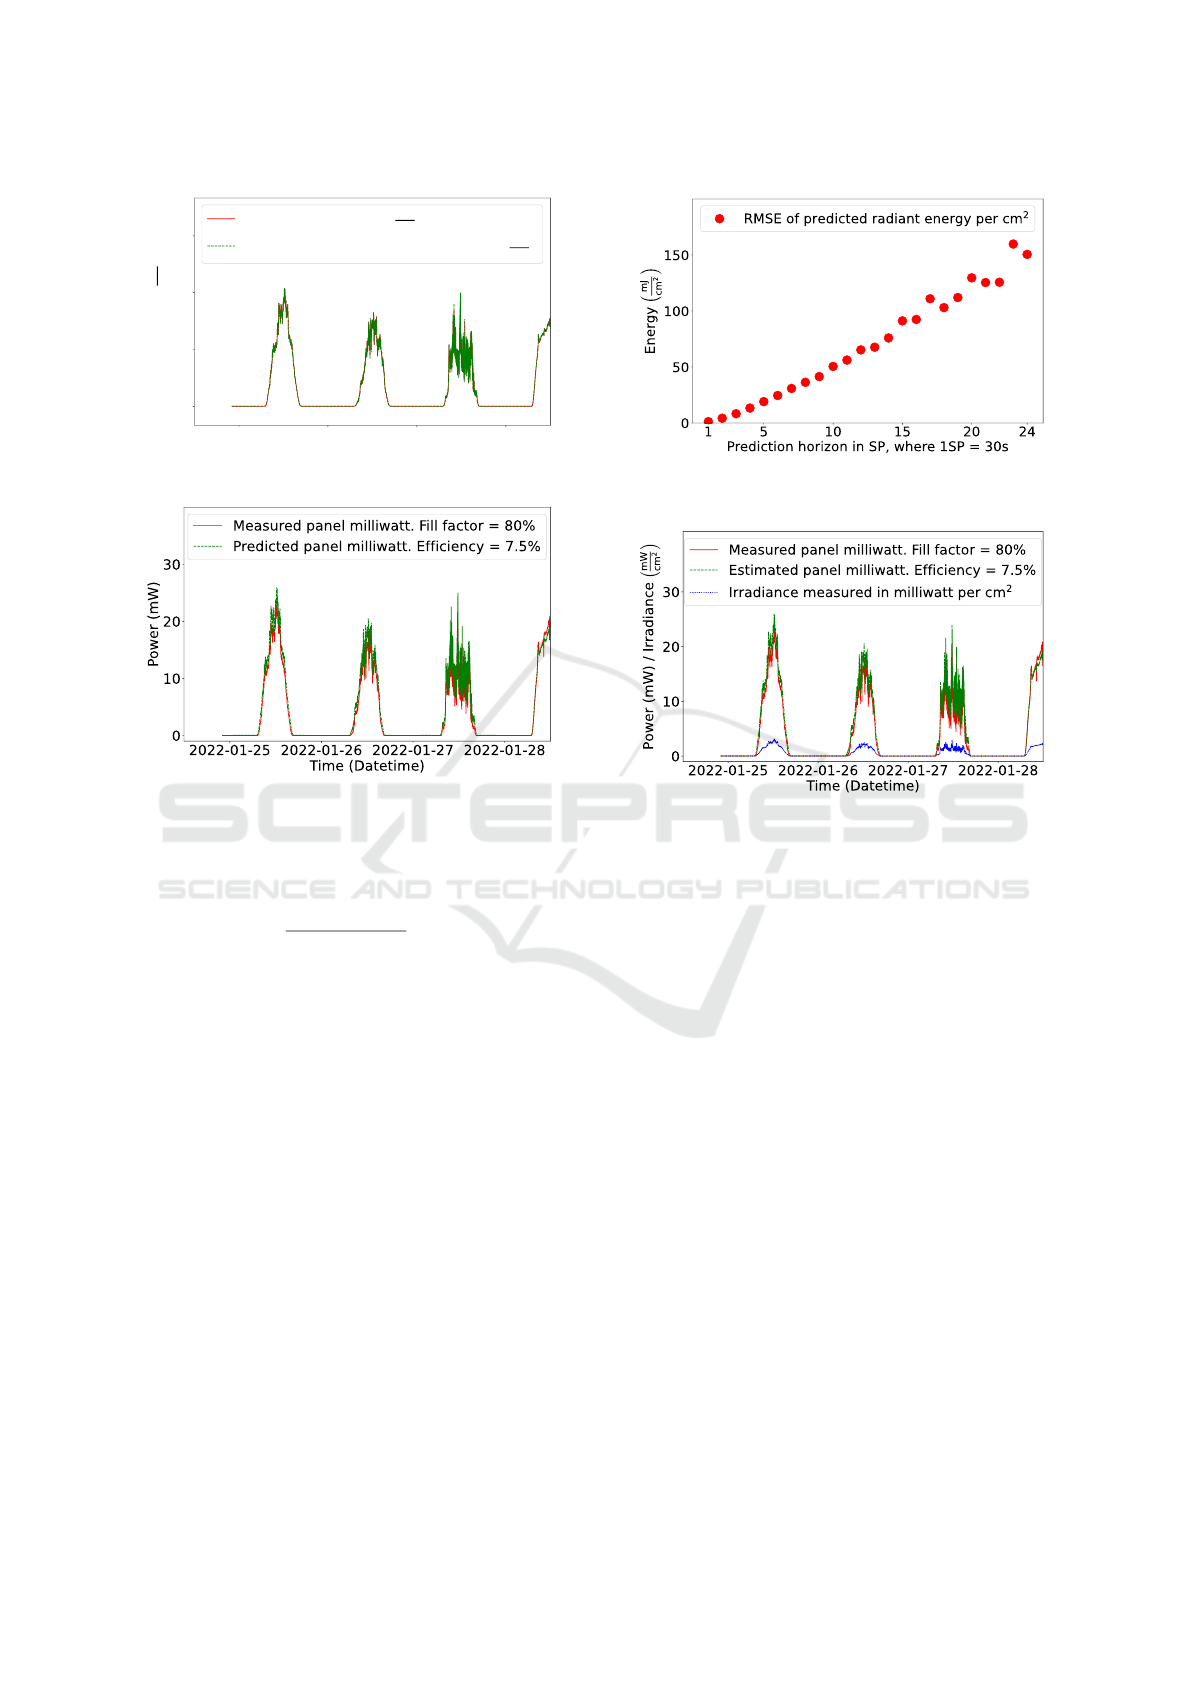
2022-01-25 2022-01-26 2022-01-27 2022-01-28
Time (Datetime)
0.0
1.5
3.0
4.5
Irradiance
(
mW
cm
2
)
Observed irradiance
(
mW
cm
2
)
Predicted irradiance. RMSE = 0.0799
(
mW
cm
2
)
Ajx
Ajfalcon
(a) Observed vs. predicted irradiance.
(b) RMSE vs. time horizon of accumulated solar radiant
energy prediction.
(c) Measured vs. predicted panel power.
(d) Measured vs. sensor estimated panel power.
Figure 4: Analysis of the prediction and light sensor output.
Ehv
T +n
=
IR
a
T +n
+ IR
z
T +n
2
× SP × PV
area
×PV
e f f
× PMU
e f f
(1)
‘Function 2’ is responsible for calculating the wait
time (cf. Figure 2). Let the measured quantity of en-
ergy required for a task to execute (Er) be input to
the function. The lowest value of w which will satisfy
the Equation 2 is the function’s output, where w ∈ N.
The wait period is w×SP. The graph showing the plot
between the measured panel power using the custom
setup (cf. Section 3.2.1) and predicted panel power
(i.e. IR
x
× PV
area
× PV
e f f
, where IR
x
is the irradiance
predicted for the time point x) is shown in Figure 4c,
where the efficiency of the panel was evaluated based
on the obtained dataset and a typical fill factor value
of 80% (Khanna et al., 2013; University of Washing-
ton, 2022) was chosen to assume the effects of max-
imum power point tracking (MPPT) in PMUs. The
prediction’s RMSE is 1.35mW, which is an order of
magnitude less than the average operating range dur-
ing daytime.
Er < Ehv
T +1
+Ehv
T +2
+. . .+Ehv
T +(w−1)
+Ehv
T +w
(2)
4 PROTOTYPE DESCRIPTION
The prototype of EMU is shown in Figure 5 and it’s
block diagram is shown in Figure 1. It consists of
a Nordic nRF52840 development kit (Nordic Semi-
conductor, 2022) running in nRF only mode as the
compute unit for running the prediction algorithms.
Irradiance data is collected with the APDS-9960 light
sensor, which communicates with the compute unit
using I2C protocol. To monitor the energy reservoir,
such as batteries, its voltage needs to be measured.
However the range of voltage available at the battery
terminal is incompatible with the range of voltage that
can be input to the ADC unit of the prototype. Hence,
a custom active voltage divider circuit was developed
and was used to scale the battery voltage and bring
it within the ADC input range. Electrical parame-
ters of the prototype were measured with a Joule-
scope (Jetperch, 2022; Huybrechts et al., 2021) under
different conditions, such as short-term time keeping
with a high resolution timer (timer) versus a real-time
clock (RTC), as shown in Table 2. A active max.
scenario corresponds to the measurement made dur-
IoTBDS 2023 - 8th International Conference on Internet of Things, Big Data and Security
44
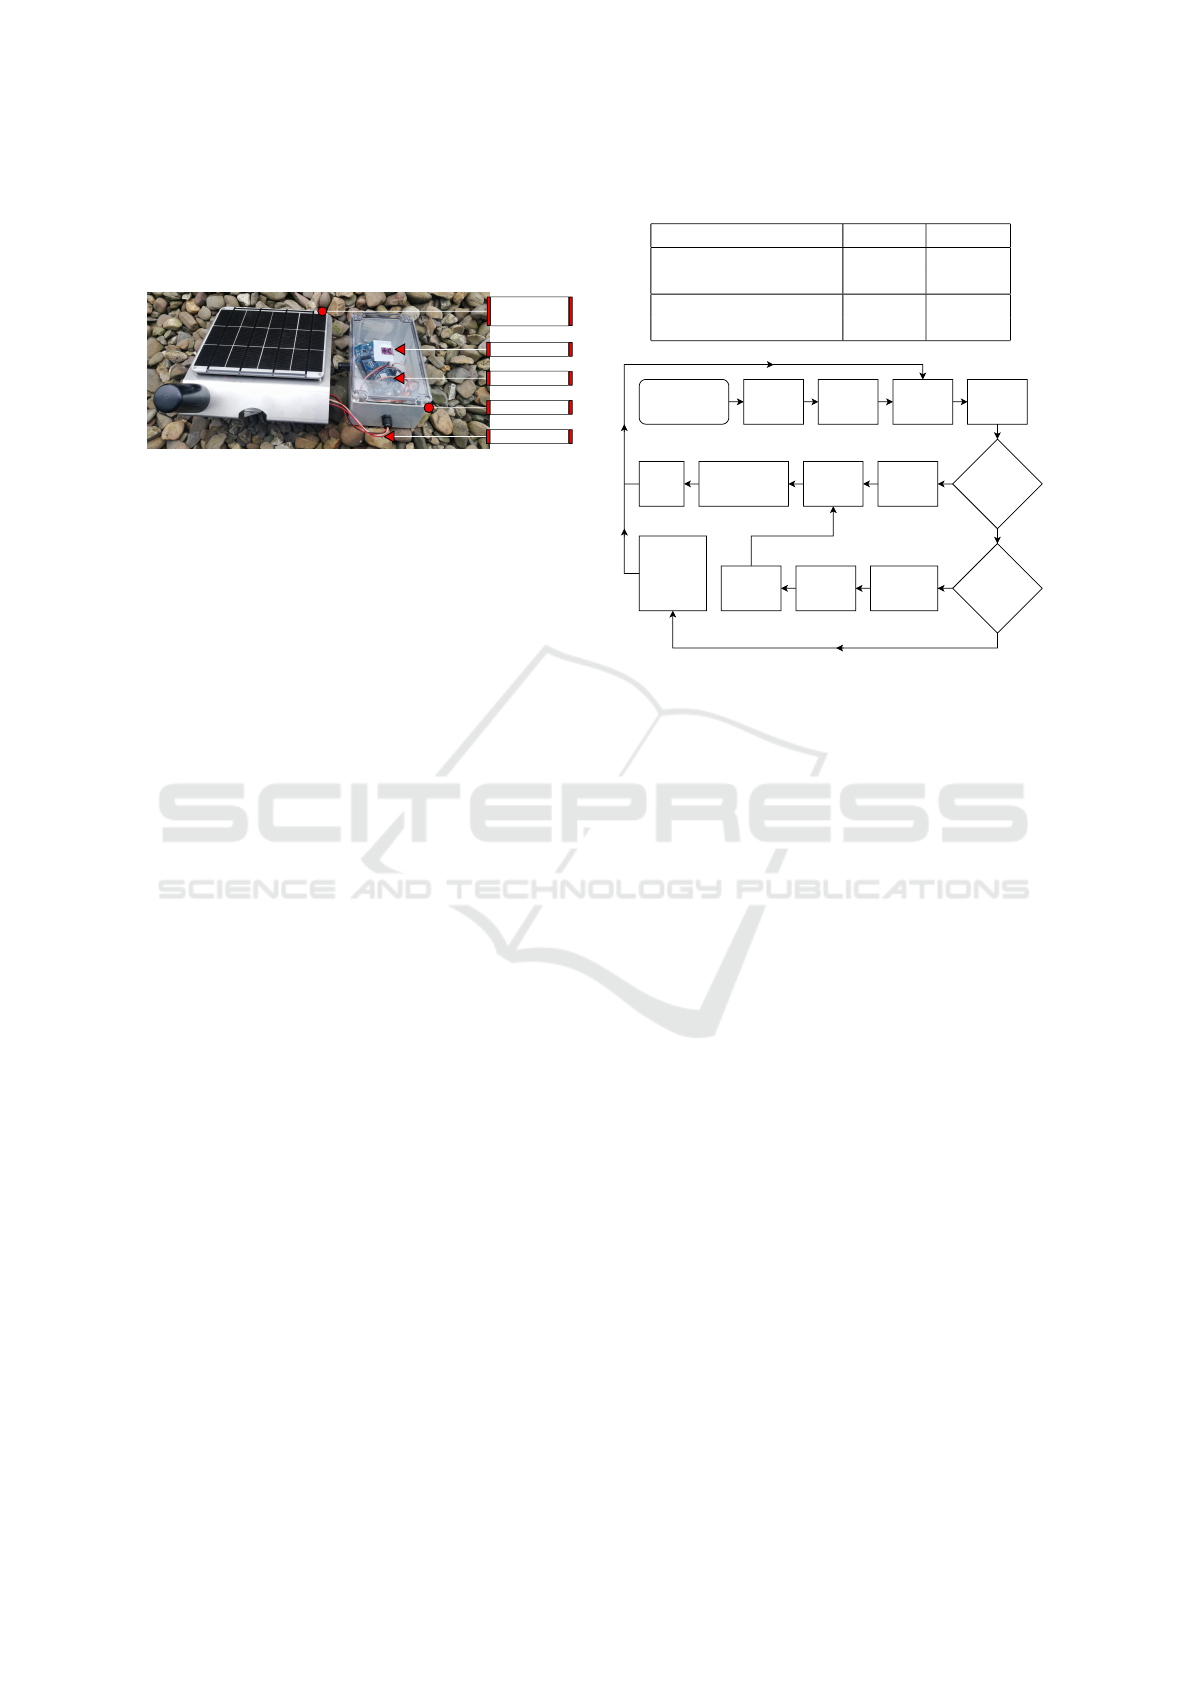
ing the active states, when the sensor and EATS are
in their maximum power consumption configuration.
The Worst-case execution time (WCET) measured for
the active states was around 240ms.
Interface
nRF52840_DK
OnePlanet
sensor box
Prototype
APDS-9960
Ajfalcon
Figure 5: OnePlanet sensor box (left) and Prototype (right).
The prototype was interfaced with an air qual-
ity sensor from OnePlanet (Hofman et al., 2022), as
shown in Figure 5. It consists of air quality monitor-
ing sensors, a solar panel, a rechargeable lithium bat-
tery (J & A, 2022), a power management board, a pro-
cessing and control unit from Arduino with onboard
transceiver from uBlox, which is a LTE Cat M1 / NB1
and EGPRS cellular module to transmit the measure-
ments at least once every 60 minutes. With our pro-
totype, it was required to transmit a measurement at
least once every 15 minutes i.e. to increase the per-
formance by four times. The flow of the prototype’s
firmware is shown in Figure 6. Function 2 (cf. Sec-
tion 3.2.3) shown in Figure 2 is invoked to accumulate
enough harvested energy only when the battery volt-
age is within its upper limit (4.1 V) and lower limit
(3.3 V), which approximately marks the 100% and
30% states of charge, respectively (J & A, 2022). The
last 30% of the battery is utilized as a reserve for han-
dling worst-case and unexpected scenarios. Even dur-
ing normal operation, it is not recommended to reach
100% depth of discharge, as it stresses the battery and
worsens the cycle life (Battery University, 2022) and
can cause the battery management system (BMS) to
shutdown the power output. If the battery voltage is
greater than the upper limit, it means enough energy
is already available and can execute the next task.
When battery voltage is below the lower limit, no
task is executed and voltage is rechecked after a pre-
defined period. WCET and Worst-case energy con-
sumption (WCEC) of the tasks executed on the One-
Planet sensor box were not readily available but they
are required to calculate the sample period and en-
ergy required in Function 2 (cf. Fig. 2). Hence, the
WCET and WCEC of the tasks were measured using
the Joulescope and the measurements are tabulated
in Table 3. During sleep, the OnePlanet box con-
sumes around 4.8mW at 3.29V. The execution time
was calculated based on the energy consumption pat-
tern. The worst case energy consumption is set as
0.13J for measurement and 14J for transmission (Tx),
Table 2: Electrical parameters of Prototype.
Scenario / Task Power Voltage
Sleep (timer0) 0.9mW 3.29
Active max. (timer0) 1.5mW 3.29
Sleep (rtc0) 35µW 3.29
Active max. (rtc0) 600µW 3.29
Initialize the timer,
ADC and I2C
peripherals
Reset the
I2C bus and
the sensor
Collect
minimum
data for
prediction
Read the
battery
voltage
Battery
voltage
greater than
upper limit
?
Battery
voltage
within limits ?
Predict the
wait time
(Function 2)
Wait for the
predefined
period when
battery voltage
is below lower
limit
Update the
data for
prediction
Update the
data for
prediction
Update the
data for
prediction
Wait for the
predicted
period
Update
the next
task
Wait for the task
completion, while
updating the data
for prediction
Interrupt
ext. app for
next task
execution
Yes
No
No
Yes
Figure 6: Flowchart of the prototype firmware.
which includes some overhead to account for its con-
sumption during sleep and operation of the prototype.
4.1 Time Management
The sample period used by the prediction model was
used to discretize the time domain and eliminate the
complexity involved in calculating the time in the
continuous time domain. Hence, all the execution
times and wait times used by the firmware of the pro-
totype of EMU are quantized with the quantum set as
the sample period (SP). This quantization of time do-
main can also reduce the number of wake-ups, cer-
tain routines and associated overheads by synchro-
nizing the events to the points in the discrete time
domain and therefore reducing the energy required.
To increase the efficient utilization of the harvested
energy, the device should be capable of executing
tasks consecutively without delay. Hence, an aver-
age execution time of 61.8s, obtained from Table 3
for both the Tx and measurement tasks in the One-
Planet sensor box, is considered for the sample pe-
riod; i.e., 61.8s is halved and rounded to 30s is used
as the sample period (1SP = 30s) by this prototype as
it provides fine-grained control over the time domain
during event scheduling. Lowering the sample period
further might provide even finer control but increases
the prediction overhead by increasing the iterations
required to solve for w in Equation 2, sensor on-time,
etc., thereby increasing the energy consumption as the
sample period decreases.
Based on Table 3, the execution time for a mea-
An Energy Management Unit for Predictive Solar Energy Harvesting IoT
45

surement task is fixed as 1SP and the Tx task is fixed
at 5SP and together they take 6SP; i.e., 3 minutes.
As there is a requirement to transmit at least every
15 minutes or 30SP, the maximum waiting period
affordable is 24SP, which is the maximum predic-
tion horizon used during evaluation by limiting the
maximum value for w as 24 in Equation 2 during
the evaluation. The maximum prediction horizon of
24SP(12 minutes) falls under very short to short pre-
diction horizon. Since the sample period is the time
slot period, the oldest data possibly required by the
model would be sample period times the maximum
number of lag values possibly required (cf. Section
3.2): i.e., 30s × 20 = 10 minutes.
4.2 Novel Interface
The interface of the prototype of EMU consists of
three parts, as shown in Figure 1. One is to power
our prototype, another to measure the voltage of the
reservoir, and the third one is responsible for com-
munication between the prototype and the third-party
device. Currently, the communication between our
prototype and the third-party device is done through
edge-triggered interrupts (one per task). Only a minor
firmware adaption was required in the third-party de-
vice to replace its old timer-based logic with interrupt-
based triggers, which enables the device to receive
alerts from our prototype when there is enough energy
to measure or Tx. The current prototype can be in-
terfaced to third-party devices with only solar panels
as energy harvesters. From the current SotA EH-IoT
systems, we couldn’t identify a similar interface for
decoupling EMU from the rest of the system. Hence
we consider this interface to be novel.
5 OBSERVATION AND
DISCUSSION
An APDS-9960 light sensor was configured to oper-
ate with the value of 192
10
in its ADC integration time
(ATIME) register during the experiment. This causes
the sensor to achieve maximum resolution of the ir-
radiance measurement equivalent to a 16-bit ADC
with the maximum count value of 65535
10
, which
takes almost 178ms of the execution time during the
active states of the prototype of EMU. By chang-
ing the ATIME register value to 255
10
, it only takes
2.78ms to conduct a measurement and the maximum
count value will be lowered to 1025
10
. Meanwhile
the active state’s WCET is reduced to around 14.3 ms
with approximate power consumption of 2mW. This
can significantly shorten the maximum energy con-
sumption during an active state from around 144µJ
to around 29µJ at the expense of the measurement’s
resolution.
The solar irradiance’s trend can be roughly de-
duced with the battery voltage data available from the
third-party backend server. As shown in Figure 7, it
hits the maximum value and remains constant around
the afternoon, when the solar irradiance is usually
high relative to the rest of the day. The number of
Tx and measurements along with the battery voltage
for a single day (12-05-2022) is shown in Figure 7
with respect to time. Red bars indicate the number
of Tx of the standalone third-party device, whereas
green bars show the number of Tx when our prototype
is plugged in. The standalone third-party device was
programmed by the third-party to make 1 Tx every
hour by default. The experiment was conducted on a
sundeck facing north-east for 63 hours, between 11
th
to 13
th
of May, 2022 at Antwerp (Belgium). Hence,
the standalone third-party device would have made 63
Tx. After plugging in our prototype to this device, we
were able to achieve 694 Tx, which is an eleven-fold
increase in Tx rate. Even if the default Tx rate was in-
creased to the minimum observed rate of 6 Tx every
hour, the performance improvement achieved would
be around 80% increase in Tx rate. This can be at-
tributed to EATS’s dynamic optimization of the Tx
rate compared to a constant Tx rate, as evident from
Figure 7, for devices that use unintentional ambient
power sources. Due to the cyclic nature of the sched-
uler, 1 Tx and measurement constantly consumes 8
active states, each consuming a maximum of around
144µJ (cf. Section 4 and Table 2). With the RTC for
time keeping, the energy consumed by the prototype
during the experiment would have been around 3.32J
per day (3.01J per day in sleep and around 0.31J per
day in active state).
Overall, the battery voltage did not show a de-
creasing trend during evaluation. This means the bat-
tery’s state of charge is regularly replenished despite
the increase in the operation rate, which can be at-
tributed to the third-party device’s dynamic adaption
to the harvestable energy due to the addition of the
prototype. It also means that the system is now capa-
ble of detecting excess available energy, which can be
effectively used by the third-party device for improv-
ing its quality of service (QoS) (Shafique et al., 2020)
and energy efficiency. However, a decreasing trend in
the battery voltage could have been noticed if the so-
lar panel had lower panel wattage rating or the battery
had lesser capacity, which opens the door for further
optimization.
The number of analog inputs required by the pro-
totype for measuring the voltage at energy reser-
IoTBDS 2023 - 8th International Conference on Internet of Things, Big Data and Security
46
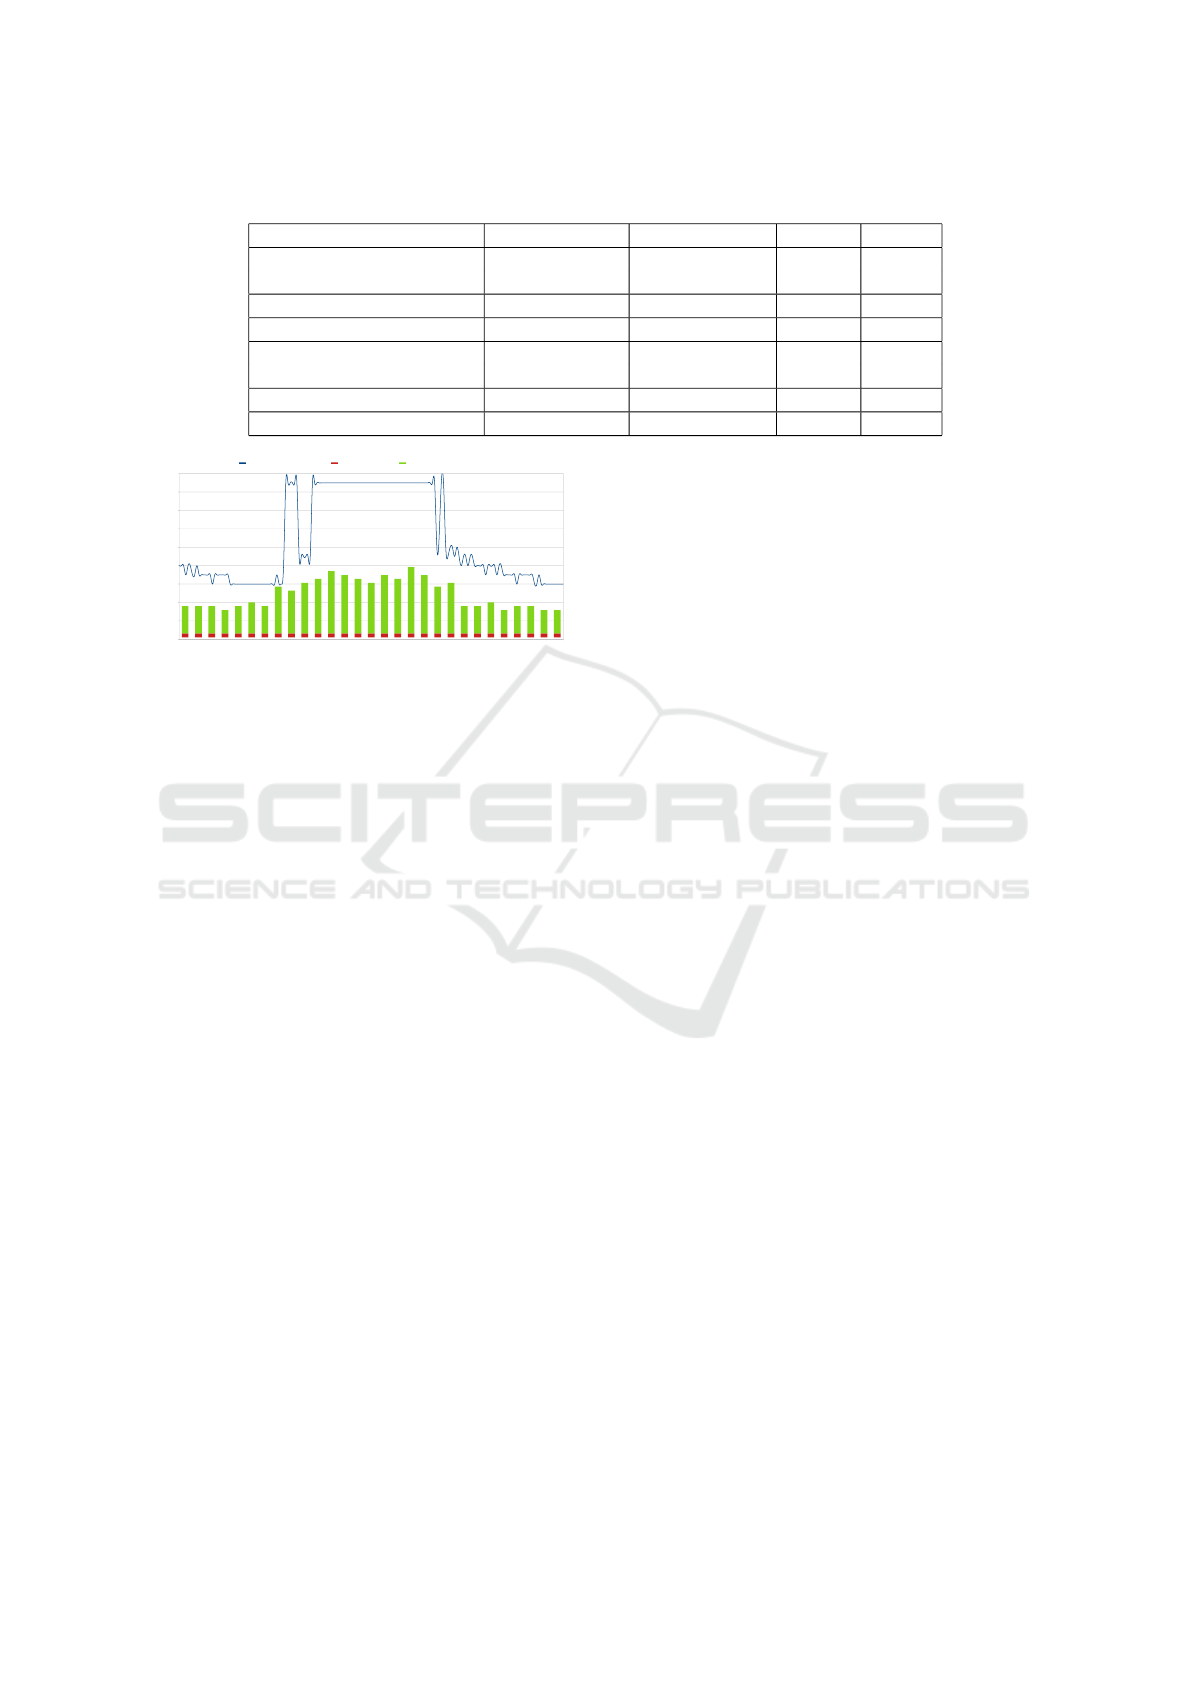
Table 3: Electrical parameters of OnePlanet sensor box.
Scenario / Task Execution time Electric current Voltage Charge
Boot (connection timeout)
69 s 65 mA 4.95 V 4.5 C
80 s 36 mA 3.29 V 3 C
Boot (connected) 40 s 86 mA 4.17 V 3.4 C
1 measurement 1.75 s 14.2 mA 4.17 V 25 mC
(1 measurement) Tx failed
125 s - 3.29 V 2.42 C
71 s - 4.17 V 1.13 C
(0 measurement) Tx 31 s 88 mA 4.17 V 2.73 C
(1 measurement) Tx 80.25 s 41 mA 4.17 V 3.3 C
2022
-0
5-
1
2
00
:
0
6
:
5
5
2
02
2-
0
5
-12
0
0
:
2
5
:1
3
20
2
2-
0
5-
1
2
00
:
4
3:
3
0
2
0
2
2
-
0
5
-1
2
01
:1
0
:56
20
2
2
-05
-12
0
1
:
2
6:
10
2
02
2-
0
5-1
2
01
:
4
4:
2
7
202
2-
0
5
-
1
2
0
2:
0
2
:4
5
2
0
2
2
-0
5
-12
02
:
2
1:
0
3
2
0
2
2
-
0
5-
1
2
02
:3
9:
2
1
2
02
2-
0
5
-12
0
3
:
0
6:
48
2
02
2-
0
5
-
1
2
0
3
:
2
5:
05
202
2-
05-1
2
03
:4
3
:24
20
2
2
-05
-12
0
4
:
1
0:
51
2022
-0
5-
12
04
:
2
9:
0
8
2
0
22
-
0
5
-
12
0
4
:
4
7:
26
20
22
-
0
5
-
12
0
5
:
0
5
:4
4
2
0
2
2-
05
-1
2
05
:2
3:
3
3
20
2
2
-05
-12
0
5
:4
0
:
15
2
02
2
-05
-12
0
6
:
0
6:
38
20
22
-
0
5-
1
2
0
6
:
2
6:
1
5
2
0
2
2
-
0
5
-1
2
0
6:
3
9
:20
2
0
2
2
-0
5-
1
2
07
:
0
6:
3
0
2022
-0
5-1
2
07
:
1
6:
3
5
20
2
2-
0
5
-12
0
7
:
2
6
:3
9
20
2
2-
0
5-
1
2
08
:
0
6:
2
7
2
0
2
2
-
0
5-
12
08
:2
0:
0
4
2
02
2
-05
-12
0
8
:
2
9:
08
2022
-0
5
-
1
2
0
9
:
0
3:
2
4
202
2-
05-1
2
0
9
:1
1
:58
2
0
2
2
-0
5-
1
2
09
:
2
1:
0
2
2022
-0
5-
1
2
10
:
0
5
:
5
3
2
02
2-
0
5
-12
1
0
:
1
4
:5
8
20
2
2-
0
5-
1
2
10
:
2
4:
0
2
2
0
2
2
-
0
5
-1
2
11
:0
4
:52
20
2
2
-05
-12
1
1
:
1
2:
26
2
02
2-
0
5-1
2
11
:
2
0:
3
0
202
2-
0
5
-
1
2
1
2:
0
2
:5
0
2
0
2
2
-0
5
-12
12
:
1
0:
5
4
2
0
2
2
-
0
5-
1
2
12
:1
8:
5
7
2
02
2-
0
5
-12
1
3
:
0
5:
18
2
02
2-
0
5
-
1
2
1
3
:
1
2:
51
202
2-
05-1
2
13
:2
0
:25
20
2
2
-05
-12
1
4
:
0
2:
43
2022
-0
5-
12
14
:
1
0:
1
6
2
0
22
-
0
5
-
12
1
4
:
1
8:
20
20
22
-
0
5
-
12
1
5
:
0
4
:3
9
2
0
2
2-
05
-1
2
15
:1
2:
1
3
20
2
2
-05
-12
1
5
:1
9
:
46
2
02
2
-05
-12
1
6
:
0
2:
34
20
22
-
0
5-
1
2
1
6
:
1
0:
3
8
2
0
2
2
-
0
5
-1
2
1
6:
1
7
:11
2
0
2
2
-0
5-
1
2
17
:
0
5:
0
4
2022
-0
5-1
2
17
:
1
2:
3
7
20
2
2-
0
5
-12
1
7
:
2
0
:4
0
20
2
2-
0
5-
1
2
18
:
0
3:
0
0
2
0
2
2
-
0
5-
12
18
:1
0:
3
3
2
02
2
-05
-12
1
8
:
1
7:
36
2022
-0
5
-
1
2
1
9
:
0
5:
5
6
202
2
-
0
5-
1
2
1
9
:1
7
:31
2
0
2
2
-0
5-
1
2
19
:
2
5:
3
5
2022
-0
5-
1
2
20
:
0
4
:
2
2
2
02
2-
0
5
-12
2
0
:
1
2
:2
5
20
2
2-
0
5-
1
2
20
:
1
8:
5
9
2
0
2
2
-
0
5
-1
2
21
:0
6
:17
20
2
2
-05
-12
2
1
:
1
9:
21
2
02
2-
0
5-1
2
21
:
3
5:
3
3
202
2-
0
5
-
1
2
2
2:
1
0
:3
2
2
02
2
-
0
5
-
12
2
2
:
2
5
:4
6
2
0
2
2-
05
-12
22
:4
4:
0
4
2
0
22-
0
5
-12
2
3
:1
1
:
30
2
02
2
-05
-12
2
3
:
2
6:
45
20
2
2-
05-1
2
23
:
4
5:
0
2
2
0
2
2
-
0
5-
13
0
0:
0
6
:21
202
2
-0
5-
13
00
:
2
1:
3
6
2
0
22
-0
5
-
1
3
00
:
3
9:
5
3
20
2
2-
0
5
-13
0
1
:
0
7
:2
0
2
0
2
2-
05
-1
3
01
:
2
2:
3
4
2
0
2
2
-
0
5-
1
3
01
:4
0
:
5
2
2
02
2
-05
-13
0
2
:
0
8:
19
20
22
-0
5
-
1
3
0
2
:
2
6:
37
2
0
2
2-
0
5
-1
3
0
2:
4
4
:55
2
0
2
2
-0
5-
1
3
03
:
0
3:
1
3
2022
-0
5-
1
3
03
:
2
1:
3
1
20
2
2-
0
5
-13
0
3
:
3
9:
49
20
22
-
0
5
-
1
3
0
4
:
0
7
:1
6
2
0
2
2-
05
-1
3
04
:2
5:
3
5
2
0
2
2
-05
-13
0
4
:
43
:5
4
4.04
4.06
4.08
4.1
4.12
4.14
4.16
4.18
4.2
4.22
TIME (HOUR)
VOLTAGE (V)
1 1 1 1 1 1 1 1 1 1 1 1 1 1 1 1 1 1 1 1 1 1 1 1 1 1 1 1 1
7 7 7
6
7
8
7
12
11
13
14
16
15
14
13
15
14
17
15
12
13
7 7
8
6
7 7
6 6
Battery voltage Default Tx Energy aware Tx
00h
12h
00h
Figure 7: Number of Tx by default vs with the prototype.
voir can increase if the third-party device uses multi-
capacitor (Colin et al., 2018) or multi-battery based
power source and could have a dedicated PMU to han-
dle them. In such cases, the prototype is capable of
working with no analog input by leaving the voltage
checks to the third-party device, thus being able to
operate without accessing the electrical data of the en-
ergy reservoirs by always waiting to acquire enough
harvestable energy before executing a task. Currently,
the prototype’s interface requires one interrupt pin per
task. Hence, increasing the number of tasks will in-
crease the number of connections between the proto-
type and the third-party device. With this first imple-
mentation, there is no feedback when a task is exe-
cuted. It is assumed to be executed after the WCET.
Both these issues could be solved in the future using
a standard communication protocol.
Energy harvested from unintentional ambient
power sources can be difficult to monitor in an
EH-IoT device deployed in a real environment, as
conventional methods can be expensive in terms of
energy. Harvested energy can be calculated by di-
rectly measuring the harvester power and integrating
it with the sample period. Directly measuring power
requires measuring voltage and electrical current, but
the overheads can negate the overall benefit. For in-
stance, using a shunt resistor-based passive electri-
cal current measurement design consumes energy in
and of itself, depending on the design and the resis-
tor value. Another issue with direct power measure-
ment is the access to the PMU. When plugging into
third-party devices, this might not be easily possible.
Even if possible, some PMUs (e-peas, 2022b; e-peas,
2022a) uses V
ocv
of the solar panel to calculate the op-
erating maximum power point voltage (V
mpp
). Hence,
synchronization is required so that direct power mea-
surements aren’t made when the PMU is measuring
V
ocv
, which might require changing the PMU’s con-
figuration, the interface and our prototype’s firmware
depending on the exact PMU used by the third-party
device. Otherwise, the PMU’s V
ocv
measurement pro-
cess can distort the direct power measurement causing
its value to plummet to zero as the circuit is effectively
broken during a V
ocv
measurement.
In order to mitigate the disadvantages of the direct
power measurement and, as solar panels were the only
energy harvester being considered in this experiment,
we used the light sensor to measure the incoming light
energy in terms of irradiance (cf. Section 3.2.3). Us-
ing a separate sensor eliminates the need for tinker-
ing with the PMUs of third-party devices and results
in a more independent interface. It allows us to dis-
able this sensor when not in use or when the energy
is low. The accuracy trade-off between directly mea-
sured and sensor-estimated panel wattage was studied
using the custom dataset and was found to have an
RMSE of 1.22mW, which is an order of magnitude
less than the average operating range during daytime,
as shown in Figure 4d (cf. Section 3.2.3), with raw
solar irradiance data plotted in blue for reference.
6 CONCLUSION AND FUTURE
WORK
We proposed a novel interface that brings energy
awareness with ARIMA based short-term energy
forecasting to non-energy aware EH-IoT devices and
demonstrated its feasibility using OnePlanet sensor
box. Our real world experiments with this system
showed that the overall dynamically optimized Tx
rate outperforms constant Tx rate based solution (cf.
Section 5) and the efficient utilization of the harvested
An Energy Management Unit for Predictive Solar Energy Harvesting IoT
47

energy could be maximized, when compared to its
standalone state. Instead of only increasing the Tx
rate, the Tx power of the third-party device can also
be increased with the prototype of EMU, which, can
be more beneficial for exceedingly remote and indoor
deployments. The prototype’s ability to operate in-
dependently of the type of energy reservoir(s), and
its ability to operate without retraining the prediction
model even when the third-party device parameters
change enable easy adaptation. During the evalua-
tion period, the total energy overhead of our proto-
type (not just the prediction) built with commercial-
off-the-shelf (COTS) components was estimated to
be around 3.32J per day, with the majority of it con-
sumed during sleep. This can be reduced by using
more intentionally designed hardware (Zhang et al.,
2011) and software. Future experiments for research
purposes will benefit from increased evaluation peri-
ods, analyzing the impact of location and orientation
of the third-party device, and adding an externally
powered data acquisition (DAQ) system to monitor
the environmental and in-system parameters affecting
the system operation. It is also required to analyze
the drift in the outputs from system components such
solar panel, light sensor, PMU, etc., due to ageing or
other factors and take these into account. In addition,
the effect of spectral sensitivity on the error between
measured and sensor-estimated panel Wattage needs
to be analyzed.
ACKNOWLEDGEMENTS
Part of this research was funded by the Flemish FWO
SBO S001521N IoBaLeT (Sustainable Internet of
batteryless Things) project.
REFERENCES
Anagnostou, P., Gomez, A., Hager, P., Fatemi, H.,
de Gyvez, J. P., Thiele, L., and Benini, L. (2018). Tor-
por: A power-aware hw scheduler for energy harvest-
ing iot socs. In 2018 28th International Symposium on
Power and Timing Modeling, Optimization and Simu-
lation (PATMOS), pages 54–61.
Anuj Justus (2022). Custom dataset collected for energy
manager. https://doi.org/10.5281/zenodo.7044952.
Anuj Justus Rajappa (2022a). Build a long-term
daq system (part 1): The hardware design.
https://circuitcellar.com/research-design-hub/march-
circuit-cellar-sneak-preview-2022/. Last checked on
Aug 19, 2022.
Anuj Justus Rajappa (2022b). Build a long-term
daq system (part 2): The software design.
https://circuitcellar.com/research-design-hub/april-
circuit-cellar-sneak-preview-2022/. Last checked on
Aug 31, 2022.
Aosong Electronics Co.,Ltd (2022). Dht22 (dht22 also
named as am2302). https://www.sparkfun.com/
datasheets/Sensors/Temperature/DHT22.pdf. Last
checked on Aug 31, 2022.
Babayo, A. A., Anisi, M. H., and Ali, I. (2017). A review
on energy management schemes in energy harvesting
wireless sensor networks. Renewable and Sustainable
Energy Reviews, 76:1176–1184.
Battery University (2022). Bu-808: How to prolong
lithium-based batteries. https://batteryuniversity.
com/article/bu-808-how-to-prolong-lithium-based-
batteries. Last checked on Aug 19, 2022.
Bergonzini, C., Brunelli, D., and Benini, L. (2009). Al-
gorithms for harvested energy prediction in battery-
less wireless sensor networks. In 2009 3rd Interna-
tional Workshop on Advances in sensors and Inter-
faces, pages 144–149.
Bhusal, H., Khatiwada, P., Jha, A., Soumya, J., Koorapati,
S., and Cenkeramaddi, L. R. (2020). A self-powered
long-range wireless iot device based on lorawan. In
2020 IEEE International Symposium on Smart Elec-
tronic Systems (iSES) (Formerly iNiS), pages 242–
245.
BROADCOM (2022). Apds-9960. https://www.broadcom.
com/products/optical-sensors/integrated-ambient-
light-and-proximity-sensors/apds-9960. Last
checked on Aug 18, 2022.
Cammarano, A., Petrioli, C., and Spenza, D. (2012). Pro-
energy: A novel energy prediction model for solar and
wind energy-harvesting wireless sensor networks. In
2012 IEEE 9th International Conference on Mobile
Ad-Hoc and Sensor Systems (MASS 2012), pages 75–
83.
Cammarano, A., Petrioli, C., and Spenza, D. (2016). Online
energy harvesting prediction in environmentally pow-
ered wireless sensor networks. IEEE Sensors Journal,
16(17):6793–6804.
Chetto, M. and Queudet, A. (2016). 3 - harnessing ambi-
ent energy for embedded systems. In Chetto, M. and
Queudet, A., editors, Energy Autonomy of Real-Time
Systems, pages 57–83. Elsevier.
Colin, A., Ruppel, E., and Lucia, B. (2018). A re-
configurable energy storage architecture for energy-
harvesting devices. SIGPLAN Not., 53(2):767–781.
Deb, M. and Roy, S. (2021). Enhanced-pro: A new en-
hanced solar energy harvested prediction model for
wireless sensor networks. Wireless Personal Commu-
nications, 117(2):1103–1121.
Dehwah, A. H., Elmetennani, S., and Claudel, C. (2017).
Ud-wcma: An energy estimation and forecast scheme
for solar powered wireless sensor networks. Journal
of Network and Computer Applications, 90:17–25.
Delgado, C. and Famaey, J. (2021). Optimal energy-
aware task scheduling for batteryless iot devices.
IEEE Transactions on Emerging Topics in Computing,
pages 1–1.
IoTBDS 2023 - 8th International Conference on Internet of Things, Big Data and Security
48

e-peas (2022a). Aem10330 solar energy harvesting. https://
e-peas.com/wp-content/uploads/2021/08/Datasheet
AEM10330 solar energy harvesting IC REV1.1.pdf.
Last checked on Aug 18, 2022.
e-peas (2022b). Aem10941 solar energy harvesting.
https://e-peas.com/wp-content/uploads/2021/03/e-
peas-AEM10941-datasheet-energy-harvesting.pdf.
Last checked on Aug 18, 2022.
Hamers, R. J. (2020). Energy storage materials as emerg-
ing nano-contaminants. Chemical Research in Toxi-
cology, 33(5):1074–1081. PMID: 32275142.
Hofman, J., Nikolaou, M., Shantharam, S. P., Stroobants,
C., Weijs, S., and La Manna, V. P. (2022). Distant
calibration of low-cost pm and no2 sensors; evidence
from multiple sensor testbeds. Atmospheric Pollution
Research, 13(1):101246.
Huybrechts, T., Reiter, P., Mercelis, S., Famaey, J., Latr
´
e,
S., and Hellinckx, P. (2021). Automated testbench
for hybrid machine learning-based worst-case energy
consumption analysis on batteryless iot devices. En-
ergies, 14(13).
J & A (2022). J & a electronics li-ion cyclindrical data
sheet. https://www.olimex.com/Products/Power/
BATTERY-LIPO2200mAh/resources/JA18650-3.7V-
2200mAh-Cell-Specification-150112.pdf. Last
checked on Aug 19, 2022.
Jetperch (2022). Joulescope. https://www.joulescope.com/.
Last checked on Aug 31, 2022.
Ji, W., Chan, C., Loh, J., Choo, F., and Chen, L. (2009).
Solar radiation prediction using statistical approaches.
In 2009 7th International Conference on Informa-
tion, Communications and Signal Processing (ICICS),
pages 1–5.
Kang, D. H. P., Chen, M., and Ogunseitan, O. A. (2013).
Potential environmental and human health impacts
of rechargeable lithium batteries in electronic waste.
Environmental Science & Technology, 47(10):5495–
5503. PMID: 23638841.
Kansal, A., Hsu, J., Zahedi, S., and Srivastava, M. B.
(2007). Power management in energy harvesting sen-
sor networks. ACM Trans. Embed. Comput. Syst.,
6(4):32–es.
Khanna, A., Mueller, T., Stangl, R. A., Hoex, B., Basu,
P. K., and Aberle, A. G. (2013). A fill factor loss
analysis method for silicon wafer solar cells. IEEE
Journal of Photovoltaics, 3(4):1170–1177.
Kjellby, R. A., Cenkeramaddi, L. R., Frøytlog, A., Lozano,
B. B., Soumya, J., and Bhange, M. (2019). Long-
range & self-powered iot devices for agriculture &
aquaponics based on multi-hop topology. In 2019
IEEE 5th World Forum on Internet of Things (WF-
IoT), pages 545–549.
Kjellby, R. A., Cenkeramaddi, L. R., Johnsrud, T. E.,
Løtveit, S. E., Jevne, G., Beferull-Lozano, B., and
Soumya, J. (2018). Self-powered iot device based
on energy harvesting for remote applications. In
2018 IEEE International Conference on Advanced
Networks and Telecommunications Systems (ANTS),
pages 1–4.
Kosunalp, S. (2016). A new energy prediction algorithm
for energy-harvesting wireless sensor networks with
q-learning. IEEE Access, 4:5755–5763.
Muhammad, Qureshi, H. K., Saleem, U., Saleem, M., Pit-
sillides, A., and Lestas, M. (2017). Harvested en-
ergy prediction schemes for wireless sensor networks:
Performance evaluation and enhancements. Wireless
Communications and Mobile Computing, 2017.
Noh, D. K. and Kang, K. (2011). Balanced energy al-
location scheme for a solar-powered sensor system
and its effects on network-wide performance. Jour-
nal of Computer and System Sciences, 77(5):917–932.
PMECT 2009/ICCCN 2009.
Nordic Semiconductor (2022). nrf52840 dk.
https://www.nordicsemi.com/Products/Development-
hardware/nrf52840-dk. Last checked on Aug 18,
2022.
Ramson, S. R. J., Le
´
on-Salas, W. D., Brecheisen, Z., Fos-
ter, E. J., Johnston, C. T., Schulze, D. G., Filley, T.,
Rahimi, R., Soto, M. J. C. V., Bolivar, J. A. L., and
M
´
alaga, M. P. (2021). A self-powered, real-time, lo-
rawan iot-based soil health monitoring system. IEEE
Internet of Things Journal, 8(11):9278–9293.
Recas Piorno, J., Bergonzini, C., Atienza, D., and Simu-
nic Rosing, T. (2009). Prediction and management
in energy harvested wireless sensor nodes. In 2009
1st International Conference on Wireless Communi-
cation, Vehicular Technology, Information Theory and
Aerospace & Electronic Systems Technology, pages 6–
10.
Rodriguez Arreola, A., Verykios, T. D., Gurrola Navarro,
M. A., and Calvillo Cortes, C. F. (2022). Federated
time persistency in intermittently powered iot sys-
tems. Journal of Systems Architecture, 130:102667.
Sabovic, A., Sultania, A. K., Delgado, C., De Roeck, L.,
and Famaey, J. (2022). An energy-aware task sched-
uler for energy harvesting battery-less iot devices.
IEEE Internet of Things Journal.
Seed Studio (2022). Small solar panel 81x137mm
1.5w. https://www.seeedstudio.com/1-5W-Solar-
Panel-81X137.html. Last checked on Nov 18, 2022.
Shafik, R., Yakovlev, A., and Das, S. (2018). Real-
power computing. IEEE Transactions on Computers,
67(10):1445–1461.
Shafique, K., Khawaja, B. A., Sabir, F., Qazi, S., and Mus-
taqim, M. (2020). Internet of things (iot) for next-
generation smart systems: A review of current chal-
lenges, future trends and prospects for emerging 5g-
iot scenarios. IEEE Access, 8:23022–23040.
Shaikh, F. K. and Zeadally, S. (2016). Energy harvest-
ing in wireless sensor networks: A comprehensive re-
view. Renewable and Sustainable Energy Reviews,
55:1041–1054.
Stricker, N. and Thiele, L. (2022). Accurate onboard pre-
dictions for indoor energy harvesting using random
forests. In 2022 11th Mediterranean Conference on
Embedded Computing (MECO), pages 1–6.
Tanha, S. N., Mim, S. A., Roy, P., and Razzaque, M. A.
(2021). Prediction of energy harvesting in solar pow-
ered small cells networks. In 2021 3rd International
An Energy Management Unit for Predictive Solar Energy Harvesting IoT
49

Conference on Sustainable Technologies for Industry
4.0 (STI), pages 1–6.
Taylor G. Smith (2022). pmdarima. https://github.com/
alkaline-ml/pmdarima. Last checked on Aug 30,
2022.
Texas Instruments (2022). Ina226 high-side or low-side
measurement,bi-directional current and power moni-
tor with i2c compatible interface. https://www.ti.com/
lit/ds/symlink/ina226.pdf. Last checked on Aug 18,
2022.
University of Washington (2022). Physics of solar
cells. https://depts.washington.edu/cmditr/modules/
opv/physics of solar cells.html. Last checked on
Nov 20, 2022.
Wahba, M. A., Ashour, A. S., and Ghannam, R. (2020). Pre-
diction of harvestable energy for self-powered wear-
able healthcare devices: Filling a gap. IEEE Access,
8:170336–170354.
Yamin, N. and Bhat, G. (2021). Online solar energy predic-
tion for energy-harvesting internet of things devices.
In 2021 IEEE/ACM International Symposium on Low
Power Electronics and Design (ISLPED), pages 1–6.
Yue, H., Worrell, E., and Crijns-Graus, W. (2021). Impacts
of regional industrial electricity savings on the devel-
opment of future coal capacity per electricity grid and
related air pollution emissions – a case study for china.
Applied Energy, 282:116241.
Zhang, Y., Shakhsheer, Y., Barth, A. T., Powell Jr., H. C.,
Ridenour, S. A., Hanson, M. A., Lach, J., and Cal-
houn, B. H. (2011). Energy efficient design for body
sensor nodes. Journal of Low Power Electronics and
Applications, 1(1):109–130.
IoTBDS 2023 - 8th International Conference on Internet of Things, Big Data and Security
50
