
Analysis of Security Events in Industrial Networks Using
Self-Organizing Maps by the Example of Log4j
Ricardo Hormann
1
, Daniel Bokelmann
2
and Frank Ortmeier
2
1
Volkswagen AG, Wolfsburg, Germany
2
Otto-von-Guericke-University, Faculty of Computer Science, Magdeburg, Germany
Keywords:
Industry 4.0, Cybersecurity, Industrial Networks, Self-Organizing Maps, Log4j.
Abstract:
Concepts such as Industry 4.0 are challenging the IT security of Industrial Control Networks (ICN) due to
growing connectivity with insecure networks, such as corporate networks. Vulnerable devices within the ICN
need to be protected by monitoring tools such as Intrusion Detection Systems (IDS). These tools not only
provide information on suspicious traffic data observed, but also assess the semantics of an attack. Given
the large number of security events generated by these systems, security analysts may overlook important
annotations. This work attempts to leverage semantic annotations in combination with traffic and temporal
information, using unsupervised machine learning methods (Self-Organizing Maps), to facilitate processing
in the Security Operation Center. Instead of handling individual security events, our approach provides groups
of heterogeneous security events leading to prototypical scenarios and classified and reusable use cases that
only need to be analyzed once. We evaluate our approach using a non-synthetic dataset generated on a shop
floor in the automotive sector, focusing on security events related to the Log4j vulnerability.
1 INTRODUCTION
Ours is an interconnected world, and with growing
connectivity, IT-security will yet become more chal-
lenging, with potentially vulnerable devices being
added to the networks daily. One of the emerging
challenges is the exposure of previously isolated In-
dustrial Control Networks (ICN) to wider networks
and therefore a wider Threat Landscape (Knowles
et al., 2015; Schuster et al., 2013) as a byprod-
uct of the adoption of concepts such as Industry 4.0
(Selzer et al., 2020). To add gravity to the situa-
tion, most ICN were originally designed under the as-
sumption that Air Gaps
1
between the trusted network
in the manufacturing environment, i.e. the shopfloor
and its subordinate workshops (Souza et al., 2008),
and any other network would be sufficient. Noto-
rious attacks like Stuxnet (Langner, 2011) or Indus-
troyer (Cherepanov, 2017) have proven this assump-
tion wrong, with such unpredictable threats to indus-
trial assets unlikely to abate in the future (Ant
´
on et al.,
2017; Tuptuk and Hailes, 2018). To mitigate this is-
sue, technical solutions such as firewalls and Intrusion
1
An air gap informally denotes the physical disconnect
between any two given networks or devices.
Detection Systems
2
(IDS) are increasingly adopted,
with the drawback of adding further complexity to the
system landscape.
This work describes an approach geared towards
lessening the strain caused by the requirement of
analysing anomalous occurrences and suspicious be-
haviors as reported by these mitigating systems on IT-
security personnel. More specifically, we strive to fa-
cilitate the manual step of aggregating the Security
Events
3
observed by the various monitoring imple-
ments.
The aggregation is performed in two consecutive
steps. The first layer of the analytic workflow results
in homogeneous Clusters of similar events belonging
to the same semantic
4
class, e.g. port scan or pass-
word guessing events.
These clusters are subsequently combined in the
second layer of the workflow with information about
the network structure and the temporal order of secu-
rity events. The correlation of security events along
these lines results in heterogenous Scenarios, i.e. pat-
2
A type of sensor analysing network packets.
3
Either perceived steps of attacks or occurrences con-
sidered to be violations of applicable security policies.
4
In the common sense of ”meaning”.
Hormann, R., Bokelmann, D. and Ortmeier, F.
Analysis of Security Events in Industrial Networks Using Self-Organizing Maps by the Example of Log4j.
DOI: 10.5220/0011839900003482
In Proceedings of the 8th International Conference on Internet of Things, Big Data and Security (IoTBDS 2023), pages 51-60
ISBN: 978-989-758-643-9; ISSN: 2184-4976
Copyright
c
2023 by SCITEPRESS – Science and Technology Publications, Lda. Under CC license (CC BY-NC-ND 4.0)
51

terns of causally dependent security events of differ-
ent semantic classes constituting an attack.
Ideally, each resulting scenario and all subordinate
events would subsequently have to be manually anal-
ysed just once, yielding a re-usable result applicable
to all instances or Use Cases of the respective sce-
nario. Aggregating security events into use cases of
a known scenario and class before manual analysis
may support security analysts in their daily work of
processing these events more efficiently. We there-
fore consider the proposed concept as a, to the best
of our knowledge, novel approach to the still current
(Sen et al., 2022) challenge of correlating events in
the IT-security domain.
Considering this domain to be highly unpre-
dictable and volatile, we propose to use a technique
from the field of Unsupervised Machine Learning, i.e.
the Self-Organizing Map (SOM), introduced in sec-
tion 2, as a suitable method to assemble clusters (Qu
et al., 2021). Following the introduction of most im-
portant basic concepts, related works relevant to our
proposal are shown in section 3, with our workflow
being subsequently described in section 4. To validate
our approach, we evaluate a prototypical implementa-
tion against a real-world scenario - the Log4j zero-day
exploit (The MITRE Corporation, 2021) and its rever-
berations in a manufacturing shopfloor in section 5.
The conclusions from our findings, as well as future
avenues of research and refinement, are discussed in
section 6.
2 BACKGROUND
To give a broad overview of this specialized field of
application, the fundamental terms, concepts and al-
gorithms are introduced in this section.
2.1 Security Operation Centers
Despite differences in the definition and implementa-
tion of a Security Operation Center (SOC) as a de-
partment, the common strategic goals of the majority
of SOCs are the enhancement of the security status of,
mitigating IT-security risks to and ensuring compli-
ance with regulatory requirements by the respective
overarching organisation (Ross et al., 2018; Vielberth
et al., 2020). To that end, security analysts working in
a given SOC usually employ specialized procedures
for preprocessing, analysis, correlation and triage of
observed security events as well as threat detection
tools, e.g. IDS, to monitor and analyse operations re-
garding IT-security risks.
2.2 IT-Security in Industrial Networks
From an IT-security perspective, the most relevant
aspect of ICN is the marked difference in priori-
ties regarding the security aspects of confidentiality,
integrity and availability of information, commonly
known as the CIA-Triad (Chapple et al., 2018) in con-
trast to office IT (Selzer et al., 2020). The former usu-
ally focus on availability requirements, e.g. reliability
and real-time operability, as non-availability of assets
directly threatens the generation of value in most in-
dustrial environments, with the latter prioritizing con-
fidentiality instead.
In light of such concepts as Industry 4.0, ICNs and
their subordinate Industrial Control Systems, e.g. pro-
grammable logic controllers managing operational
processes, may no longer be assumed to be isolated
and therefore protected by physical circumstance any-
more. Consequently, the emerging security chal-
lenges posed by connecting ICNs to wider networks
and therefore exposing the Network Participants, i.e.
the networked ICS, to a wider threat landscape, need
to be addressed by more sophisticated approaches.
Consequently, establishing a multi-tiered Defense in
Depth by employing mitigating measures like fire-
walls, reverse proxies
5
and IDS has become the state-
of-the-art approach to ensure security (Knapp and
Langill, 2014; Kayan et al., 2022) in lieu of ”air
gaps”. Such approaches furthermore rely on logically
segmented networks to shield the ICS from malicious
activities originating from outside the protected net-
work, and in some cases, from the inside as well.
2.3 Self-Organizing Maps
The self-organizing map or Kohonen map (Koho-
nen, 2001), is a type of single-layer Artificial Neural
Network processing high-dimensional, numerical in-
put vectors, learning their distributions and mapping
them onto the, usually two dimensional, neuron layer.
Metaphorically, the output layer behaves like a dy-
namic, flexible lattice spanning itself over the input
data samples, approximating the latter while attempt-
ing to preserve their similarity relationships and thus
staying faithful to the topology of the input data space
(Kohonen, 2001). To that end, each neuron on a SOM
is modelled as both an adaptable Codebook vector in
the input space and a fixed set of coordinates on the
neuron grid.
The model is inspired by the functionality of the
brain insofar as similar inputs stimulate neurons to
varying degree in a certain region. Conceptually, a
neuron on a SOM’s output layer is selected as the
5
Single points of exit or entry for network traffic.
IoTBDS 2023 - 8th International Conference on Internet of Things, Big Data and Security
52
winner in a competition for each data sample, learn-
ing its representation, subsequently cooperating with
the neurons in its neighbourhood by adjusting these
to the sample to a lesser degree. The extent of this
adaptation is determined by the fixed grid structure,
commonly rectangular or hexagonal (Kohonen et al.,
2014) and the size of the neighbourhood region con-
sidered. This unsupervised machine learning tech-
nique may be considered to be an extension of the
Vector Quantization technique used for compression,
in which input vectors are assigned to a smaller num-
ber of codebook or prototype vectors of the same di-
mensionality, approximating the Continuous Proba-
bility Density Functions of the original signal and
clustering the input vectors in the process (Gersho,
1982).
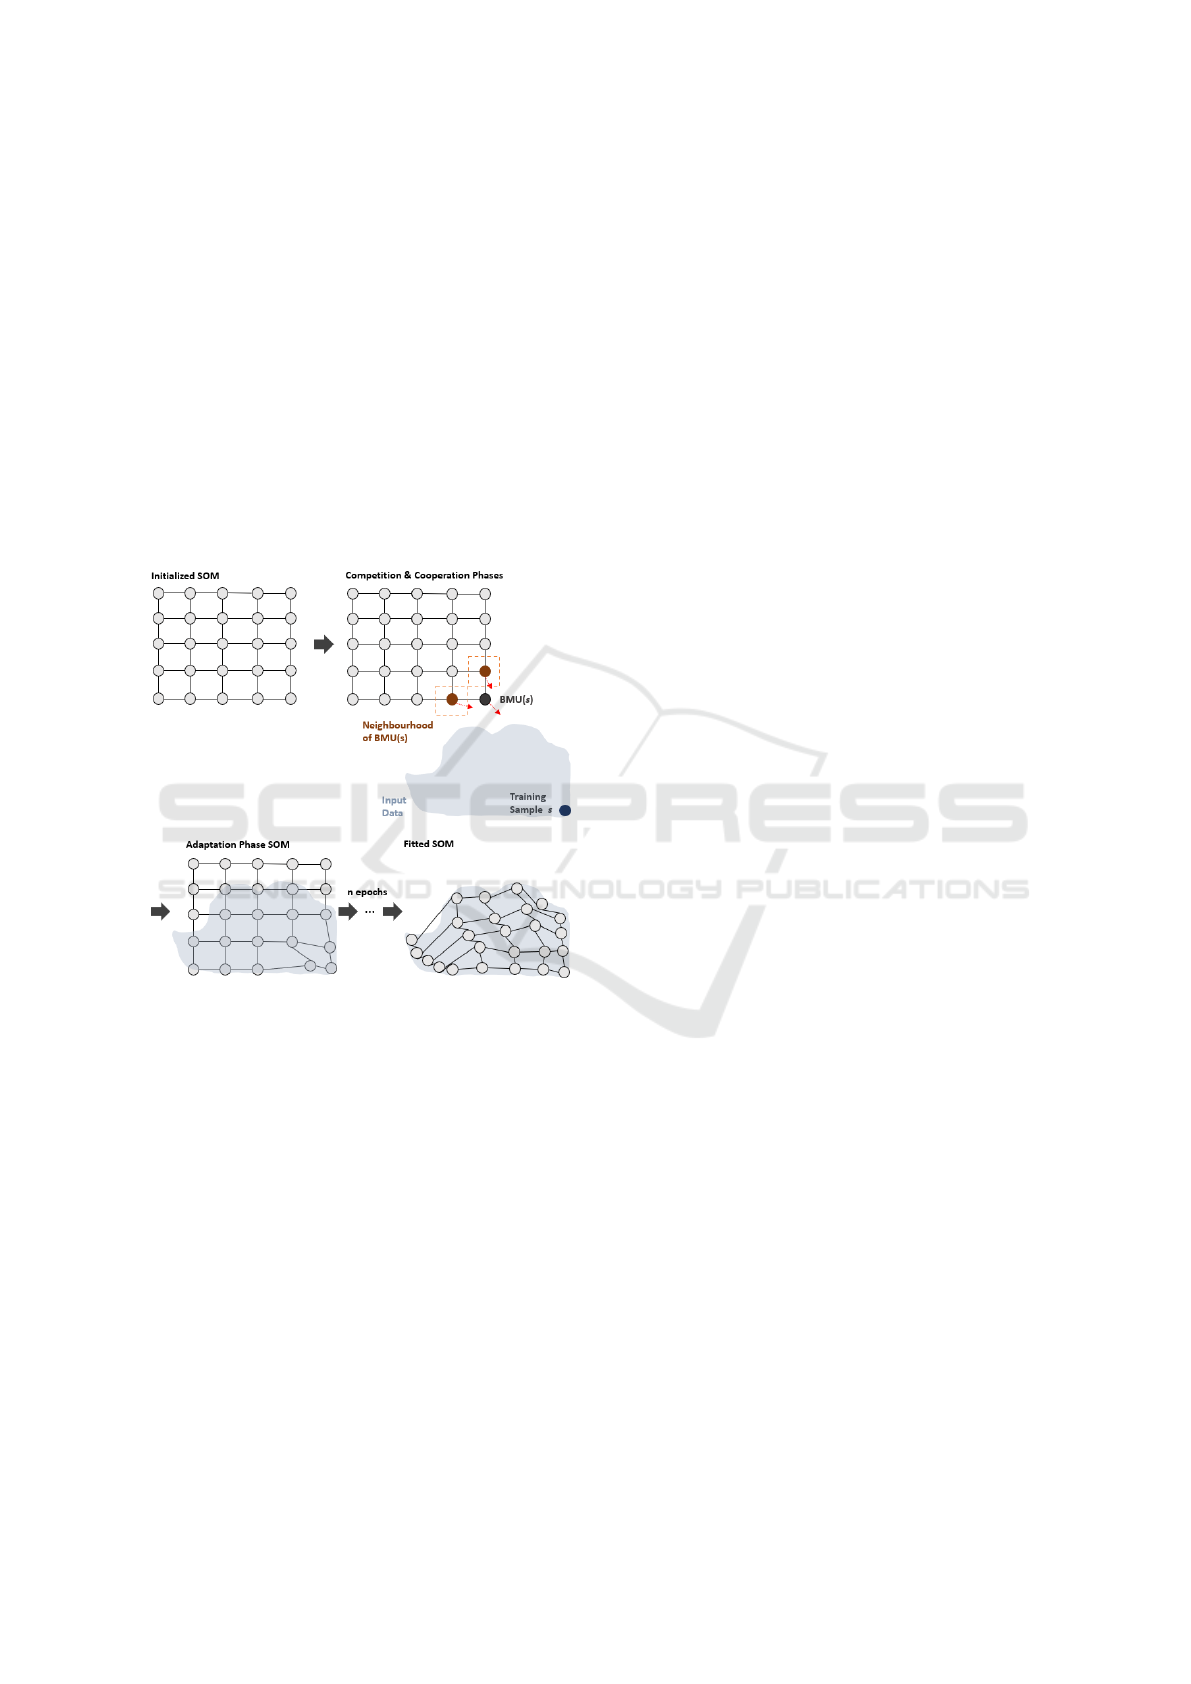
Figure 1: Training of a 5-by-5 SOM. The input data distri-
bution, the codebook vectors and their corresponding neu-
rons on the map are shown, with the input space reduced
to two dimensions for illustrative purposes. Based on (Hor-
mann and Fischer, 2019).
2.3.1 SOM Algorithm
The original algorithm (Kohonen, 2001) is split into
four phases: The Initialization, Competition, Cooper-
ation and Adaptation Phases.
The initialization phase occurs only once per
training run by creating vectors for the codebooks of
a fixed number of neurons, commonly by assigning
values chosen at random or linearly (Kohonen et al.,
2014). In contrast, the following three phases are per-
formed exactly once for each sample of the input data
set as shown in Figure 1 for each of the n iterations or
Epochs.
The competition phase is performed by drawing
a sample s from the input data set, light blue in 1,
at random and by all neurons neurons calculating the
respective distance over all dimensions according to
the chosen distance measure, e.g. the Euclidean Dis-
tance, to the sample. The neuron most similar to the
sample is subsequently identified as the Best Match-
ing Unit (BMU(s)) of the sample.
The cooperation phase is modelled by identifying
the affected region and neighbouring neurons.
The adaptation phase signifies the actual learn-
ing process, with the codebooks of the BMU and its
neighbours being fitted to s. As the codebooks of
the neurons represent their respective coordinates in
the input space, the neurons are actually ”shifted” to-
wards the current sample.
The algorithm terminates after reaching the num-
ber of epochs chosen beforehand.
2.3.2 Preprocessing Textual Data
Security events generated by IDS typically contain
categorical and string attributes (Julisch, 2001), such
as security event description texts or event categories.
Given that SOMs rely on numerical features for
input, we consider the introduction of algorithms
for the transformation of symbolic data by pair-wise
comparison of strings to assess numerical similarity
as a necessity.
Levenshtein
The eponymous algorithm proposed by (Leven-
shtein et al., 1966), also known as Edit-Distance,
is a dynamic programming approach determining
the distance between two strings of symbols by
the minimum number of scored edit-operations,
i.e. insertions, deletions and replacements, giving a
statistically accurate measure of the similarity of two
strings according to Kohonen (Kohonen, 2001).
N-Grams
N-grams were introduced (Shannon, 1948) with
the goal of statistically modelling natural language as
ordered strings of symbols. The basic idea is to split
such a string into fragments, e.g. single characters
or whole words and evaluating these as overlapping
sequences of n fragments, with common sequence
lengths being n = 2 fragments, called Bigrams,
and n = 3, called Trigrams. Several methods exist
to transform n-grams into a numeric measure of
similarity, with the Sørenson-Dice-Coefficient (SDC)
considered to be particularly well-suited for the task
at hand (Aligon et al., 2014). It defines the similarity
of two given strings s
1
and s
2
as twice the number
of shared n-grams over the total number of n-grams
Analysis of Security Events in Industrial Networks Using Self-Organizing Maps by the Example of Log4j
53

in both strings, e.g. the strings ”An example for
trigrams” and ”An example for 3-grams” would yield
two trigrams each and an SDC of 0.5 as both strings
share the trigram ”An example for” if considering
sequences of whole words.
3 RELATED WORK
The proposed approach in Section 4 is, to the best
of our knowledge, a novel concept to support secu-
rity analysts in their daily work of processing security
events by combining aspects of Case-based, Sequen-
tial and Similarity-based Approaches. Inspiration was
drawn from several, previously proposed concepts,
which will be summarized in the following section.
3.1 Case-Based Approaches
Case-based approaches rely on previously identi-
fied scenarios, stored in existing knowledge-bases, to
match new alerts onto. These knowledge-bases are
either based on mining matching rules, on human ex-
pertise, on matching with predefined scenarios or by
inferring rules from a training set with known labels.
(Sadighian et al., 2013) propose an alert fusion ap-
proach, leveraging knowledge ontologies and context
information, e.g. network topology, from multiple
IDS to reduce the number of false positives by em-
ploying a voting mechanism to assess the nature of
the analysed security events. While this approach is
one of the few approaches surveyed using semantic
properties, it requires manually prepared ontologies
to leverage this information.
(Sadoddin and Ghorbani, 2009) propose mining
a growing frequent pattern structure for alert correla-
tion, leveraging association mining to assess the prob-
ability of co-occuring events having the same root
cause.
3.2 Sequential Approaches
Sequential approaches use perceived causal relation-
ships, i.e. multistep sequences, between individ-
ual alerts for correlation purposes. Sequential ap-
proaches can be subdivided into two further subcate-
gories: causal correlation approaches leveraging pre-
/post-conditions, statistical inference or model match-
ing on one hand and structure-based approaches on
the other, working on a model of the network in ques-
tion, such as Correlation Graphs or Bayesian Net-
works (Navarro et al., 2018).
(P
´
erez et al., 2021) propose to combine graph and
temporal information to model the behavior of nodes
in a security context over time. The most interest-
ing concept introduced is the multiplex, i.e. multi-
ple layers of graphs sharing the same vertices but not
the same edges in each temporal layer, modeling the
communication behavior in a network as a snapshot
at different times.
(Haas and Fischer, 2019) follow a mixed ap-
proach, leveraging graph structures to cluster alerts
and interconnect these clustered events being the core
of their proposal. Another differentiating characteris-
tic is that semantic information from source systems
are used for labeling purposes only and no specific
use cases, i.e. attack patterns, are learned.
3.3 Similarity-Based Approaches
Similarity-based approaches aggregate security
events by computing the degree of similarity between
single attributes, e.g. IP addresses, alert descriptions,
or combinations of such attributes of individual
alerts using various similarity measures. The main
assumption for such approaches is that similar alerts
with a similar effect on the affected systems have a
common root cause.
(Smith et al., 2008) propose a method to cluster
alerts in two sequential layers, deliberately forgoing
both source and destination IP addresses as features
to circumvent spoofing and encoding other protocol
information, such as ports or protocol, as features for
the first layer of clustering, while relying on payload
oriented features in the second layer.
(Marchetti et al., 2011) propose a three-step pro-
cess, beginning with hierarchical clustering, proceed-
ing with a SOM and concluding by building correla-
tion graphs.
4 APPROACH
The approach, best described as a similarity-based se-
quential event correlation, is proposed in the follow-
ing sections. An overview of the different steps is
shown in Figure 2.
4.1 Data Acquisition
The first step in our proposed concept is the extrac-
tion of security events from different source systems
with the aim to harmonize them. Extracted events are
harmonized by using a Metamodel, which stands for
a model to unify the semantics and syntax of the raw
security events. While ubiquitous features such as IP-
and MAC-addresses of devices can be considered to
be already harmonized, a lot of other information may
IoTBDS 2023 - 8th International Conference on Internet of Things, Big Data and Security
54

Figure 2: Overview of the proposed approach.
differ due to several formats of different source sys-
tems, e.g. an IDS or firewall.
In the context of our concept a Harmonized Flow,
or simply flow, is a representation of network commu-
nication, necessitated by the different structures ex-
tracted from the heterogenous source systems. The
format of the harmonized flow-tuples implemented
and used in this concept is shown in Table 1. The flow
is an instance of the harmonized attributes defined by
the metamodel.
4.2 Semantic Analysis
In a next step semantics of flows are evaluated to un-
derstand what kind of occurence has been observed.
Many approaches don’t investigate semantic informa-
tion, i.e. categorical and string data, although net-
work monitoring systems, e.g. IDS, can provide a
vast amount of annotated data (Tuptuk and Hailes,
2018). In contrast, we expect to gain useful features
for correlation from Semantic Attributes like descrip-
tion texts, type classifications or names of applica-
ble alert rules. To process these features in an un-
supervised machine learning model, a transformation
of categorical data into numerical features is a pre-
requisite. For achieving the transformation, we use
the methods introduced in 2.3.2: the Levenshtein Edit
Table 1: The definition of the harmonized flow format used
based on the metamodel.
Feature & Example
IP of Destination 172.168.188.129
MAC of Destination 00:4a:23:0c:55:3f
Application Protocol other
Transport Protocol tcp
IP of Source 172.168.188.130
MAC of Source 00:00:e4:00:01:4f
Mitre Attack Tactic Inhibit Response
Function
Mitre Attack
Technique
T0814
Event Type SIGN:TCP-SYN-FLOOD
Threat Name Teradrop
Name of Event Type TCP SYN flood
Timestamp 1970-01-01 00:00:01
Description of Event TCP SYN flood detected
(target 172.168.188.129)
Distance and n-grams. The first method is suitable for
data generated from a finite, fixed set of phrase tem-
plates and thus is considered to be succinct, syntacti-
cally similar and without non-systematic typographi-
cal errors. For string attributes with a more complex
structure, we propose to use n-grams.
The semantic features are used to train a linearly
initialized SOM due to the latter’s dimensionality-
reduction potential and its adaptive nature to com-
press numerical feature vectors. Each one of the re-
sulting prototype vectors, i.e. neurons, describes a Se-
mantic Flow Type. These types are then to be used to
classify the individual harmonized flows by assigning
each of them to their respective best matching seman-
tic flow prototype, i.e. a neuron on the SOM.
4.3 Network Analysis
The next step of harmonized flows are their Commu-
nication Attributes, to establish where in the moni-
tored networks an occurrence was observed. There-
fore, the network participants and their role in the
communication relationship, i.e. either being the
source or the destination of the flow, are taken into
consideration. Any networked device interface in-
cluded in the flows is abstracted as a network partici-
pant by differentiating it using the IP or MAC address
assuming an operational, segmented network environ-
ment.
A Flow Group consolidates harmonized flows
sharing common characteristics to build relationships
between participants of the highest granularity on the
network layer, i.e. the source-destination IP address
pairs. For a lot of non-TCP protocols existing in
Analysis of Security Events in Industrial Networks Using Self-Organizing Maps by the Example of Log4j
55

ICNs, falling back onto the data link layer by using
MAC addresses instead guarantees identification. In
this step, only the physical communication partners
are of interest, semantic attributes or timestamps are
disregarded.
Flow groups and network participants are the ba-
sis for Flow Graphs, which are constructed from all
interlinked flow groups and are based on a notion of a
graph as given by (Henning et al., 2022). A graph is a
finite nonempty set of objects, called vertices (singu-
lar vertex), together with a (possibly empty) set of un-
ordered pairs of distinct vertices, called edges, which
can readily be applied to our notion of flow groups
and network participants, the former constituting the
edges and the latter fitting the definition of vertices
or nodes of the graph. Two flow groups are consid-
ered to be interlinked if they share one network par-
ticipant, irrespective of its role in the flow groups, as
a participant in both flow groups. Therefore, we pro-
pose to partition the layout of the network into one or
several graphs by applying an appropriate algorithm,
such as Breadth-First Search (Henning et al., 2022)
on the flow groups.
4.4 Timestamp Analysis
For taking the when of an occurrence into account,
the temporal order is the third component consid-
ered before aggregation. We propose computing Time
Slices from the respective timestamps of the flows and
thereby assigning each of the flows to a time window
of fixed length, e.g. a single second or minute, rel-
ative to the very first timestamp in the history of the
model. Ordering flows in a temporal sense is key for
modeling co-occurences in our approach.
4.5 Behavior Modeling
In a next step the behavior of the network participants
is modeled as Behavior Subgraphs. A behavior sub-
graph consists of a collection of flow groups in a por-
tion of a graph, observed in a certain time window.
Such a subgraph therefore captures all communica-
tion between a subset of devices of a physical net-
work. To adjust for the specific frequency of flows
occuring per flow graph, the size of a time window is
calculated by statistical analysis of the network par-
ticipants’ behavior. This results in dynamic time win-
dows, where high frequencies of flows are assigned
shorter time windows than in flow graphs exhibiting
a low frequency of flows. The procedure leads to a
separation of the respective graph into behavior sub-
graphs, with the goal of establishing patterns of flows
of different event classes.
4.6 Multistep Correlation of Flows
To proceed with the aggregation of the heterogenous
harmonized flows, we propose using the semantic
flow type and the behavior subgraph of each flow as
identified in the previous steps. Furthermore, we pro-
pose the generation of prototypical scenarios and use
cases, with the latter instantiating the former, to effect
the desired groupings of heterogenous flows as shown
in Figure 3.
Combinations of semantic flow types co-
occurring in a behavior subgraph are considered to
constitute a potential scenario if happening in the
same part of the physical network in the same time
window. The order of security events may not be
necessarily fixed during an intrusion attempt, as
intrusion activities might be repeated, detected by
different sensors at different times or occur in other
networks with different participants (Zhang et al.,
2006). Therefore, we continue with unordered flow
combinations. Consider the following pattern as a
simple example of scenario generation:
1. Network participant 1 scans the network inter-
faces of network participant 2 in graph g in time-
window t, adding flow type x
1
to scenario s
1
.
2. Network participant 1 attempts to guess the ssh-
password on port 22 of network participant 2 in
graph g in time-window t, adding flow type x
2
to
scenario s
1
.
To sum up, a scenario is considered to be a tem-
plate or pattern of a certain behavior, that can be iden-
tified in further processing again and is based on the
contained event types. It is noteworthy that even sim-
pler scenarios comprising a single, isolated event type
may occur, although such scenarios are considered to
be of minor relevance for multistep correlation.
4.7 Use Case Grouping
A concrete sequence of semantic events, instantiating
a scenario, is defined as a use case. A use case hap-
pens between specific network participants within a
single time window in a specific subgraph. To expand
on the previous example and to provide a supplement
to Figure 3, the instantiation of the scenario as a use
case would proceed as follows:
1. IP1 scans the network interfaces of IP2 in graph
g
3
in t
2
at 2022-04-01 08:32:54, instantiating flow
type x
1
of scenario s
1
.
2. IP1 attempts to guess the ssh-password on port 22
of IP1 in graph g
3
in t
2
at 2022-04-01 08:35:28,
instantiating flow type x
2
of scenario s
1
.
IoTBDS 2023 - 8th International Conference on Internet of Things, Big Data and Security
56

Figure 3: Generating a use case and the respective scenario containing two BMUs from two flows of the same flow group
with two network participants in the same behavior subgraph.
With every harmonized flow being part of a use
case and having been assigned a scenario after con-
cluding this step, the flows may be clustered yet again,
despite their otherwise different semantic attribute
sets using the scenario information. To that end, we
propose using a second layer SOM to exploit the com-
pression potential of the SOM model yet again.
5 EVALUATION
In order to evaluate the performance of our proposed
concept, we apply a set of security events collected on
the shopfloor of a real-world manufacturing environ-
ment as described in 5.1 on prototypical implementa-
tion. The labels used for validation purposes are de-
scribed in 5.2, proceeding to discuss the results of the
evaluation in 5.3.
5.1 Shopfloor Data Set
The security events used to evaluate our approach
were generated by an operational IDS, which includes
three physical sensors installed on two different work-
shops of a single factory shopfloor in the automotive
sector. The 224,031 security events have been col-
lected by passively copying network traffic and sub-
sequent deep-packet inspection of the network traffic
by the IDS over the span of twelve months.
5.2 Log4j Scenario
Despite non-synthetic, labeled data being hard to at-
tain in the IT-security field due to the specific skill set
required and overall sensitivity of the subject (Bhatt
et al., 2014), applying to manufacturing environments
(Sen et al., 2022) especially, the limited predictabil-
ity of the evolution of the threat landscape proved
to be beneficial. After the Log4j vulnerability, also
known as Log4Shell, was made public (The MITRE
Corporation, 2021), the respective IT-security depart-
ment conducted several penetration tests. These sim-
ulated multistep attack scenarios were partially per-
formed in the time frame and in the physical networks
covered by our data set, provoking the respective IDS
to generate 16,133 security events related to this vul-
nerability. These samples thus have a known ground
truth and also share a known root cause. We there-
fore consider these attacks as fitting examples of use
cases instantiating a Log4j scenario. An overview of
the composition of the data set is provided in table
2. This subset of labeled samples provides an oppor-
tunity to construct a Binary Classification task from
an inherently Multi-Class clustering problem
6
, to dif-
ferentiate between a Log4j-label and an Unknown- or
Other-label to approach this instance of the Open-Set
Problem (Scheirer et al., 2012).
5.3 Testing and Results
To validate the performance of our proposed approach
in its entirety regarding our goal to not just cluster se-
curity events but to identify use cases and scenarios fit
for manual analysis, we consider an end-to-end evalu-
ation scheme by using the entire data set as input to an
instance of our prototype. In order to construct a bi-
nary classification task, we additonally define a min-
imum Threshold value, e.g. a fraction greater than
6
With the additional challenge of an unknown true num-
ber of classes.
Analysis of Security Events in Industrial Networks Using Self-Organizing Maps by the Example of Log4j
57

Table 2: Composition of shopfloor data set partitioned by
simulated attack.
Subset # Samples Notes
Attack 1 1 Network 1, Day 1
Attack 2 2 Network 1, Day 1
Attack 3 1 Network 1, Day 1
Attack 4 11,257 Network 1, Day 1
Attack 5 31 Network 1, Day 2
Attack 6 22 Network 2, Day 2
Attack 7 4,819 Network 3, Day 3
Subtotal: 16,133
Unknown 207,898 All other anomalies
Total: 224,031
50% or 80% of all samples of a cluster being Log4j
samples, for a cluster to be considered a Log4j cluster.
The intuition behind this scheme is to introduce Gold
Standard (Sch
¨
utze et al., 2008) labels to the cluster-
ing, as any cluster being assigned more than a sin-
gle sample may potentially contain samples of several
classes without such a voting mechanism.
Consequently, any non-Log4j samples in a Log4j
cluster are considered to be False Positives while
Log4j samples are considered to be True Positives.
Conversely, clusters containing a fraction less than the
chosen threshold value are considered to be clusters of
the unknown class, with any Log4j samples therefore
representing False Negatives and non-Log4j samples
True Negatives. Clusters containing no Log4j sam-
ples at all are excluded from this evaluation, as these
contain true negatives only and are therefore consid-
ered to be irrelevant to this evaluation.
The raw count of false negatives is considered to
be an important metric, given that any false nega-
tive signifies a vulnerable device potentially missed
by security personnel during a manual alert filtering
step building on the aggregation performed by our ap-
proach. The sensitivity is provided following a simi-
lar reasoning. The ratio of Log4j samples in relation
to the overall number of assigned samples to Log4j-
clusters serves as another highly relevant metric to as-
sess the validity of our approach, as a large number
of non-Log4j samples would impede manual analysis
and may furthermore lead to a cluster failing to meet
the respective threshold and consequently to a larger
number of false negatives. Furthermore, the True Skill
Statistic (TSS) (Allouche et al., 2006), also known as
Youden’s J Statistic (Youden, 1950), is given as well
as an indicator of the predictive accuracy of our ap-
proach regarding the detection of log4j-samples. The
overall Accuracy is provided as a summary metric to
gauge performance further.
The clustering results for a threshold of 0.99 and
a map size of 35 by 30 neurons, the latter resulting
from internal hyperparameter tuning of the analytic
workflow, are shown in table 3. Furthermore, the false
negatives for different thresholds ranging from 0.5 to
0.99 can be seen in Figure 4 to allow for general ori-
entation of the impact of a given threshold value on
the number of attack steps missed.
Table 3: Metrics of resulting clustering, using a Log4j-
threshold value of 0.99 where applicable.
Metric Result
# Neurons Output SOM 1050
# Neurons used overall 729
# Clusters with Log4j Samples 16
# Clusters Log4j Class 8
# Clusters Unknown Class 8
# Total of Samples in Clusters 17,977
Ratio of Log4j Samples 0.896445
True Positives 14,859
True Negatives 1,821
False Positives 23
False Negatives 1,274
Specificity 0.987527
Sensitivity 0.921031
True Skill Statistic 0.908559
Accuracy 0.927852
Figure 4: False negatives for Log4j-threshold values rang-
ing from 0.5 to 0.99.
5.4 Interpretation of Results
The results show that the prototypical implementation
assigned the 16, 133 ground truth samples and 1, 844
samples of the unknown class to 16 scenario clus-
ters out of 729 clusters overall, i.e. less than 3% of
clusters, resulting in a ratio of Log4j samples over all
samples of 0.8964 in the relevant clusters. This re-
sult may by itself be considered to support our stated
goal of enhancing managability already. Furthermore,
an accuracy of 0.927852, a sensitivity of 0.921031
and a TSS of 0.908559 at the most rigorous thresh-
old of 0.99 show that the Log4j-samples are identi-
fied with an overall low margin of error. Accuracy
and sensitivity reach 0.967903 respectively 0.989835
IoTBDS 2023 - 8th International Conference on Internet of Things, Big Data and Security
58

at a threshold of 0.5. Conversely, the TSS at this
threshold reaches 0.765865 due to a comparatively
lower specificity of 0.776030, indicating a trade-off
between specificity and sensitivity. The number of
false negatives range from 164 to 1, 821 for different
threshold levels from the interval [0.5, 0.99], as shown
in Figure 4. The distinct plateaus result from the grad-
ual ’flipping’ of clusters from the Log4j class to the
unknown class at threshold values greater than 0.6.
Furthermore, it is noteworthy that the respective
Log4j samples and therefore use cases of about 90%
of attacked devices are assigned to a single cluster.
This yields evidence that the goal of allowing for re-
use of manual analysis steps is distinctly possible by
employing our approach - a view supported by the
conclusions of (Haas and Fischer, 2019) insofar as at-
tacks on a network participant are assigned to a single
cluster and therefore indicative of related attack steps.
Given the rigorous threshold values
7
applied and
the disregard of purely non-Log4j clusters, we con-
sider these results as evidence that our approach
may facilitate further manual analysis by providing a
meaningful pre-aggregation of security events and is
therefore conducive to our stated goals.
6 CONCLUSION
With the increasing connectivity of industrial net-
works, several new challenges emerge, security con-
cerns being not the least among them. Mitigating such
threats naturally generates additional security-related
events, negatively impacting the performance of IT-
security departments.
To allow for processing these events in bulk and
therefore lessen the strain on security personnel, we
have proposed an unsupervised approach to group
multistep attacks along causal and semantic lines by
employing self-organizing maps.
To demonstrate the validity of our approach, we
identified several simulated attacks in a non-synthetic
data set collected from network-based intrusion de-
tection systems. The complexity of the data set was
reduced with a low margin of error, potentially facili-
tating subsequent manual analysis tasks.
To further validate our approach, future research
may address more diverse attack scenarios or consider
different data sources such as firewall or antivirus so-
lutions logs. Other avenues of investigation may lie in
identifying and subsequently filtering of single step
7
Gold standard labels usually being assigned to clus-
ters by simple majority of the respective samples’ labels
(Sch
¨
utze et al., 2008).
security events by a feedback mechanism or in im-
plementing more sophisticated approaches like Attack
Graphs (Phillips and Swiler, 1998) to enhance mod-
eling of causal relationships between security events.
REFERENCES
Aligon, J., Golfarelli, M., Marcel, P., Rizzi, S., and
Turricchia, E. (2014). Similarity measures for
OLAP sessions. Knowledge and information systems,
39(2):463–489.
Allouche, O., Tsoar, A., and Kadmon, R. (2006). Assessing
the accuracy of species distribution models: Preva-
lence, kappa and the true skill statistic (tss). Journal
of Applied Ecology, 43(6):1223–1232.
Ant
´
on, S. D., Fraunholz, D., Lipps, C., Pohl, F., Zimmer-
mann, M., and Schotten, H. D. (2017). Two decades
of SCADA exploitation: A brief history. In 2017 IEEE
Conference on Application, Information and Network
Security (AINS), pages 98–104.
Bhatt, S., Manadhata, P. K., and Zomlot, L. (2014). The op-
erational role of security information and event man-
agement systems. IEEE security & Privacy, 12(5):35–
41.
Chapple, M., Stewart, J. M., and Gibson, D. (2018). (ISC)
2 CISSP Certified Information Systems Security Pro-
fessional Official Study Guide. John Wiley & Sons.
Cherepanov, A. (2017). WIN32/INDUSTROYER: A new
threat for industrial control systems. White paper,
ESET (June 2017).
Gersho, A. (1982). On the structure of vector quan-
tizers. IEEE Transactions on Information Theory,
28(2):157–166.
Haas, S. and Fischer, M. (2019). On the alert correlation
process for the detection of multi-step attacks and a
graph-based realization. ACM SIGAPP Applied Com-
puting Review, 19(1):5–19.
Henning, M. A., van Vuuren, J. H., et al. (2022). Graph
and Network Theory. Springer Optimization and Its
Applications.
Hormann, R. and Fischer, E. (2019). Detecting Anomalies
by using Self-Organizing Maps in Industrial Environ-
ments. In ICISSP, pages 336–344.
Julisch, K. (2001). Mining alarm clusters to improve alarm
handling efficiency. In Seventeenth Annual Com-
puter Security Applications Conference, pages 12–21.
IEEE.
Kayan, H., Nunes, M., Rana, O., Burnap, P., and Perera,
C. (2022). Cybersecurity of industrial cyber-physical
systems: A review. ACM Computing Surveys (CSUR),
54(11s):1–35.
Knapp, E. D. and Langill, J. (2014). Industrial Network Se-
curity: Securing critical infrastructure networks for
smart grid, SCADA, and other Industrial Control Sys-
tems. Syngress.
Knowles, W., Prince, D., Hutchison, D., Disso, J. F. P., and
Jones, K. (2015). A survey of cyber security manage-
Analysis of Security Events in Industrial Networks Using Self-Organizing Maps by the Example of Log4j
59

ment in industrial control systems. International Jour-
nal of Critical Infrastructure Protection, 9:52–80.
Kohonen, T. (2001). Self-Organizing Maps. Springer, 3rd
edition.
Kohonen, T. et al. (2014). MATLAB implementations and
applications of the self-organizing map. Unigrafia Oy,
Helsinki, Finland, 2.
Langner, R. (2011). Stuxnet: Dissecting a Cyberwarfare
Weapon. IEEE Security & Privacy, 9(3):49–51.
Levenshtein, V. I. et al. (1966). Binary codes capable of cor-
recting deletions, insertions, and reversals. In Soviet
physics doklady, volume 10, pages 707–710. Soviet
Union.
Marchetti, M., Colajanni, M., and Manganiello, F. (2011).
Framework and models for multistep attack detection.
International Journal of Security and Its Applications,
5(4):73–90.
Navarro, J., Deruyver, A., and Parrend, P. (2018). A system-
atic survey on multi-step attack detection. Computers
& Security, 76:214–249.
P
´
erez, S. I., Moral-Rubio, S., and Criado, R. (2021). A new
approach to combine multiplex networks and time se-
ries attributes: Building intrusion detection systems
(IDS) in cybersecurity. Chaos, Solitons & Fractals,
150:111143.
Phillips, C. and Swiler, L. P. (1998). A graph-based system
for network-vulnerability analysis. In Proceedings of
the 1998 workshop on New security paradigms, pages
71–79.
Qu, X., Yang, L., Guo, K., Ma, L., Sun, M., Ke, M., and
Li, M. (2021). A survey on the development of self-
organizing maps for unsupervised intrusion detection.
Mobile networks and applications, 26(2):808–829.
Ross, R. S. et al. (2018). Risk management framework for
information systems and organizations: A system life
cycle approach for security and privacy.
Sadighian, A., Zargar, S. T., Fernandez, J. M., and Lemay,
A. (2013). Semantic-based context-aware alert fusion
for distributed intrusion detection systems. In 2013
International Conference on Risks and Security of In-
ternet and Systems (CRiSIS), pages 1–6. IEEE.
Sadoddin, R. and Ghorbani, A. A. (2009). An incremen-
tal frequent structure mining framework for real-time
alert correlation. computers & security, 28(3-4):153–
173.
Scheirer, W. J., de Rezende Rocha, A., Sapkota, A., and
Boult, T. E. (2012). Toward open set recognition.
IEEE transactions on pattern analysis and machine
intelligence, 35(7):1757–1772.
Schuster, F., Paul, A., and K
¨
onig, H. (2013). Towards
Learning Normality for Anomaly Detection in Indus-
trial Control Networks. In IFIP International Confer-
ence on Autonomous Infrastructure, Management and
Security, pages 61–72. Springer.
Sch
¨
utze, H., Manning, C. D., and Raghavan, P. (2008). In-
troduction to Information Retrieval, volume 39. Cam-
bridge University Press Cambridge.
Selzer, A., Sch
¨
oning, H., Laabs, M., Dukanovic, S., and
Henkel, T. (2020). IT-Sicherheit in Industrie 4.0:
Mit Bedrohungen und Risiken umgehen. Kohlhammer
Verlag.
Sen,
¨
O., van der Velde, D., Wehrmeister, K. A., Hacker, I.,
Henze, M., and Andres, M. (2022). On using contex-
tual correlation to detect multi-stage cyber attacks in
smart grids. Sustainable Energy, Grids and Networks.
Shannon, C. E. (1948). A mathematical theory of communi-
cation. The Bell system technical journal, 27(3):379–
423.
Smith, R., Japkowicz, N., Dondo, M., and Mason, P. (2008).
Using unsupervised learning for network alert corre-
lation. In Conference of the Canadian Society for
Computational Studies of Intelligence, pages 308–
319. Springer.
Souza, L. M. S. d., Spiess, P., Guinard, D., K
¨
ohler, M.,
Karnouskos, S., and Savio, D. (2008). Socrades: A
web service based shop floor integration infrastruc-
ture. In The internet of things, pages 50–67. Springer.
The MITRE Corporation (2021). Cve-2021-44228.
Available at: https://cve.mitre.org/cgi-bin/cvename.
cgi?name=CVE-2021-44228, last accessed on
04.08.2022.
Tuptuk, N. and Hailes, S. (2018). Security of smart manu-
facturing systems. Journal of manufacturing systems,
47:93–106.
Vielberth, M., B
¨
ohm, F., Fichtinger, I., and Pernul, G.
(2020). Security operations center: A systematic
study and open challenges. IEEE Access, 8:227756–
227779.
Youden, W. J. (1950). Index for rating diagnostic tests. Can-
cer, 3(1):32–35.
Zhang, Z., Ho, P.-H., Lin, X., and Shen, H. (2006). Janus:
A two-sided analytical model for multi-stage coor-
dinated attacks. In International Conference on In-
formation Security and Cryptology, pages 136–154.
Springer.
IoTBDS 2023 - 8th International Conference on Internet of Things, Big Data and Security
60
