
Borehole Inner Surface Visualization System with Vibration Cancellation
and Trajectory Smoothing Based on Optical Monocular Video Camera
Nan Zong
1 a
, Waleed Al-Nuaimy
1 b
, Heba Lakany
1 c
and Paul Worthington
2
1
School of Electrical Engineering, Electronics and Computer Science, University of Liverpool, Brownlow Hill,
Liverpool, U.K.
2
Department of Engineering & Development, Robertson Geologging Ltd., York Road, Deganwy, U.K.
Keywords:
Geological Data Logging, Monocular Video, Image Processing, Data Visualization.
Abstract:
The rapid digitization and modelling of the planet brings with it increased demand for the tools necessary to
process and visualize disparate streams of multivariate and often highly complex geophysical data streams.
The rationalization of detection hardware and the integration of sensors offers the potential to economically
visually explore and map geophysical environments such as the interior of subterranean boreholes. This paper
addresses the challenge of visual reconstruction of the geometry of the inner surface of a borehole from video
data collected via a monocular optical camera. We introduce a novel system of algorithms to unwrap the cylin-
drical borehole inner surface data and to compensate for the offsets and errors arising during data acquisition.
Three modules are designed for this task: Unwrapping module consisting o algorithms to generate visual-
ization results of borehole inner surfaces; Vibration cancellation module that compensates for rotation and
drift errors caused by the movement of detectors, balancing computational cost and performance; Trajectory
smoothing based on image convolution signal processing methods to filter out anomalies and interruptions
that arise as a result of the other processing stages. The proposed system integrates these modules to generate
planar side-view images with a high level of spatial accuracy. This system also contributes to establish a novel
and easy-to-access visualization tool of boreholes with simplified detectors that only consists of a monocu-
lar camera and a fixed circular LED band. Results has demonstrated the system is capable of resisting high
frequency drift and the effects of rotation and vibrations in harsh subterranean environments. This novel com-
bination of video and image processing marks a significant improvement over currently available or published
borehole video exploration techniques, and can be further extended and enhanced to deliver more accurate
multi-sensor 3D modeling and reconstruction of the complex inner structure of geophysical boreholes.
1 INTRODUCTION
As the geologic exploitation of the planet is be-
coming increasingly important for understanding the
world around us, the academic domains of geophysics
and geology are attracting growing attention from re-
searchers attempting to further facilitate the digitisa-
tion and visualisation of this exploration process.
Most researchers are focusing on providing more
precise measurements of dimensions following the
trend of the evolution of more advanced sensing hard-
ware, for example, data fusion of exploitation sen-
sors such as sonar and LIDAR (Thiele et al., 2021;
Pohl and Genderen, 1998). However, when it comes
a
https://orcid.org/0009-0007-1261-3671
b
https://orcid.org/0000-0001-8927-2368
c
https://orcid.org/0000-0003-3079-0392
to the exploration in a harsh environment, systems
with complex and fragile sensors are facing chal-
lenges of robustness problem where delicate sensors
must be strictly protected against high-pressure, high-
temperature, and underwater conditions(Thiele et al.,
2021; Pohl and Genderen, 1998). Thus, this trend is
being questioned since the system complexity will be
greatly aggravated of which the efficiency and cost
are not balanced. What is worse, due to the limitation
of commercial cost, the spatial constraints and relia-
bility demand against complicated designs, detectors
can often be constructed with limited sensors only.
Due to the constraints of the operating conditions,
it is normally considered that enhancing the strength
or sealing technology should be applied to the detec-
tors. But making detectors larger and even more com-
plex as other researches usually do could be accompa-
Zong, N., Al-Nuaimy, W., Lakany, H. and Worthington, P.
Borehole Inner Surface Visualization System with Vibration Cancellation and Trajectory Smoothing Based on Optical Monocular Video Camera.
DOI: 10.5220/0011840300003473
In Proceedings of the 9th International Conference on Geographical Information Systems Theory, Applications and Management (GISTAM 2023), pages 69-78
ISBN: 978-989-758-649-1; ISSN: 2184-500X
Copyright
c
2023 by SCITEPRESS – Science and Technology Publications, Lda. Under CC license (CC BY-NC-ND 4.0)
69

nied by a remarkable increment of manufacturing and
processing cost. Instead of enlarging the system, our
research starts to focus on the simplification of system
without losing much performance of the data record-
ing function of borehole inspection by migrating dif-
ficulties of hardware layer to software post processing
layer.
In this paper, based on the monocular tele-viewer
provided by the cooperator company, our contribution
is the proposition of a system design that integrates all
related solutions to handle image re-projection, vibra-
tion cancellation and trajectory smoothing of a bore-
hole side view visualizer. The "Side-view Unwrap
Module" we designed introduces methods of sam-
pling with modifiable parameters of unwrapped res-
olution need to be provided in order to generate clear
and exquisite visual results. The algorithms involve in
pixel sampling and extraction, and are designed based
on polar coordinates, prefixing the center of borehole
as origin. This offers to sample valid pixels on a ring
of borehole inner surface with higher resolution af-
ter interpolations. Settings of sampling resolution and
range are configurable to adapt to different borehole
logging files and conditions.
After obtaining the unwrapping results, it is consid-
ered that the performance is largely influenced by
camera direction change and position drifting, which
can be concluded as vibrations. Thus in the second
design of "Vibration Compensation Module", meth-
ods are developed, aiming to stabilise the visual re-
sults collected by the optical camera. Vibrations un-
der the described usage scenario are considered to
be rotation errors and drifting errors compared to the
center of boreholes as origins. A mixed algorithm
design of cylindrical borehole center finder and rota-
tion compensation with cross-correlation is proposed,
which has good balance in time cost and performance
compared to other video stabilizers when compensat-
ing drifting and rotation errors, and particularly effec-
tive at smoothing high frequency vibrations.
To improve the defauls of compensated results (in-
terruptions between rows might occur after vibra-
tion cancellation), a "Trajectory Smoothing Module"
based on convolution of a preset window size is de-
ployed. This smooths the interruptions of pixel shifts
on unwrapped image which occur during compensa-
tion and unwrapping procedure. This helps to im-
prove the consistency of visual inspection of bore-
holes.
The final results processed after the entire procedure
prove that this visualizing system can not only effec-
tively extract clear side-view images of boreholes, but
also can resist high frequency vibrations and provide
continuous visual results with good balance between
processing time cost and performance.
2 RELATED WORKS
2.1 Problems and Challenges
In this part, a large number of problems and chal-
lenges occur in the field of logging borehole data and
visualization are widely discussed. Three main prob-
lems occurs during the construction of borehole vi-
sualization system with monocular camera and fixed
illumination LED Ring:
• Pixels Extraction and Image Re-projection in Un-
wrapping Procedure;
• Compensation of Vibration Brought by Move-
ment of Detector;
• Trajectory Smoothing and Visualization Improve-
ment of Inspection Results.
First of all, visual data collection problem is
raised, involving video clarity, geological feature ex-
traction and data quality assessment. Such prob-
lems become especially evident when the detectors
are always deployed under extreme situations - liq-
uid medium with impurities, temperature change and
dark illumination conditions. This limits the selec-
tion of reliability of sensors, and the complexity of
detectors is required to be as simple as possible to
avoid potential damage. Thus, how to obtain good vi-
sual results from simple sensors, how to enhance the
captured visual data and how to filter disturbances are
urgent and charming challenges that need to be con-
quered in order to unwrap and render a high quality
inner surface texture of boreholes before presenting
the visual results of boreholes geological log data.
2.2 Background Research
2.2.1 Pixel Extraction and Video Re-Projection
Many researchers worked on unfolding and map-
ping video frames from projection on spherical can-
vas (which is the nature physics of monocular cam-
eras) to cylindrical or even flat canvas, with distor-
tion correction and effective interpolation. There are
two types of distortion involved in the first phase
of of re-projection: Radial distortion and tangential
distortion, which are brought by the physical con-
straints of sensors with semi-spherical lens. To cancel
radial distortion,(Hartley and Kang, 2007) proposed
effective methods that determines the radial distor-
tion and also computes the center of radial distortion
GISTAM 2023 - 9th International Conference on Geographical Information Systems Theory, Applications and Management
70

in a parameter-free way, not relying on any particu-
lar radial distortion model. For tangential distortion
cancellation, proposals of(Beauchemin and Bajcsy,
2001) models the lens radial and tangential distortions
and determines the optical center and the angular de-
viations of the CCD sensor array within a unified nu-
merical procedure.
After fixing distortion and determining inner pa-
rameters of the camera, re-projection methods can be
applied. A planar coordinates to polar coordinates
transform is implemented to sample pixels in a circu-
lar order, with radius and angle step for each sample
selected as parameters. This allows to extract points
from a downwards (upwards) view of image to the
projection points on side view as a cylindrical surface
is usually considered as borehole inner surfaces. This
kind of re-projection distinguished itself from normal
demand of image projections due to the special use
case of cylindrical borehole geometry.
2.2.2 Vibration Compensation
In the aspect of vibration and error correction of mov-
ing cameras, stabilisation methods are also widely
taken into consideration with various methods pro-
posed.
In traditional image processing perspective, video
vibration cancellation involves in multi sensor data
fusion. A previous research of this work includes
a camera position correction method using acous-
tic sensor. By calculating the amplitude and travel
time of the ultra-sonic wave, it is possible to find out
the relative displacement of the detector(Al-Sit et al.,
2015). Taking another example of OIS(Optical Image
Stabilization), by using the data from gyro sensors,
the camera’s movement and vibration can be com-
pensated by the three dimensional angular accelera-
tion of the device(Cardani, 2006). Some researchers
have also started to focus on mechanical stabilizers
controlled by magnetic field which can be adjusted
using electric currents, with tracks that can move the
camera on the same plane, even though the angu-
lar oscillation and rotation error cannot be compen-
sated(Bereska et al., 2013). The most state-of-art
vibration cancellation now includes OIS, mechani-
cal stabilizer and gimbal stands. Gimbal stands use
multi-motors to provide three dimensional movement
for cameras to compensate against sudden unexpected
movement(Rajesh and Kavitha, 2015).
For digital video stabilizer without the use of spe-
cific hardware, several newly proposed researches
are listed(Souza and Pedrini, 2019). The 2D digi-
tal video stabilization process is usually implemented
in three steps: (i) camera motion estimation, (ii) re-
moval of unwanted motion and (iii) generation of the
corrected frames, which apples affine transforms to
align the video frames according to the remaining
motion. As a widely welcomed research direction,
Monocular V-SLAM(Visual Simultaneous Localizing
and Mapping) issues are also considered an effective
way to estimate camera pose and stabilise, not only
in Geophysics but also in fields as Autonomous Driv-
ing and Robotic Perception. ORB-SLAM2 proposed
a very effective way to solve camera location and pose
with epipolar geometry and ORB key feature points
extraction(Mur-Artal and Tardós, 2017). Other V-
SLAM algorithms also outperforms in certain criteria
but they mainly share similar performances in gen-
eral.
2.2.3 Trajectory Smoothing
Trajectory smoothing is considered as a post process-
ing phase after obtaining compensated results from
vibration cancellation phase. Similar to Monocular
V-SLAM methods, trajectory smoothing also use key
points extraction and tracking in frame sequences to
regenerate camera pose and location. Then sliding
windows of smoothing range is defined to cancel high
frequency vibrations, which might not be effectively
stabilised in the vibration cancellation phase(Souza
and Pedrini, 2018). Here we studied two classic tra-
jectory smoothing algorithms: (i) Moving average,
which calculates the average in a range of neighbors
as the value of the center point (ii) Savitzky-Golay
Filter, a filtering method based on local polynomial
least squares simulation(Press and Teukolsky, 1990).
Both methods are considered foundation and cor-
nerstone of points trajectory smoothing methods
which guarantee good enough performances in cam-
era stabilisation. Meanwhile, trajectory smoothing
can not only filter high frequency vibrations, but also
can interpolate trajectory way point if an interruption
(or a large dislocation in neighboring frames of a se-
quence) occurred in the results of vibration cancella-
tion.
3 SYSTEM DESIGN &
PRINCIPLE
Our system is designed to accomplish a pipeline pro-
cedure of processing. Expected input data are no
more than 2D color images that is listed in a con-
tinuous time sequence. The content of these frames
are view ports that look downwards to the bottom of
boreholes, captured by a monocular camera. A fixed
illumination source using a LED ring with a max in-
tensity measured at 12lm per LED diode is integrated
Borehole Inner Surface Visualization System with Vibration Cancellation and Trajectory Smoothing Based on Optical Monocular Video
Camera
71

around the camera, and the detector supports auto-
matic brightness adjustment and white balance. Also,
a mechanical centraliser is attached to maintain the
position and direction of the detector to the center
of the borehole, facing downwards the center of the
bottom. These mechanical and designs facilitate the
pre-processing of the recorded images thanks to a rel-
atively good quality of recorded video1.
Figure 1: Detector provided by sponsor company.
Three modules are designed to handle each tasks,
described as follows.
3.1 Side-View Uwnrapping and
Re-Projection
A "Side-view Unwrapping Module", aiming to deal
with pre-processing and re-projection of image data
captured. The work flow of this module first involves
in cancellation of the distortion by recalculating the
inner parameter of the camera, followed by steps of
remapping pixels in the shape of a sampling ring to
a unwrapped side-view. This sampling and remap-
ping is based on the assumption of cylindrical bore-
holes drilled artificially. For the distortion cancel-
lation, the calibration of inner parameter focuses on
the radial distortion and tangential distortion cancel-
lation. These two distortions are modelled as below:
For radial distortion: For tangential distortion: Solu-
tions to remap the image using the matrix of distortion
are given as follows: Thanks to (Hartley and Kang,
2007) and (Beauchemin and Bajcsy, 2001), the inner
parameters of the camera are effectively calculated
using the corresponding calibration tools in OpenCV
library.
After having corrected the camera, a mapping re-
lational expression from pixels on the sampling ring
using polar coordinates to the rectangular plane co-
ordinates of pixel on the unwrapped plane is estab-
lished:
P(ρ, γ) =
(
Px(ρ, γ),
Py(ρ, γ),
where
Px(ρ, γ) = ρ cos (γ),
Py(ρ, γ) = ρ sin (γ),
This allows the visualizer to analyse and remap the
semi-spherical space capture by the camera towards
the bottom of boreholes to the cylindrical side-view
around the detector. These flattened images are de-
fined as the unwrapped image results of the inner sur-
face of boreholes.
3.2 Vibration Cancellation
Regarding the method applied and unwrapped image
results obtained in the first module, a noticeable im-
perfectness occur that sudden shifts of pixels, or "in-
terrupts" greatly influenced the continuity of appear-
ance of visualization. These interrupts are caused by
sudden vibrations of the camera. These vibrations can
be decomposed and modelled as two types: transla-
tion movement on the plane of the camera lens and
rotation with the axis in the direction of the length of
the detector. Therefore, a second Module named "Vi-
bration Compensation Module" is implemented aim-
ing to cancel these two types of vibration error. For
cancelling the translation movement error, a borehole
center finder is applied to fix the captured image cen-
ter to the borehole center.
The according algorithm uses the dark part of the
borehole image as the center part of the borehole
which might contain the borehole center. A ellipse
finder is used to find out the largest ellipse matched
to the contour of the dark area in the borehole video
frames. This potentially returns the center of the bore-
hole that is also considered as the relative loaction of
the camera:
This coordinates also indicate the relative location
of the detector/camera comparing to the borehole.
To diminish the rotation type of error, cross-
correlation method is used to detect the rotated
number of pixel in the unwrapped image. Cross-
correlation is first used to compare the similarity or
pattern between two time-oriented signals, and it can
also yield the delay of time which can make a maxi-
mum match of pattern of two signals. Using this prop-
erty, it is possible to measure the rotation error (con-
sidered as the delay of time in time-oriented signals)
of two rows of pixels. In order to implement, the two
pixel rows to compare should firstly be normalized.
In our case, in a 8 bit image, the normalization is in
the range of [0, 255]. The time axis is replaced by the
index of pixels in the row, and the index corresponds
to the sampling angle of each frame as a results of
the first module. Then, cross-correlation is calculated
GISTAM 2023 - 9th International Conference on Geographical Information Systems Theory, Applications and Management
72

Algorithm 1: Borehole Cylindrical Center Finder.
Input: input video V
Output: output center location C
borehole
1: Using OpenCV ellipse matching to find the center
of borehole
2: Load video V and get video resolution R
3: Get current frame F
4: Set center of resolution C
image
= 0.5 × (R)
5: Set C
temp
= C
image
6: if F in frames sequence of V then
7: G = GaussianBlur(F)
8: Gr = ColorConvertGrey(G)
9: B = Binarization(Gr)
10: if found Contours in B then
11: for Ctr in Contours do
12: Ctr = Largest(Contours)
13: if Ctr area in AreaRange then
14: E = Matchellipse(Ctr)
15: C
contour
= ellipseCenter(E)
16: if distance(C
contour
, C
image
) in
DistanceRange then
17: C
borehole
= C
contour
18: C
temp
= C
contour
19: else
20: Ctr = NextLargest(Contours)
21: else
22: C
borehole
= C
temp
23: F = NextFrame
return C
borehole
between two neighboring rows to compare their simi-
larity.
This algorithm utilizes the principle that if a ro-
tation movement of camera occurs, two continuous
rows extracted will not be similar anymore without
rotation compensation, with similarity and accord-
ing shifted pixels are given by the value of cross-
correlation and corresponding delay. Thus, if the
module can find the the maximum value and the ac-
cording delay of index, they can be used to compen-
sate thee rotation. If the maximum value of cross-
correlation remains at a low level (lower than a thresh-
old), the module can filter two neighboring rows that
have a huge difference of appearance that breaks
the visual continuity. Therefore, these two rows are
proven to be unsuitable for compensation in this case.
3.3 Trajectory Smoothing
After the first two modules, in order to avoid sud-
den interrupts that are not suitable to be compen-
sated as described previously, the module "Trajec-
tory Smoothing Module" is finally deployed to ame-
liorate the experience of visualisation for users. For
Algorithm 2: Rotation Compensation Using Cross Correla-
tion.
Input: input a row of unwrapped pixels R1
Output: output similarity S and rotated number of
pixels R
rotated
Using Cross Correlation to Evaluate Similarity &
Rotation
2: R2 = NextRow(R1)
S
list
= CrossCorrelation(R1, R2)
4: while R2 is not None do
S
max
= max(S
list
)
6: if S
max
>= SimilarityT hreshold then
S = S
max
8: R
rotated
= indexo f (S) in S
list
else
10: Cannot Compensate
Pass
12: R1 = R2
R2 = NextRow(R1)
return S, R
rotated
artificially exploited boreholes, inner surfaces are al-
ways continuous in textures and patterns. When an ir-
reparable structure or movement of camera is encoun-
tered, in order to solve the discontinuity that should
not occur, trajectory smoothing algorithm is intro-
duced.
Two types of interruption of continuity of cam-
era trajectory according to the vibration cancellation
module are considered: Drifting interrupt caused by
drifting and rotary of camera. By analysing the ex-
pected results of vibration cancellation module, the
trajectory anomalies are mainly outlier noises that
can be effectively filtered by using a local polyno-
mial least squares simulation based Savitzky-Golay
Filter(S-G filter). This filter performs in a fast speed
with good performance of calculating average in an
interval, and keeps the data unmodified at both bor-
ders (the beginning and ending sections) of the trajec-
tory. It can also maintain the shape of signals while
filtering outliers and smoothing sharp turning points
in a sliding window using polynomial fittings. The S-
G filter is applied once when the pixel rows (results
of module 2) are accumulated to a number of the win-
dow size which can effectively lower the consumma-
tion of calculation resources.
For a filtering window size of n = 2m + 1
, signal values to be filtered as x = (−m, −m +
1, ..., 0, 1, ..., m − 1, m), and a polynomial degree of
k − l used to fit, the fitted value of the window y is:
y = a
0
+ a
1
x + a
2
x
2
+ ... + a
k−1
x
k−1
Thus, a system of linear equations with k elements
can be constructed. In the form of matrix:
Y
(2m+1)×1
= X
(2m+1)×k
· A
k×1
+ B
(2m+1)×1
Borehole Inner Surface Visualization System with Vibration Cancellation and Trajectory Smoothing Based on Optical Monocular Video
Camera
73
Here, Y is the matrix of fitted values and X is the input
signal. Thus, the coefficients of the polynomial A and
the predicted values of Y can be solved:
ˆ
A = (X
T
· X)
−1
· X
T
· Y
ˆ
Y = X · A = X · (X
T
· X)
−1
· X
T
· Y = E · Y
with:
E = X · (X
T
· X)
−1
· X
T
· Y
4 EXPERIMENTS & RESULTS
Since this research work is based on borehole inspec-
tion, a borehole detection hardware tool is applied as
a platform for following researches. A visualization
tool and according hardware detector are shown in
Figure 2.
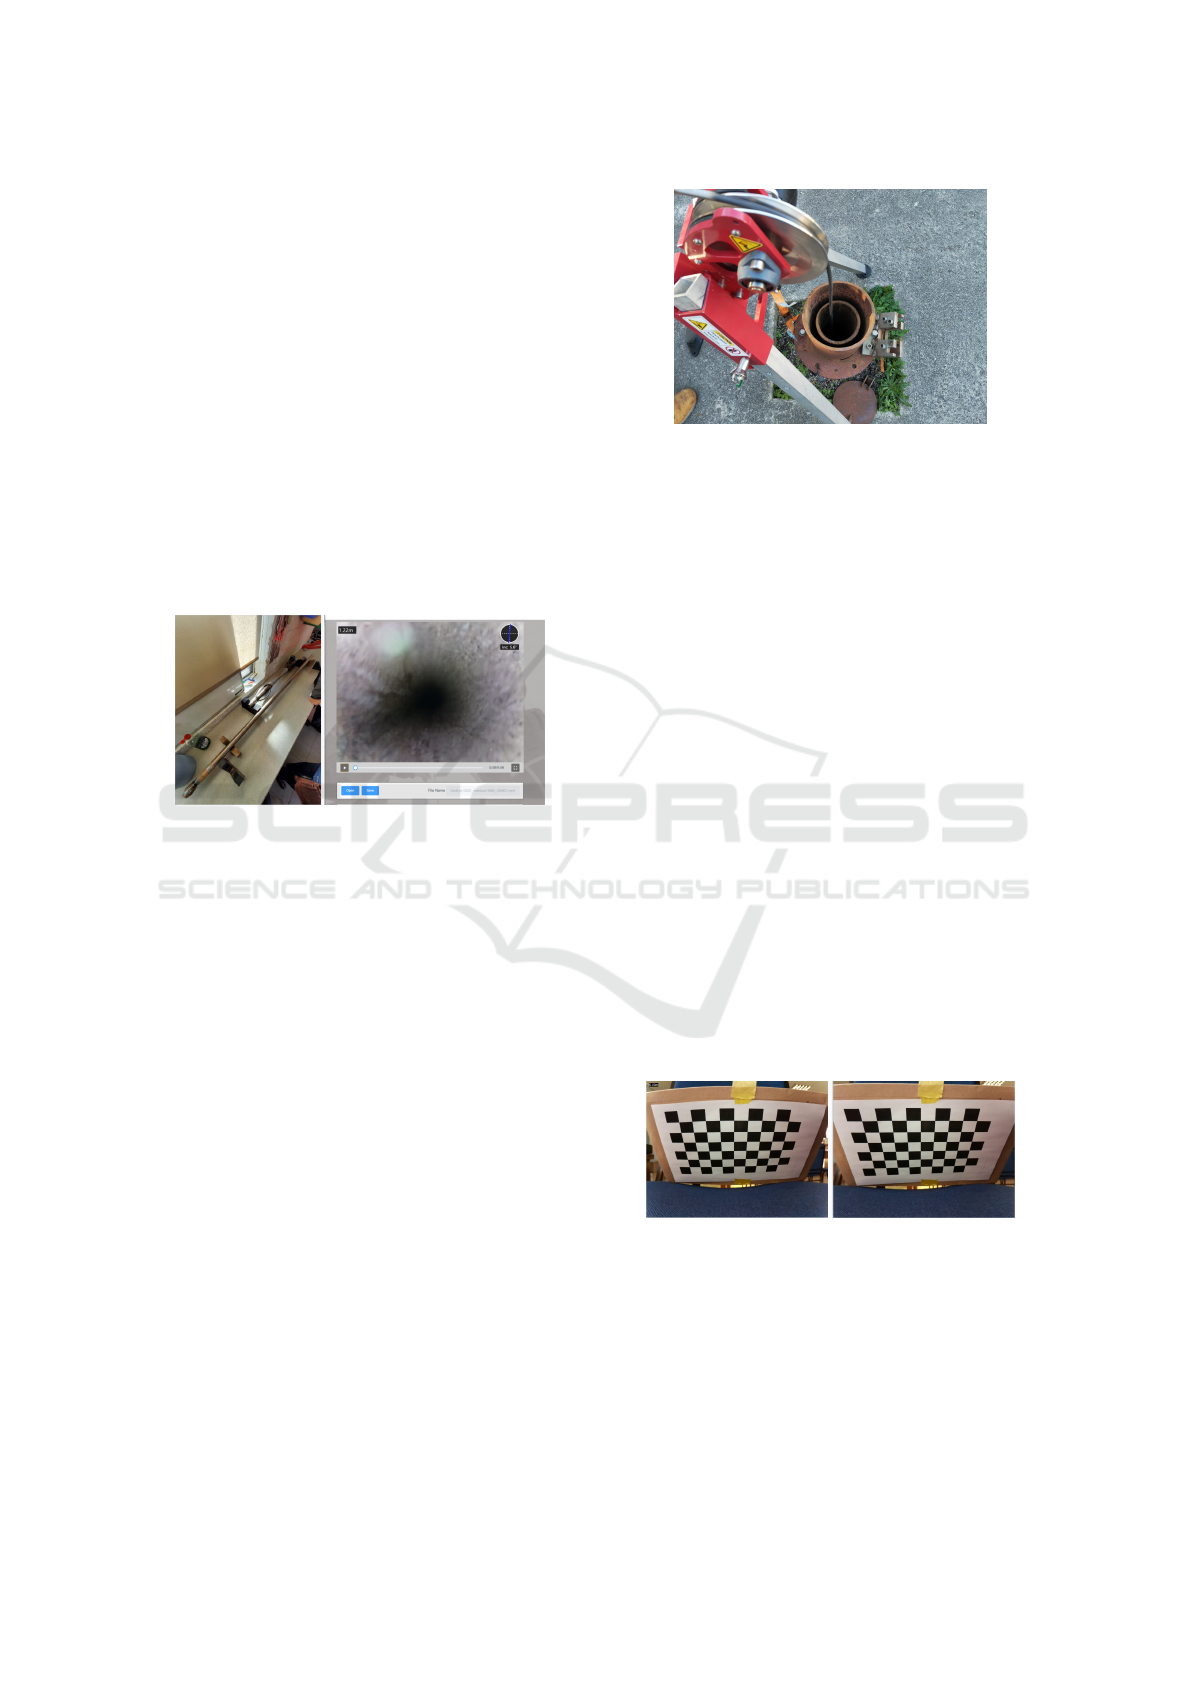
Figure 2: Detector and video player provided by sponsor.
Data used in this section are collected using the
mentioned borehole detector above, in different in-
spection environment of boreholes, provided by part-
ner company. For example, a drilled test borehole lo-
cated in Deganwy, Wales, United Kingdom. Data are
logged as video files encoded by h264 format in mp4
container.
The according field of view (FoV) of this video
is measured at 45 degrees both horizontally and ver-
tically after cropping. The resolution cropped is
800*600. The detector itself has a mechanical central-
izer that can relatively stable the camera at the center
of the borehole.
The workflow of the data recording is that the de-
tector fixed on one end of the winch rope is lowered
down into the borehole facing towards the bottom.
The moving speed is kept as uniform and as slow as
possible to generate stable and clear videos of the in-
ner surface shown in Figure 3.
4.1 Side-View Unwrapping
The function of this module is to find out suitable po-
sitions of pixels which are used in the unwrapping.
First of all, the inner parameter of the camera
is tuned by 8 checker board images from standard
Figure 3: Winch used to send detector down into the test
borehole.
OpenCV documents with 22cm as the width of each
square pattern.
The generated K and D matrix are as follows,
where K matrix represents the intrinsics of the cam-
era, or the focus and center of camera image, and D
matrix recalculates the tangential/radial distortion co-
efficients of the camera.
K =
f x 0 cx
0 f y cy
0 0 1
D =
k1 k2 p1 p2 p3
where
• f x, f y, the focuses on x axis and y axis of the cam-
era
• cx, cy, the center pixel location of the camera im-
age
• k1, k2, p1, p2, k3, the radial/tangential distortion
parameter
Here is an example figure (Figure 4) that presents
results before and after anti-distortion using the detec-
tor and according intrinsic matrix and distortion ma-
trix K, D.
Figure 4: Before and after distortion compensation.
The borehole shape is cylinder-like, thus a "Scan
Circle" is selected to fix the positions of pixels, which
corresponds to one extracted row in the unwrapped
image.
Polar coordinates are used, with origin point cho-
sen at the center of the borehole. Here, P(ρ, γ) repre-
sents the rectangular planar coordinates for a pixel at
location (Px, Py) on the video frame captured in the
GISTAM 2023 - 9th International Conference on Geographical Information Systems Theory, Applications and Management
74

polar coordinates. i is the index of the sampled pixel
on the unwrapped row. Two parameters are designed
to control the selections of pixels on the "Scan Circle"
with index i:
P(ρ, γ)[i] =
(
Px(ρ, γ)[i],
Py(ρ, γ)[i],
where
Px(ρ, γ)[i] = ρ cos (i × γ),
Py(ρ, γ)[i] = ρ sin (i × γ),
• ρ, the pixel distance between the center and the
pixel
• γ, the angle sampled with a certain step
• i, the index of the sampled pixel in anti-clockwise
order
It is noteworthy that the ρ value should be lim-
ited according to camera profile. Due to the focus of
camera is at around 3mm, the detection range of clear
image will be at a pixel distance interval from 60 to
240 pixels. As the resolution of video clip is fixed at
800*600, for each "Scan Circle" with radius from 60
pixels to 240 pixels, the resolution of minimum num-
ber of pixels are from 180 to 720.
As a result, in this proposed unwrapping method,
the rho value of 240 and the γ step value of 0.5 degree
are selected to generate good quality side view pix-
els with 720 pixels chosen per row in the unwrapped
image.
Figure 5: Original frame and corresponding unwrapped side
view image.
Here is a chosen frame from the video and its cor-
responding unwrapped row (to visualize better, sev-
eral rows are displayed together as a band of image
block in Figure 5).
The results showed good quality of unwrapping
when the camera stays relatively stable at the center
of the borehole. However, when the detector touches
the wall of the borehole, vibrations and rotations are
inevitable, which might cause the non-continuity of
unwrapped rows from continuous frames. This trig-
gers the functionality of next module, improving the
performance of this unwrapping method by providing
compensation of camera centralization and rotation.
4.2 Vibration Compensation
In this section, a experiment corresponding to the sys-
tem design of combining cross correlation and ellipse
center finder is implemented to deal with centralisa-
tion and rotation cancellation tasks. Since the cen-
ter of the video (of a borehole) is always a dark el-
lipse due to the poor brightness illumination of the
bottom of boreholes, it is easy to extract a ellipse
shaped center and the sampling "Scan Circle" can be
re-configured to compensate the drifting of camera
caused by outer influences. The center of these el-
lipse can represent the trajectory of the camera mov-
ing downwards to the bottom of the borehole in Figure
6.
Figure 6: Ellipse center (yellow) and camera trajectory.
In terms of rotation compensation, the extracted
row of pixels are considered as a 1 dimensional sig-
nal. By comparing continuous rows of pixels, it is
possible to find out if pixels are rotated according to
the differences between them. Because of the conti-
nuity of pixels rows , the similarity of these signals
should remain at a high level. Thus, cross correlation
of two neighboring signals can provide solutions of
how many pixels are drifted before and after by cal-
culating the maximum cross correlation value and ac-
cording delay applied to following rows. Here, we
take two continuous rows as an example of cross-
correlation rotation correction7. Each row includes
720 pixels according to the sampling gamma of 0.5
degrees in the test of previous unwrapping module.
Since the calculation of cross-correlation consid-
ers a full range number of pixels in one row from
index 0 to 719, these samples are therefore repeated
and reconstructed as a signal of tow periods (index
from 0 to 1439) of the original input. As a result, the
Borehole Inner Surface Visualization System with Vibration Cancellation and Trajectory Smoothing Based on Optical Monocular Video
Camera
75
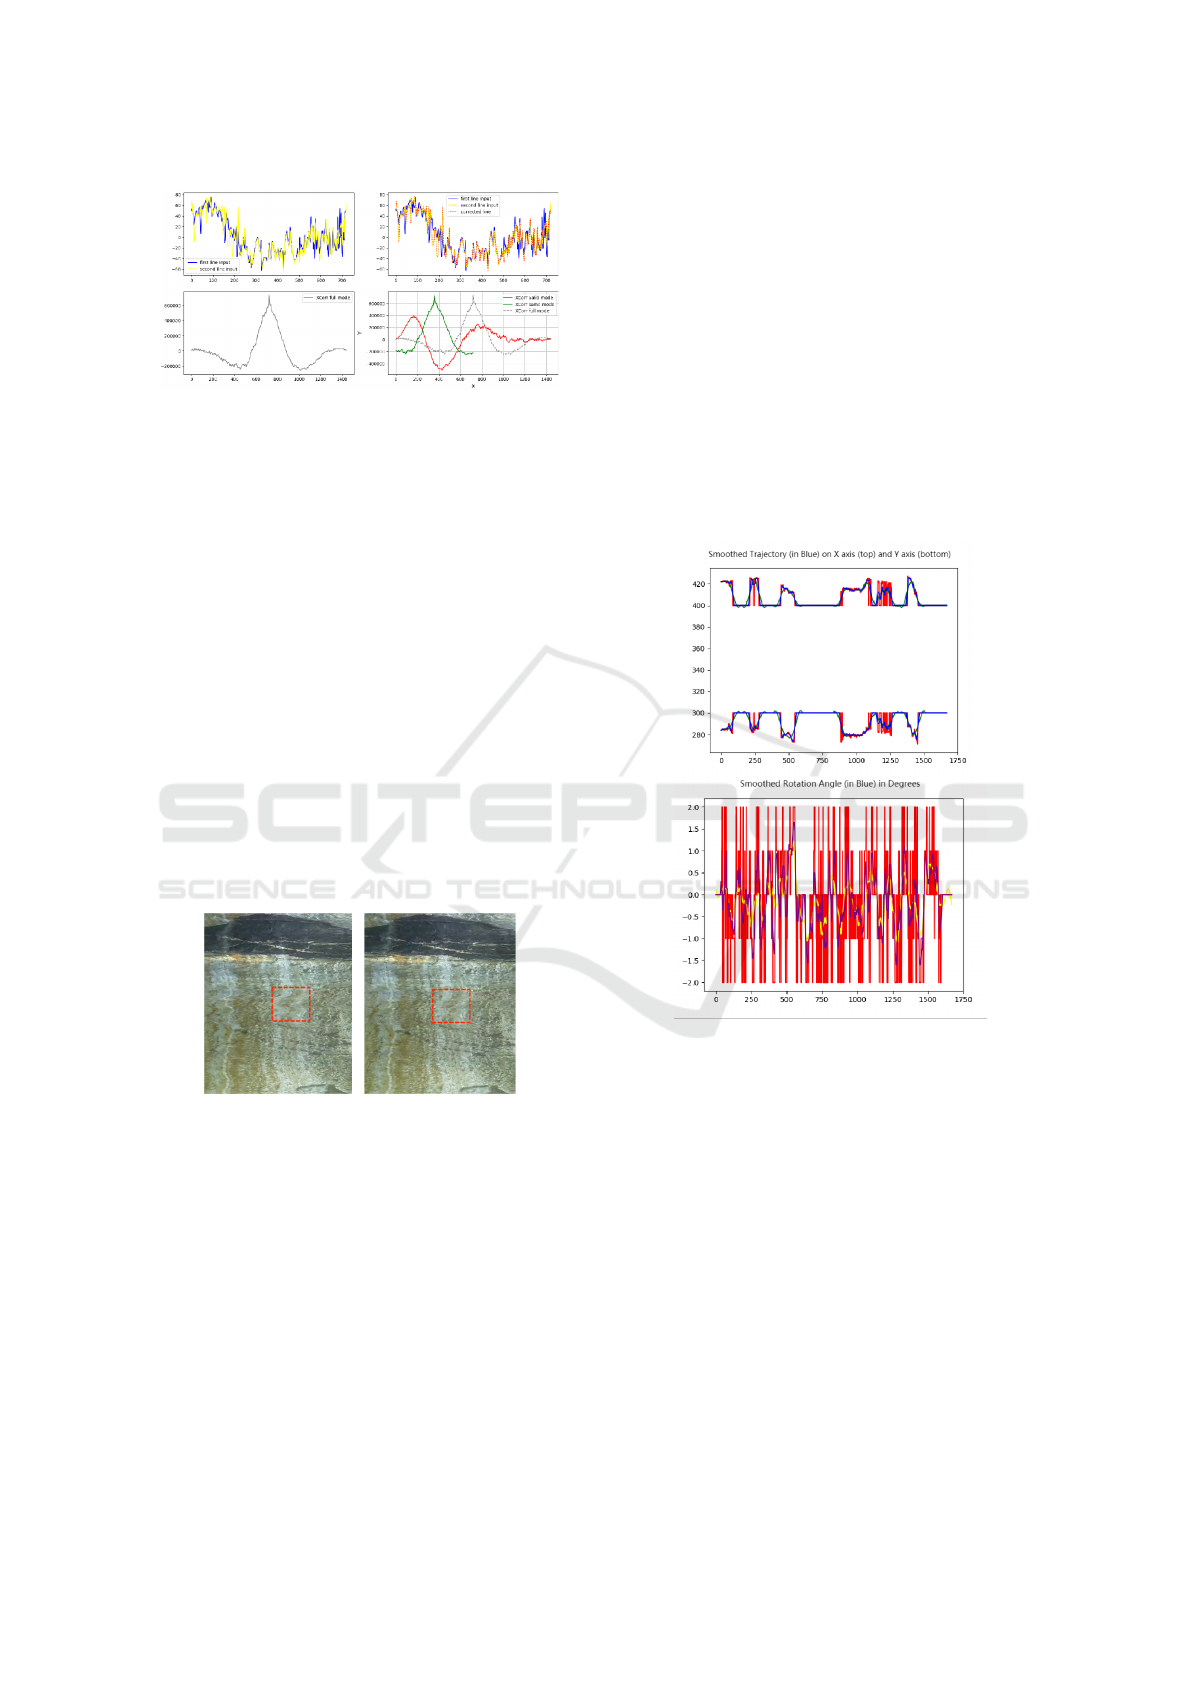
Figure 7: Rotation compensation before and after.
cross-correlation value reaches the maximum point at
a pixel shifting (or "delay" of signal) number of 730
pixels. This indicates that the input row should be ro-
tated with a delay of pixels of 11 pixels to make the
two rows match each other to maximum. The maxi-
mum similarity in this case reaches more than 65000
(signals normalized from 0 to 255). This proves that
if a rotation compensation of 11 pixels anti-clockwise
is applied to the next row, the rotation error between
these two neighboring rows can be effectively dimin-
ished.
Below are the visualized results when the center
finder and rotation compensation module tested on
the entire video. It can be seen that the original un-
wrapped data on the left is intensively distorted in the
red block area. This reflects to a sudden collision of
the camera and the wall in the logged video. On the
right, the compensated results successfully corrected
this collision that caused drifting and rotation of the
detector, which can be obviously seen in Figure 8.
Figure 8: Cross correlation applied to unwrap - before and
after.
However, in a more detailed inspection of the vi-
sual results, several noticeable faults (or interruptions
of vertical continuity) can be seen where severe mis-
place occurs. These faults are caused by the settings
of threshold in the module. Settings include the max-
imum drifting distance and maximum rotation error
that can be compensated using the continuity prop-
erty of camera record. If an obvious discontinuity of
the texture of the surface occurs, it is not suitable for
compensation, since visually it is impossible to tell if
this discontinuity is caused by the camera vibration
or it is just the natural appearance of geological de-
formation.
4.3 Camera Trajectory Smoothing
As a solution of the described problem above, a
smoothing procedure with S-G filtered is tested to rel-
atively reduce the incongruity of discontinuation. It
recalculated the prediction values of Y using the algo-
rithm in section 3.3. Here is the result before and after
applying this smoothing method to unwrap the video
in Figure 9. The red lines are the original trajectory
drifting and rotation detected in the test of vibration
compensation module. The blue lines represent the
results after smoothing.
Figure 9: Smoothed trajectory of drift and rotation.
The performance is shown to be very effective,
largely facilitating the problem of faults between rows
and improving user experience when inspecting. It
especially outperforms to smooth both rotation and
drifting in a fast speed of calculation. In the Figure 10
of trajectory smoothing results below, a remarkable
correction of errors can be seen in the block marked
in red.
4.4 System Evaluation
Finally, the entire work flow of the designed system
is implemented. Two testing boreholes are selected
to examine the performance of the system. Here, the
first test borehole is located in Deganwy, Wales11].
In order to evaluate the performance quantitatively
GISTAM 2023 - 9th International Conference on Geographical Information Systems Theory, Applications and Management
76

Figure 10: Smoothed results of unwrapping of the video.
Figure 11: Test results of borehole in Deganwy before(left)
and after(right) processing.
to some extent, 18 locations of key points were man-
ually labelled on the unwrapped image and a ground
truth of inner surface generated by using ultra-sonic
sensors and panoramic side view camera. The differ-
ences of according pixel locations between the output
and ground truth are measured, thus the less the dif-
ferences are, the better our borehole visualizer based
on monocular camera works according to the results
in Figure 12.
Figure 12: Quantitative results of trajectory comparing to
ground truth.
For the ground truth, the camera trajectory is cen-
tralized in the borehole. Line in green is GT with no
rotation error, and the yellow line represents the fi-
nal output of the system. The average rotation error
is measured at less than 8 pixels, which means 4 de-
grees. On the right, there are results of center position
with values that represents the distance from center
to the left edge of unwrapped image. Blue line rep-
resents the center of GT, and yellow line is the out-
put. The error of drifting in this figure stays within 10
pixels of distance, which is almost not noticeable for
human eyes.
Results above proves that the system can produce
good results, meaning that a simple monocular detec-
tor can be considered a powerful potential replace-
ment of detectors with complicated sensors at higher
price.
Here is another user test provided by sponsor com-
pany of the system (Figure 13):
Figure 13: Test results of borehole in California.
As presented on the top two images of Figure 13,
when a high-frequency circular swing of the detector
is detected, results show that the unwrapped image
is nicely compensated without interruptions and large
distortions of the tracks of the textures on the inner
surface. According to the feature of the designed sys-
tem, this performance is expected and also proved to
be able to handle high frequency vibrations, which are
always encountered during utilization on-site.
5 CONCLUSIONS
This paper introduces a novel visualization approach
for the inner surface of boreholes using only a monoc-
ular video camera. Three modules are designed to
solve three related problems in logical order:
A Side-view unwrapping module was developed
to sample the pixels on video frames and then re-
project the coordinates of pixels from downwards
view port to side view port, with the assumption
of cylindrical shape in the normal case of artifi-
cially drilled boreholes. A distortion cancellation
pre-processing stage is implemented first to cancel
radial/tangential deformation of the image. Then a
transfer of coordinates allows the extracted pixels to
be remapped on side view, with configurable parame-
ters of sampling position and unwrapping resolution.
Borehole Inner Surface Visualization System with Vibration Cancellation and Trajectory Smoothing Based on Optical Monocular Video
Camera
77

A Vibration compensation module compensates
the drift and rotation errors caused by friction, colli-
sions and cable twist effects when lowering the detec-
tor into the borehole. Drift errors are fixed by finding
the center position of boreholes on the video canvas
with a ellipse finder that considers the dark ’bottom’
area of the borehole as a potential center ellipse can-
didate of the cross-section of the borehole. Rotation
errors are then compensated using cross-correlation
which calculates the similarity and delay that can
match two signals to the maximum. Two neighboring
rows of extracted pixels are taken as input signals, and
two threshold of similarity and delay are set to ensure
the selected rows are suitable for compensation.
Finally, a camera trajectory smoothing module to
handle the abrupt any changes of texture. In order to
improve the visual presentation of the borehole inner
surface, a Savitzky-Golay filter (S-G filter) is intro-
duced to smooth the camera trajectory. Results show
that the smoothing is effective as unexpected discon-
tinuities brought about by vibration and data acquisi-
tion effects between rows are effectively eliminated.
To conclude, this system successfully accom-
plished a borehole inner surface visualization system
with vibration cancellation and trajectory smoothing
using only an optical monocular video camera. Re-
sults of experiments have demonstrated that the errors
and interrupts are lowered to a unnoticeable level and
the visualization performance is effectively improved.
Future improvements could include 3D recon-
struction of boreholes based on simple monocular de-
tector can be studied, involving Visual Simultaneous
Localising and Mapping (V-SLAM) which is one of
the most popular research topic in computer vision
and reconstruction fields. This system is tested by
commercial on-site utilization and it is believed to
continue to perform robustly in future development
of 2D to 3D modeling of boreholes as sophisticated
visualiser and stabiliser of borehole inner surface in-
spection.
ACKNOWLEDGEMENTS
This research is supported by Robertson Geologging
Ltd who provided access to equipment, software, ex-
pertise and commercial use cases to validate the ac-
cessibility and feasibility of the academic achieve-
ments as potential user products or services.
REFERENCES
Al-Sit, W., Al-Nuaimy, W., Marelli, M., and Al-Ataby, A.
(2015). Visual texture for automated characterisation
of geological features in borehole televiewer imagery.
Journal of Applied Geophysics, 119:139–146.
Beauchemin, S. S. and Bajcsy, R. (2001). Modelling and
removing radial and tangential distortions in spheri-
cal lenses. In Klette, R., Gimel’farb, G., and Huang,
T., editors, Multi-Image Analysis, pages 1–21, Berlin,
Heidelberg. Springer Berlin Heidelberg.
Bereska, D., Daniec, K., Fra
´
s, S., J˛edrasiak, K., Mali-
nowski, M., and Nawrat, A. (2013). System for multi-
axial mechanical stabilization of digital camera. In Vi-
sion Based Systemsfor UAV Applications, pages 177–
189. Springer.
Cardani, B. (2006). Optical image stabilization for digital
cameras. IEEE Control Systems Magazine, 26(2):21–
22.
Hartley, R. and Kang, S. B. (2007). Parameter-free radial
distortion correction with center of distortion Estima-
tion. IEEE Transactions on Pattern Analysis and Ma-
chine Intelligence, 29(8):1309–1321.
Mur-Artal, R. and Tardós, J. D. (2017). Orb-slam2:
An open-source slam system for monocular, stereo,
and rgb-d cameras. IEEE Transactions on Robotics,
33(5):1255–1262.
Pohl, C. and Genderen, J. L. V. (1998). Review article mul-
tisensor image fusion in remote sensing: Concepts,
methods and applications. International Journal of
Remote Sensing, 19(5):823–854.
Press, W. H. and Teukolsky, S. A. (1990). Savitzky-golay
smoothing filters. Computers in Physics, 4(6):669–
672.
Rajesh, R. J. and Kavitha, P. (2015). Camera gimbal sta-
bilization using conventional pid controller and evo-
lutionary algorithms. In 2015 International Con-
ference on Computer, Communication and Control
(IC4), pages 1–6.
Souza, M. and Pedrini, H. (2019). Digital video stabiliza-
tion: Algorithms and evaluation. In Anais Estendidos
do XXXII Conference on Graphics, Patterns and Im-
ages, pages 35–41, Porto Alegre, RS, Brasil. SBC.
Souza, M. R. and Pedrini, H. (2018). Digital video stabi-
lization based on adaptive camera trajectory smooth-
ing. EURASIP Journal on Image and Video Process-
ing, 2018(1):1–11.
Thiele, S. T., Lorenz, S., Kirsch, M., Cecilia Contreras
Acosta, I., Tusa, L., Herrmann, E., Möckel, R., and
Gloaguen, R. (2021). Multi-scale, multi-sensor data
integration for automated 3-d geological mapping.
Ore Geology Reviews, 136:104252.
GISTAM 2023 - 9th International Conference on Geographical Information Systems Theory, Applications and Management
78
