
TabProIS: A Transfer Learning-Based Model for Detecting Tables in
Product Information Sheets
Michael Sildatke
1
, Jan Delember
2
, Bodo Kraft
1
and Albert Zündorf
3
1
FH Aachen, University of Applied Sciences, Germany
2
Maastricht University, The Netherlands
3
University of Kassel, Germany
Keywords:
Table Detection, Transfer Learning, Document Images, Machine Learning, Model Optimization, Deep
Learning, Neural Networks.
Abstract:
Product Information Sheets (PIS) are human-readable documents containing relevant product specifications.
In these documents, tables often present the most important information. Hence, table detection is a crucial
task for automating the process of Information Extraction (IE) from PIS. Modern table detection algorithms
are Machine Learning (ML)-based and popular object detection networks like Faster R-CNN or Cascade
Mask R-CNN form their foundation. State-of-the-art models like TableBank or CDeCNet are trained on
publicly available table detection datasets. However, the documents in these datasets do not cover particular
characteristics of PIS, e.g., background design elements like provider logos or watermarks. Consequently,
these state-of-the-art models do not perform well enough on PIS. Transfer Learning (TL) and Ensembling
describe two methods of reusing existing models to improve their performance on a specific problem. We
use these techniques to build an optimized model for detecting tables in PIS, named TabProIS. This paper
presents three main contributions: First, we provide a new table detection dataset containing 5,600 document
images generated from PIS of the German energy industry. Second, we offer three TL-based models with
different underlying network architectures, namely TableBank, CDeC-Net, and You Only Look Once (YOLO).
Third, we present a pipeline to automatically optimize available models based on different Ensembling and
post-processing strategies. A selection of our models and the dataset will be publicly released to enable the
reproducibility of the results.
1 INTRODUCTION
Table analysis is a well-recognized research area with
an increasing trend in the number of publications for
the last five years (Hashmi et al., 2021). Table un-
derstanding includes three steps: Table Detection fo-
cuses on detecting boundaries as bounding boxes in
documents, Table Segmentation aims to determine the
structure of a table regarding rows and columns, and
Table Recognition combines segmentation and infor-
mation parsing (Zhong et al., 2020). Therefore, table
detection is an essential requirement and a crucial task
in automated Information Extraction (IE) from tables
(Sildatke et al., 2022b).
A vast number of Machine Learning (ML) ta-
ble detection models based on different object detec-
tion networks like Faster R-CNN (Ren et al., 2016)
or Cascade R-CNN (Cai and Vasconcelos, 2017)
emerged. TableBank is a popular example using
Faster R-CNN as a basis and a custom dataset with
over 417,000 document images for training (Li et al.,
2019). CDeC-Net uses Cascade R-CNN (Agarwal
et al., 2020) and is trained on publicly available
datasets like ICDAR-2013 or ICDAR-2019 (Gobel
et al., 2013; Gao et al., 2019). Both models achieve
excellent results with F1 scores over 95% and there-
fore represent the latest state-of-the-art. Hence, they
are promising candidates for detecting tables in Prod-
uct Information Sheets (PIS).
PIS are human-readable documents presenting
product information to customers. Among tables,
these sheets often contain elements to attract the at-
tention of potential customers, like product pictures
or company logos. Modern companies often provide
services based on information originating from PIS,
e.g., price comparison portals. Since employees of-
ten have to extract relevant information by hand, IE
processes are time-consuming and expensive. Hence,
Sildatke, M., Delember, J., Kraft, B. and Zündorf, A.
TabProIS: A Transfer Learning-Based Model for Detecting Tables in Product Information Sheets.
DOI: 10.5220/0011840700003497
In Proceedings of the 3rd International Conference on Image Processing and Vision Engineering (IMPROVE 2023), pages 27-36
ISBN: 978-989-758-642-2; ISSN: 2795-4943
Copyright
c
2023 by SCITEPRESS – Science and Technology Publications, Lda. Under CC license (CC BY-NC-ND 4.0)
27
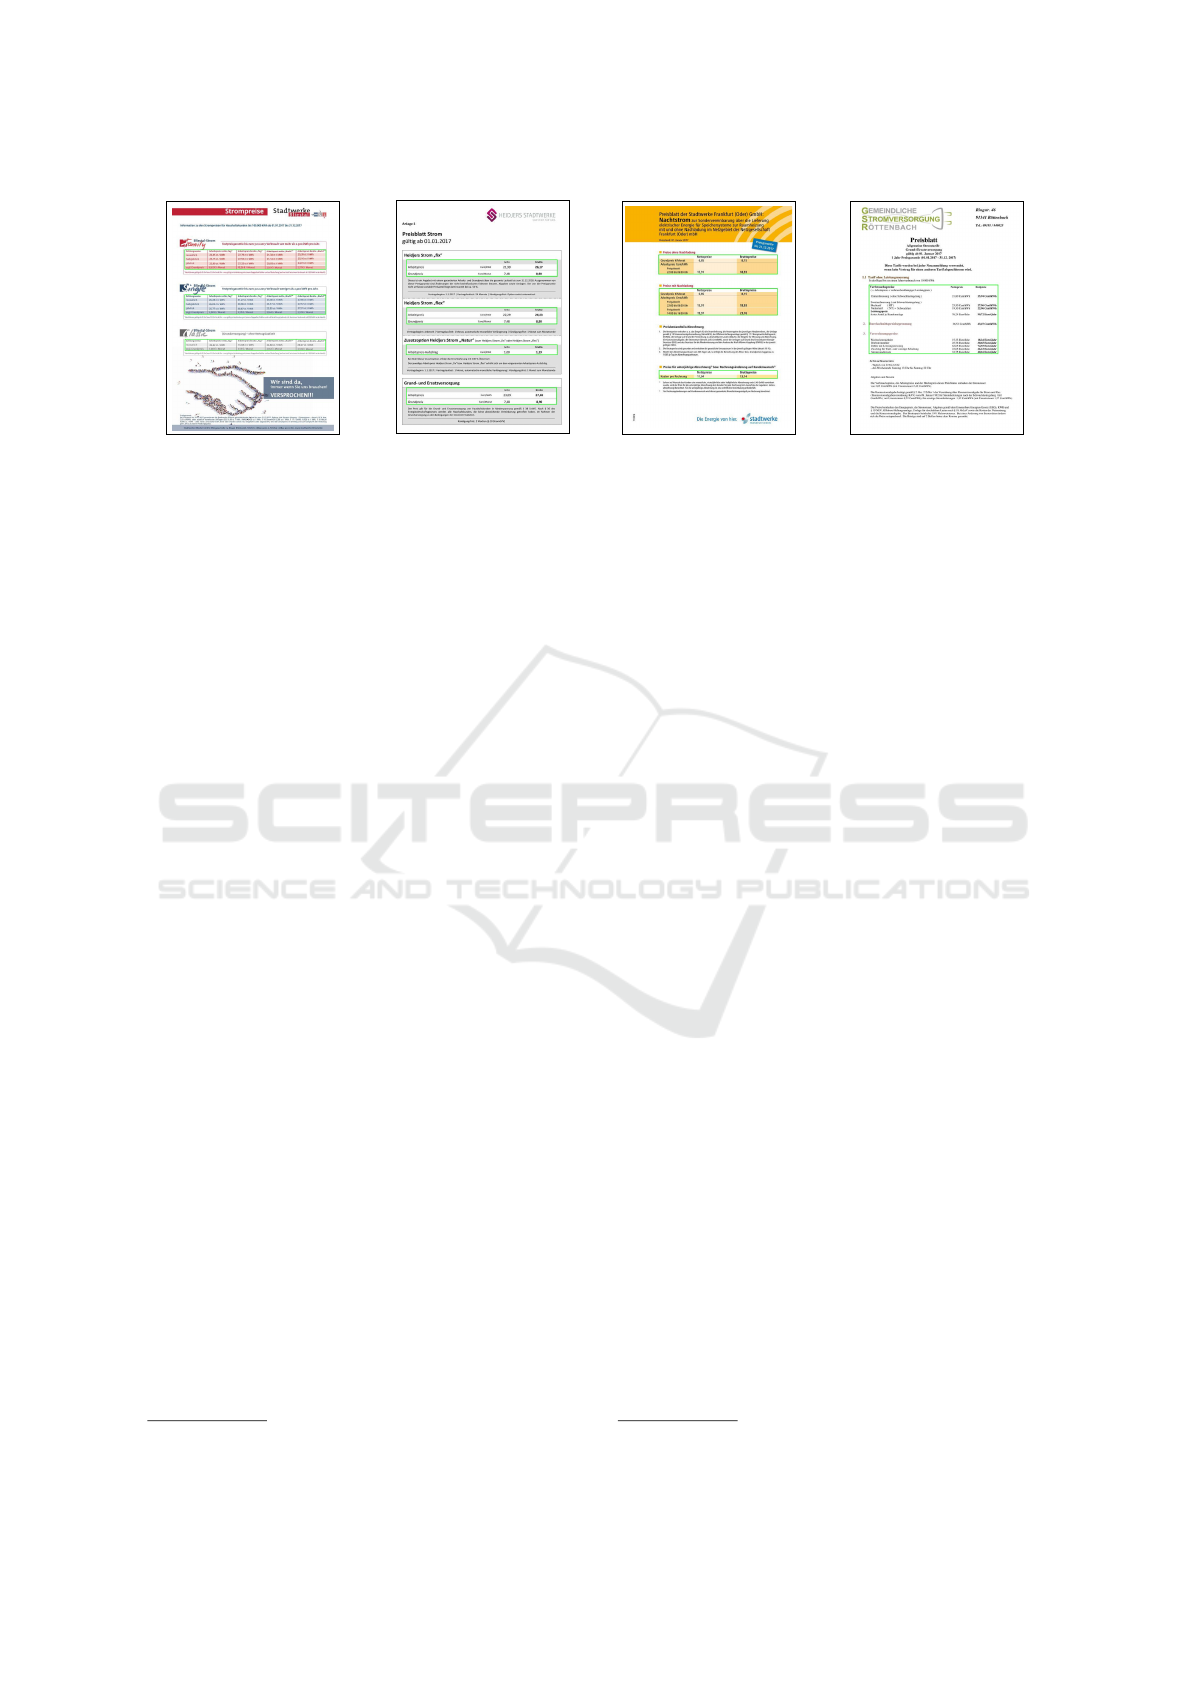
(a) Example with Logos
and Background Images
(b) Example with Sur-
rounding Boxes
(c) Example with Colored
Tables
(d) Example with a Table
as Part of an Enumeration
Figure 1: TableBank and CDeC-Net not Detecting Expected Tables (Marked Green) in Product Information Sheets (PIS).
service providers try to automate these processes us-
ing the newest findings from research. However, pub-
licly available datasets mainly originate from scien-
tific papers and do not cover particular characteristics
of PIS. Consequently, state-of-the-art models such as
TableBank or CDeC-Net cannot detect tables in PIS
well enough. Figure 1 shows four examples of PIS in
which TableBank and CDeC-Net do not detect any of
the expected tables.
This circumstance indicates the need for a custom
dataset that covers all relevant characteristics of PIS to
evaluate existing models appropriately and train new
specialized models for detecting tables in PIS. Trans-
fer Learning (TL) describes a technique to adapt ex-
isting models and specialize them for different but re-
lated use cases (Torrey and Shavlik, 2009). Based
on this method, we specialize the existing state-of-
the-art table detection models TableBank and CDeC-
Net on PIS. Since YOLO is the state-of-the-art algo-
rithm for general object detection (Bochkovskiy et al.,
2020), we also use it to train a specialized model
for detecting tables in PIS. Furthermore, we combine
the TL-based models to generate model results us-
ing different Ensembling strategies. Ensembling de-
scribes methods for combining several model outputs
to generate more appropriate results. (Zhang and Ma,
2012). Due to customizable model parameters like
the ensemble strategy, thresholds, or confidences, the
number of possible resulting models is vast. For this
reason, we automate the model optimization process
by implementing a pipeline that automatically finds
the best available parameter setting.
In order to tackle the challenges mentioned above,
this paper presents three main contributions:
1. We provide the TabProDS
1
dataset containing
5,600 document images that originate from PIS
of the German energy industry.
1
https://github.com/msildatke/TabProDS
2. We offer three TL models for detecting tables in
PIS, based on different state-of-the-art architec-
tures, namely TableBank, CDeC-Net, and YOLO.
3. We present a pipeline to automatically optimize
available models based on different ensemble and
post-processing strategies to find the best one,
called TabProIS
2
.
This paper is structured as follows: Section 2 pro-
vides background information about the challenges
and related works. Section 3 introduces the frame-
work for training TabProIS, providing the dataset, TL
models, and the model optimization pipeline. Sec-
tion 4 shows the evaluation of the resulting models,
and Section 5 concludes this paper.
2 BACKGROUND
This section provides background information about
the challenges in table detection as a subproblem of
object detection. Furthermore, it describes related
works and builds the foundation for the model eval-
uation.
2.1 Object & Table Detection Models
As a branch of deep learning, Object Detection deals
with finding objects in images or videos (Zou et al.,
2019). In the context of TL, pre-trained object detec-
tion models like ImageNet (Krizhevsky et al., 2012),
ZF-Net (Zeiler and Fergus, 2013), or COCO (Lin
et al., 2015) often form the basis for specializations.
More sophisticated models like Fast R-CNN (Gir-
shick, 2015) and Faster R-CNN (Ren et al., 2016) use
them as a base layer and, in turn, serve as a basis for
TL-based table detection models. Popular examples
2
https://github.com/msildatke/TabProIS
IMPROVE 2023 - 3rd International Conference on Image Processing and Vision Engineering
28

are introduced by (Gilani et al., 2017), (Das et al.,
2018), (Siddiqui et al., 2018), and (Li et al., 2019).
Mask R-CNN extends the Faster R-CNN model (He
et al., 2018), and some approaches like (Cai and Vas-
concelos, 2017), (Agarwal et al., 2020), and (Prasad
et al., 2020) use it to provide specialized table detec-
tion models. Another approach shows the benefits of
close-domain fine-tuning for table detection in docu-
ment images based on different model architectures
(Casado-Garcia et al., 2019). TableBank (Li et al.,
2019) and CDeC-Net (Agarwal et al., 2020) are pop-
ular examples of TL models that use these object de-
tection networks as a basis and perform excellently
on public benchmark datasets. Finally, YOLO is the
state-of-the-art algorithm for solving general object
detection problems (Bochkovskiy et al., 2020).
2.2 Table Detection Datasets
Various publicly available datasets serve two pur-
poses: a) training table detection models and b) com-
paring and evaluating the results of different table de-
tection models. In this paper, we focus on the datasets
that were used to train and evaluate the selected candi-
date models. The ICDAR-2013 dataset is introduced
by (Gobel et al., 2013) and has annotations for ta-
ble detection and recognition. It contains 238 im-
ages converted from PDF files, of which 128 incor-
porate tables. (Gao et al., 2017) provide the ICDAR-
2017-POD dataset. It is widely used and contains
more examples than the ICDAR-2013 dataset, with
2417 images and 1081 table annotations. The UNLV
dataset is made available by (Taghva et al., 2000) and
is composed of approximately 10,000 scanned docu-
ments, of which 427 contain tables. The ICDAR-2019
dataset was published as a foundation for the Com-
petition on Table Detection and Recognition and con-
tains 3,600 documents split into two separate datasets.
The first contains modern documents, while the sec-
ond contains historical and handwritten documents
(Gao et al., 2019). (Fang et al., 2012) present the
Marmot dataset that contains 2,000 document images
originating from English and Chinese conference pa-
pers. Finally, (Li et al., 2019) introduce TableBank, a
dataset that contains 417,000 images originating from
Word and L
A
T
E
X documents.
However, Subsection 3.2 shows that existing
datasets do not cover essential characteristics of PIS,
so that state-of-the-art models fail detecting tables in
PIS appropriately.
2.3 Performance Metrics
Intersection over Union (IoU) is the standard eval-
uation metric in object detection (Rezatofighi et al.,
2019), described by the following formula:
Area o f Overlap Regions
Area o f Union Area
(Shafait and Smith, 2010) determine the number of
true and false positive table predictions based on IoU
to calculate precision, recall, and f-measure.
However, when using IoU-based performance
measures, there is always the question of the opti-
mal choice of an appropriate threshold. Therefore,
we refer to the following threshold-independent and
area-based performance measures, also introduced by
(Shafait and Smith, 2010):
A. AreaPrecision
Indicates the percentage of detected table regions
that belong to ground truth regions.
Area o f Ground Truth Regions in Detected Regions
Area o f All Detected Table Regions
i.e.,
∑
i
∑
j,k
area(D
i j
∩ G
ik
)
∑
i
∑
j
area(D
i j
)
,
with each D
i j
and G
ik
, representing the k
th
detec-
tion box and j
th
ground truth box on the i
th
image,
respectively.
B. AreaRecall
Indicates the percentage of ground truth regions
the model detects correctly.
Area o f Ground Truth Regions in Detected Regions
Area o f All Ground Truth Table Regions
i.e.,
∑
i
∑
j,k
area(D
i j
∩ G
ik
)
∑
i
∑
k
area(G
ik
)
,
with the same definitions as above.
C. F1 Score
Considers area precision and area recall to com-
pute the threshold-independent performance of a
model.
2 ·
AreaPrecision · AreaRecall
AreaPrecision + AreaRecall
2.4 Ensembling Strategies & Methods
In object detection, bounding boxes mark relevant im-
age parts as objects of interest (Zou et al., 2019).
TabProIS: A Transfer Learning-Based Model for Detecting Tables in Product Information Sheets
29

Applying Ensembling methods leads to the problem
of finding the most accurate bounding box combin-
ing several model results. Weighted Boxes Fusion
(WBF) and Non-Maximum Suppression (NMS) are
algorithms using IoU to determine boxes describing
the same object. Based on that, they efficiently reduce
a set of detected bounding boxes (Solovyev et al.,
2021; Zhou et al., 2017).
(Casado-Garcia and Heras, 2020) have shown that
applying Ensembling methods can improve the detec-
tion quality of models. Furthermore, they introduce
three strategies to improve the Ensembling quality,
which we adapt for our use case. To achieve this, we
define a list LD = [D
1
, ..., D
n
] where n is the num-
ber of table detection models and each D
i
contains
the list of respective model predictions. Based on the
IoU of the model predictions, we define object groups
O = [O
1
, ..., O
m
] that describe predictions related to
m objects. The related predictions of a specific ob-
ject O
i
are described by OD
i
= [OD
O
i
1
, ..., OD
O
i
l
] with
l describing the index of the predicting model with
|OD
i
| = n, if all models generate a prediction related
to a specific object. Based on this definitions, we de-
fine three Ensembling strategies as follows:
1. Affirmative.
Each object O
i
is kept for ensemble if |OD
i
| ≥ 1.
This means that at least one model has to make a
prediction about a potential object.
2. Consensus.
Each object O
i
is kept for ensemble if |OD
i
| ≥
n
2
.
This strategy is also known as Majority Voting.
3. Unanimous.
Each object O
i
is kept for ensemble if |OD
i
| = n.
This means that each model has to make a predic-
tion about a potential object.
Applying a specific strategy filters object candidates
for the actual Ensembling.
3 TRAINING FRAMEWORK
This section presents our TabProIS framework pro-
viding the TabProDS dataset, our TL models, and a
pipeline to optimize model performances based on
Ensembling and post-processing steps.
3.1 TabProDS Dataset
Since the above-mentioned publicly available datasets
do not represent particular characteristics of PIS, we
created the TabProDS dataset. The dataset contains
5,600 document images, of which 4,496 have table
annotations in the COCO format. The source of these
documents are PIS which describe electricity prod-
ucts from the German energy industry. Initially, prod-
uct providers published the documents in PDF for-
mat on their websites. Subsection 3.2 shows in detail
that some of these characteristics lead to poorly per-
forming model candidates. We randomly picked 15%
of the 5,600 annotated images into a fixed validation
dataset, which resulted in 840 samples. The valida-
tion dataset is a basis for the independent evaluation
and comparison of different models. We split the re-
maining 4,760 documents into 838 randomly picked
test and 3,922 training samples for each model train-
ing. To guarantee a high annotation quality, we cal-
culated an inter-annotator agreement between all an-
notators referring to (Fleiss et al., 2003). With a cal-
culated kappa of 0.82, the agreement can be classified
as almost perfect following (Viera and Garrett, 2005).
3.2 Transfer Learning Models
In our experiments, TableBank, CDeC-Net, and
YOLO serve as base models for detecting tables in
PIS. Table 1 shows the performance of TableBank and
CDeC-Net on our validation dataset. Since YOLO
only provides general object detection models, we can
not explicitly evaluate the performance of any avail-
able base model on our dataset.
Table 1: Performance of the Base Models.
Model Precision Recall F1 Score
TableBank 0.84 0.50 0.63
CDeC-Net 0.73 0.86 0.79
The evaluation of the base models on our valida-
tion dataset shows that available state-of-the-art mod-
els do not perform well enough as a requirement for
the automated IE from PIS. Therefore, we use our
TabProDS dataset to specialize these base models for
detecting tables in PIS by applying TL. We run all
TL experiments on a workstation with three NVIDIA
Quadro RTX 8000, providing 48 GB VRAM each.
3.2.1 TableBank Fine-Tuning
(Li et al., 2019) use the open-source object detection
framework detectron2 (Wu et al., 2019), based on Py-
Torch, to train TableBank. The authors provide mod-
els with two different versions of ResNeXt as network
baseline, i.e., X101 and X152. They use three datasets
for training. The first one contains about 163,500 doc-
ument images originating from Word documents. The
second one contains about 253,800 document images
from L
A
T
E
X documents. The third one combines the
previous ones, resulting in about 417,300 samples.
IMPROVE 2023 - 3rd International Conference on Image Processing and Vision Engineering
30
Our evaluation has shown that the X101(L
A
T
E
X) model
performs best on the TabProDS dataset. Therefore,
we use the pre-trained X101(L
A
T
E
X) model to train our
fine-tuned TableBankf (TBf ) model.
We experiment with different base learning rates
ranging from 0.005 to 0.1 and various levels of back-
bone freezing (0 to 5 stages). We achieve the best
results without freezing any stages, aiming at com-
pletely recalculating the model weights. All experi-
ments run 125,000 iterations with a batch size of 4.
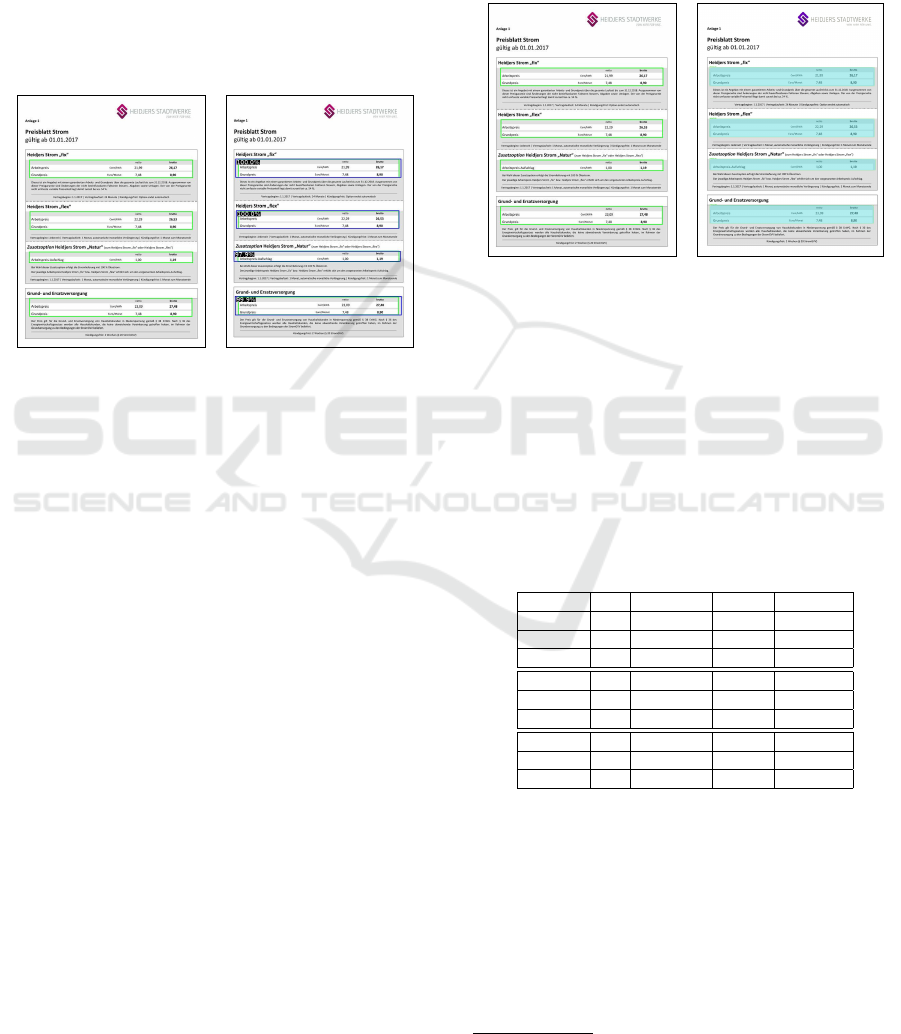
Figure 2 shows an exemplary prediction comparison
of TableBank and TBf .
(a) TableBank (b) TableBankf (TBf )
Figure 2: Exemplary Prediction Comparison of TableBank
and TableBankf (TBf ).
3.2.2 CDeC-Net Fine-Tuning
(Agarwal et al., 2020) use the MMdetection tool-
box (Chen et al., 2019) based on PyTorch to train
their CDeC-Net table detection model. The back-
bone of CDeC-Net is a ResNeXt-101 pre-trained on
MS-COCO, while a Feature Pyramid Network (FPN)
(Lin et al., 2017) forms the network head. The au-
thors provide different models trained on various pub-
licly available datasets. Our experiments show that
CDeC-Net trained on the ICDAR-2013 dataset per-
forms best on our TabProDS dataset. Therefore, we
use this model’s base settings and weights for TL,
experimenting with different base learning rates and
stage freezes. Our best TL-based CDeC-Net, CDeC-
Netf (CDeCf ), trains 50 epochs with an initial learn-
ing rate lr = 0.00125 and two frozen stages.
Figure 3 shows an exemplary prediction compari-
son of CDeC-Net and CDeCf .
3.2.3 YOLO Fine-Tuning
Since YOLO does not provide a specific model for
table detection, we have to train one from scratch.
For training, we use the Python implementation
YOLOv5
3
which is also based on PyTorch. We
test different sizes of the YOLO network, namely
YOLOv5s, YOLOv5l, and YOLOv5x. To speed up
convergence, we experiment with setting the initial
weights from different checkpoints. We achieve the
best results using the YOLOv5x network which scales
input images to a size of 1280×1546 pixels. Table 2
shows the results of YOLOf.
(a) CDeC-Net (b) CDeC-Netf (CDeCf )
Figure 3: Exemplary Prediction Comparison of CDeC-Net
and CDeC-Netf (CDeCf ).
3.2.4 Performance of the Fine-Tuned Models
The evaluation of our fine-tuned models shows
that performance heavily depends on the confidence
threshold C of predictions (c.f. Table 2). While TBf
and CDeCf reach their best F1 scores with a confi-
dence threshold C = 0.8, YOLOf performs best with
C = 0.7.
Table 2: Performance of the Fine-Tuned Models.
Model C Precision Recall F1 Score
TBf 0.7 0.840 0.930 0.883
CDeCf 0.7 0.875 0.903 0.889
YOLOf 0.7 0.891 0.860 0.875
TBf 0.8 0.887 0.903 0.895
CDeCf 0.8 0.899 0.881 0.890
YOLOf 0.8 0.903 0.797 0.847
TBf 0.9 0.921 0.839 0.878
CDeCf 0.9 0.922 0.837 0.877
YOLOf 0.9 0.923 0.626 0.746
By performing TL, we improve the F1 score for
TableBank by +26%- and CDeC-Net by +10%-points.
3.3 Post-Processing
As shown in Figure 4, the models sometimes make
so-called Table-in-Table Predictions (TiTPs). In con-
trast to classic object detection problems, there are no
tables in front of each other in our use case. There-
3
https://github.com/ultralytics/yolov5
TabProIS: A Transfer Learning-Based Model for Detecting Tables in Product Information Sheets
31
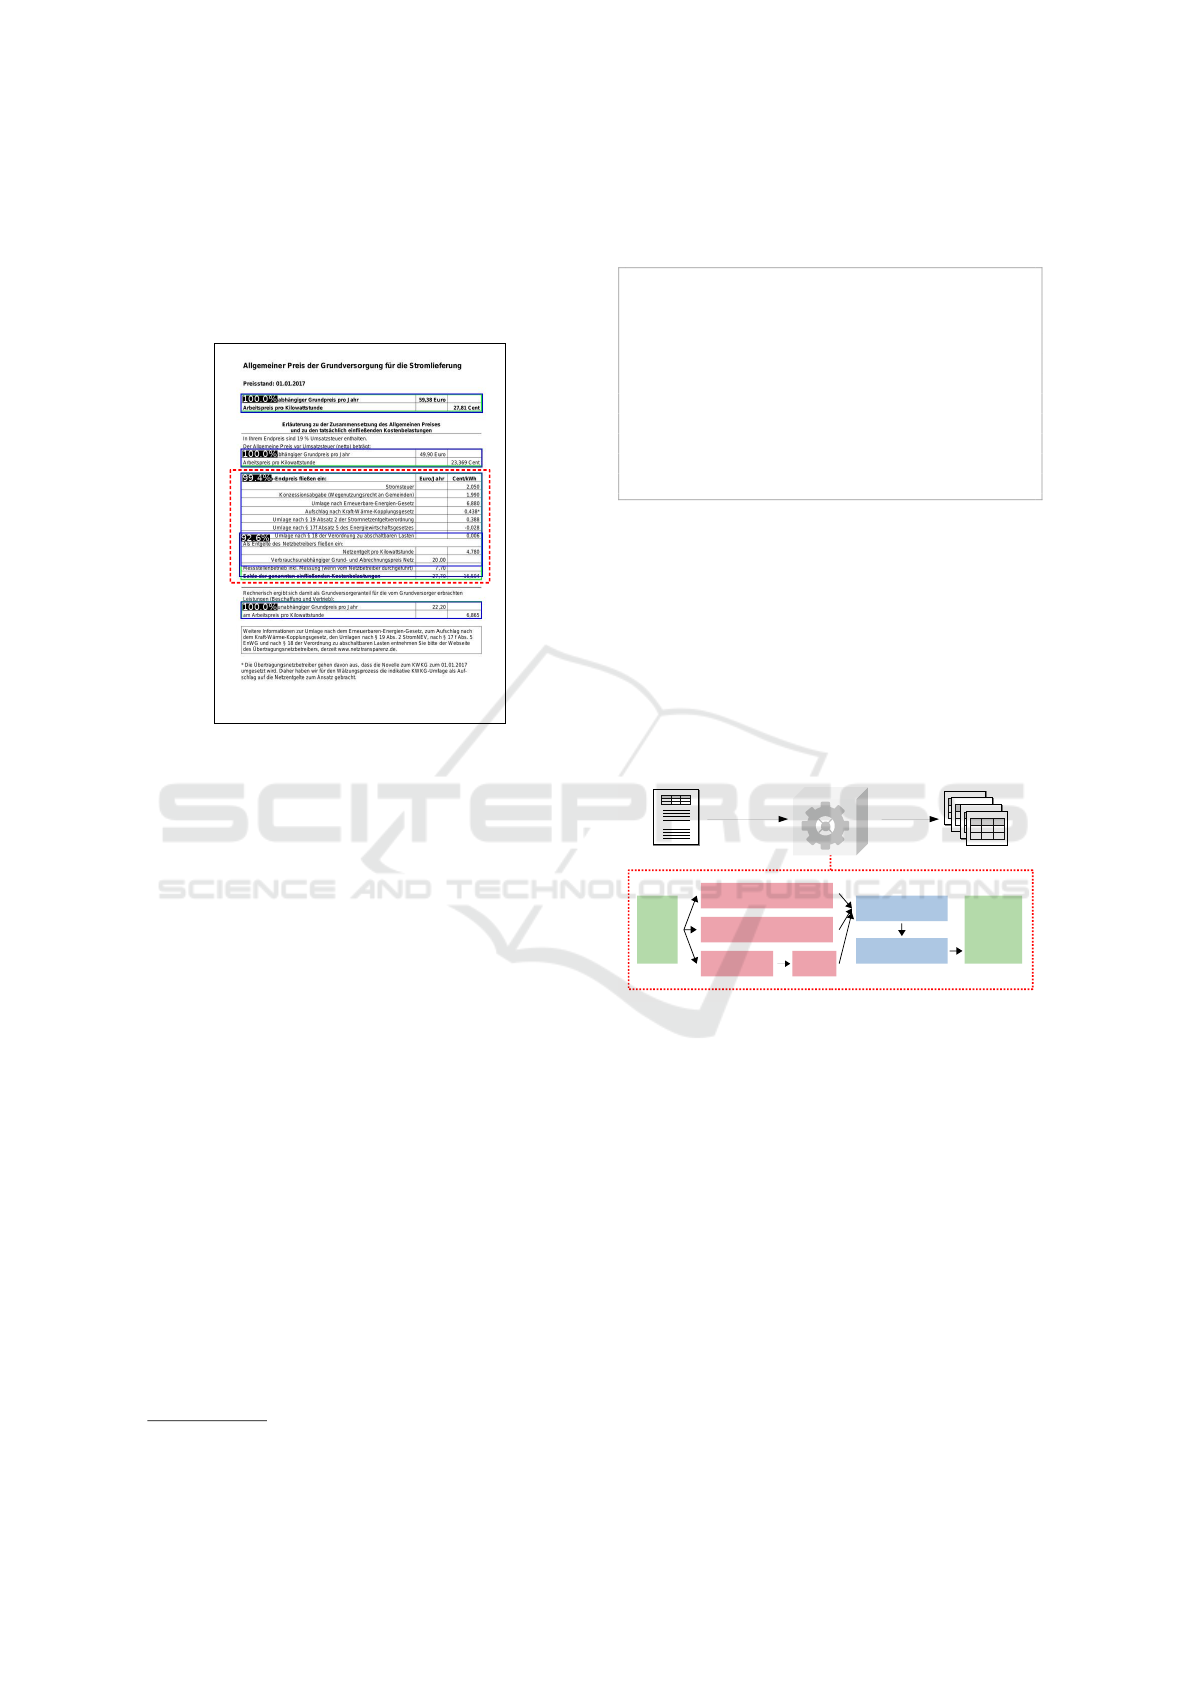
fore, we delete the predicted inner tables improving
the performance. Since the IoU of the red-bordered
predictions (99.4% and 92.6%) is relatively small, En-
sembling does not remove the inner box. Hence, we
must implement specific post-processing steps to re-
move TiTPs automatically.
Figure 4: Table-in-Table Prediction (TiTP).
To achieve automatic removal of TiTPs, we it-
erate over each combination of predicted bounding
boxes (B
n
, B
m
) and calculate the intersection area of
these boxes. If the intersection area A
I
is equal to
the area of one of the bounding boxes A
B
n
or A
B
m
,
the corresponding box will be removed. Addition-
ally, we introduce a threshold 0 < IoU
PP
≤ 1 that sup-
ports the post-processing so that each bounding box
B
i
will be removed if any resulting intersection area
I
A
i
≤ IoU
PP
· area(B
i
).
3.4 Microservice Implementation
According to (Sildatke et al., 2022a), we implement
our resulting model as a FastAPI
4
microservice to
easily use it for complex IE pipelines. (Sildatke et al.,
2022a) introduce the ARTIFACT framework which
harmonizes IE processes by splitting them into the
tasks of document conversion, decomposition, and
extraction. ARTIFACT enables developers to imple-
ment components like Converters, Decomposers, or
Extractors that each solve a specific task, e.g., the
detection of tables in a PdfDocument. Each compo-
nent has to provide an endpoint offering service in-
formation (\info) and one for the actual operation.
Following the convention of (Sildatke et al., 2022a),
we implement our table detection as a Converter
4
https://fastapi.tiangolo.com/
component that provides a \convert endpoint. Code
Listing 1 shows the \info endpoint of our compo-
nent.
@controller.get("/info",
→ response_model=
→ ComponentEndpointInfo)
def get_info():
return ComponentEndpointInfo(
name="PISTableDetector",
consumes="PdfDocument",
produces="ImageDocument",
version="1.0.0",
endpoint="/convert"
)
Code Listing 1: Info Endpoint of PISTableDetector.
Internally, the microservice converts each page of
the input PdfDocument into a single image. For each
image, it requests all models to predict tables, i.e.
TBf , CDeCf , and YOLOf. Afterwards, it generates
ensemble predictions according to the selected strat-
egy and method. Finally, it post-processes the ensem-
ble predictions and returns the corresponding sections
of the images as a list of ImageDocuments (c.f. Fig-
ure 5).
PISTableDetector
TableBank_f
CDeC-Net_f
YOLO_f
Pdf-
To-
Img
Conv.
COCO-
To-
Img
Ensembling
Post-Process.
PDF
/convert
Figure 5: Microservice Implementation.
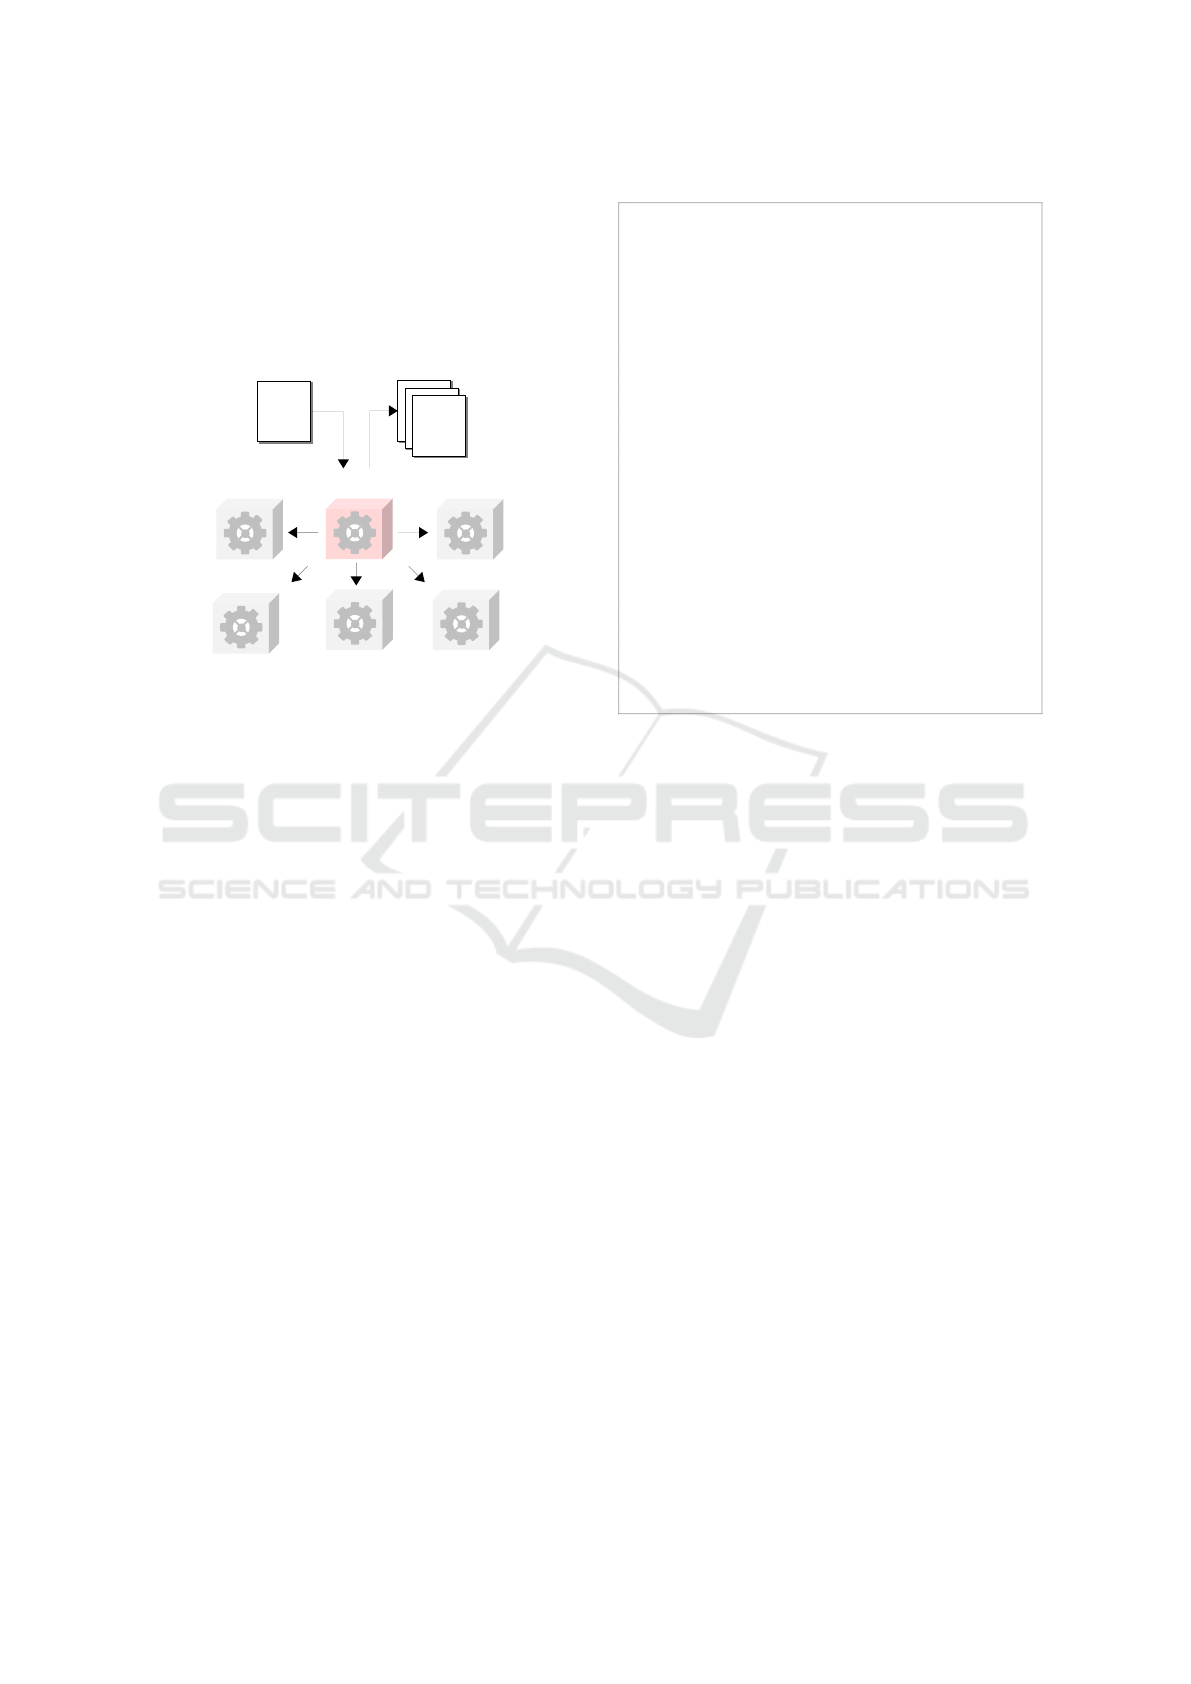
3.5 Model Optimization Pipeline
There are a large number of possible model vari-
ants based on various parameters such as Ensembling
strategies and methods as well as IoU thresholds and
model confidences. To find the optimal variant, we
provide a model optimization pipeline that automati-
cally evaluates a predefined set of different parameter
settings. For this, we formalize the following param-
eter options that serve as input for the optimization
pipeline:
• A list of non-filtered model results MR
• A list of model combinations MC
• A list of IoU thresholds for Ensembling IoU
Ens
• A list of Ensembling strategies E
S
• A list of Ensembling methods E
M
IMPROVE 2023 - 3rd International Conference on Image Processing and Vision Engineering
32
• A list of intersection area thresholds for post-
processing IoU
PP
We implement the pipeline as a CLI application
with Python. It processes the relevant input parame-
ters and produces the resulting model metrics as out-
put (c.f. Figure 6).
Filtering
Ensembling
Pre-
Processing
Evaluation
CLI App
Model =
{...}
Scores =
{...}
Model =
{...}
Scores =
{...}
Model =
{...}
Scores =
{...}
Model =
{...}
Scores =
{...}
Model =
{...}
Scores =
{...}
Model =
{...}
Scores =
{...}
Params=
{...}
Params=
{...}
Predicting
Parameters Metrics
Figure 6: Model Optimization Pipeline.
Based on the input parameters, the model opti-
mization starts with predicting results for each se-
lected model on the validation dataset with a confi-
dence threshold C = 0. It produces annotation files
for each model in COCO format, while converting the
respective YOLO annotations. During the result fil-
tering step, the optimizer filters previously generated
results according to the desired confidences. It com-
bines the filtered model results using the given En-
sembling strategies and methods. Based on the pre-
defined intersection area thresholds, the optimizer fi-
nally post-processes each of the Ensembling results.
The evaluation step marks the end of the optimization
pipeline, evaluating each output of the previous steps.
As a result, this step produces a list of all models and
their performance metrics, ordered by F1 score.
4 EVALUATION
Our model optimization pipeline allows the configu-
ration of different parameters influencing the result-
ing models. As shown in Code Listing 2, we trig-
ger the model optimization pipeline to evaluate the
model performances using default parameters. The
EvaluationRunner generates predictions for each
model in the validation step and runs the evaluation
to determine the requested performance metrics.
if __name__ =="__main__":
args=ArgumentParser().parse_args()
if len(args)==1: # Default Params
model_results =EvaluationRunner.predict(
models=["tb_f", "cdec_f", "yolo_f"]
)
EvaluationRunner.evaluate(
model_results= model_results,
model_confidences= [0.7, 0.8, 0.9],
model_combinations= [
("tb_f", "cdec_f", "yolo_f"),
("tb_f", "cdec_f"),
("tb_f", "yolo_f"),
("cdec_f", "yolo_f")
],
ensemble_iou_thresholds= [
0.1, 0.2, 0.5, 0.8
],
ensemble_strategies= [1, 2, 3],
ensemble_methods= [1, 2],
postprocessing_area_thresholds=[
0.7, 0.8, 0.9
]
)
Code Listing 2: Starting an Evaluation Run.
Based on this configuration, the model optimization
pipeline automatically calculates the performance for
over 3,800 different model variants. Table 3 shows a
selection of the resulting model performances. The
complete evaluation results will be available in the
provided GitHub repository. As shown in Table 3, we
gathered several insights during the evaluation:
• Applying Ensembling and post-processing leads
to an improvement of +2% for the F1 score (c.f.
Table 3a).
• The WBF method is sensitive to the selected IoU
threshold, performing better for higher ones (c.f.
Table 3b).
• Lower IoU thresholds for Ensembling can com-
pensate for lower model confidence values (c.f.
Table 3c).
• Applying Ensembling and post-processing com-
pensates for lower model confidence values most
effectively (c.f. Table 3d).
We also gathered other insights that can be
gleaned from the published results in the provided
GitHub repository, including:
• The best model combination does not necessar-
ily have to be the combination of the best single
models; e.g., YOLOf solely performs better with
a confidence C = 0.7, while the best Ensembling
model selects a threshold of C = 0.9 for YOLOf.
TabProIS: A Transfer Learning-Based Model for Detecting Tables in Product Information Sheets
33

Table 3: Selected Results of the Evaluation
TB_f CDeCf YOLOf IoU
Ens
Strategy Method IoU
PP
Precision Recall F1 Score
0.8 - - - - - - 0.887 0.903 0.895
- 0.8 - - - - - 0.899 0.881 0.890
- - 0.7 - - - - 0.891 0.860 0.875
0.8 0.8 0.7 0.5 Affirm. NMS - 0.770 0.942 0.848
0.8 0.8 0.7 0.5 Affirm. WBF - 0.767 0.948 0.848
0.8 0.8 0.7 0.5 Consens. NMS - 0.907 0.862 0.884
0.8 0.8 0.7 0.5 Consens. WBF - 0.903 0.868 0.885
0.8 0.8 0.7 0.5 Unani. NMS - 0.907 0.862 0.884
0.8 0.8 0.7 0.5 Unani. WBF - 0.945 0.690 0.797
0.8 0.9 0.9 0.5 Affirm. WBF - 0.825 0.934 0.876
0.8 0.9 0.9 0.5 Affirm. WBF 0.7 0.897 0.933 0.914
(a) Results Showing Better Overall Performance Applying Ensembling + Post-Processing
TBf CDeCf YOLOf IoU
Ens
Strategy Method IoU
PP
Precision Recall F1 Score
0.8 0.9 0.9 0.1 Affirm. WBF 0.7 0.908 0.892 0.900
0.8 0.9 0.9 0.1 Affirm. WBF 0.8 0.908 0.892 0.900
0.8 0.9 0.9 0.1 Affirm. WBF 0.9 0.907 0.892 0.900
0.8 0.9 0.9 0.8 Affirm. WBF 0.7 0.900 0.877 0.888
0.8 0.9 0.9 0.8 Affirm. WBF 0.8 0.900 0.934 0.916
0.8 0.9 0.9 0.8 Affirm. WBF 0.9 0.895 0.942 0.918
(b) Results Showing That WBF is Better For Greater IoU-Thresholds
TBf CDeCf YOLOf IoU
Ens
Strategy Method IoU
PP
Precision Recall F1 Score
0.7 0.7 0.7 0.1 Affirm. WBF - 0.874 0.901 0.888
0.7 0.7 0.7 0.2 Affirm. WBF - 0.848 0.922 0.883
0.7 0.7 0.7 0.5 Affirm. WBF - 0.742 0.953 0.835
0.7 0.7 0.7 0.8 Affirm. WBF - 0.645 0.960 0.772
(c) Results Showing Lower IoU-Thresholds for Ensembling Compensate Lower Model Confidences
TBf CDeCf YOLOf IoU
Ens
Strategy Method IoU
PP
Precision Recall F1 Score
0.7 0.7 0.7 0.1 Affirm. WBF 0.9 0.880 0.901 0.890
0.7 0.7 0.7 0.2 Affirm. WBF 0.9 0.865 0.922 0.893
0.7 0.7 0.7 0.5 Affirm. WBF 0.9 0.855 0.952 0.901
0.7 0.7 0.7 0.8 Affirm. WBF 0.9 0.859 0.959 0.906
(d) Results Showing Post-Processing + Ensembling Compensate Lower Model Confidences Best
Note: TBf , CDeCf and YOLOf are the confidence thresholds of the respective models.
• TBf and CDeCf are always part of the excellently
performing Ensembling models, while the impact
of YOLOf is less significant.
• The NMS method is also sensitive to IoU thresh-
olds, performing better for lower ones.
• The Affirmative strategy creates models with the
highest F1 score (91.18%) because it improves
precision, while Unanimous and Consensus pro-
duce models with the highest recall (95.8%).
The evaluation shows that combining Ensembling
with specific post-processing can improve the perfor-
mance of TL models. However, the prediction time of
the resulting models increases, since not only one, but
each model has to make its prediction. Nevertheless,
since the targeted IE processes do not require real-
time responses, such as object detection problems in
videos, a longer processing time is quite acceptable.
IMPROVE 2023 - 3rd International Conference on Image Processing and Vision Engineering
34

5 CONCLUSION
Product Information Sheets (PIS) contain essential
product specifications and are often the starting point
for complex Information Extraction (IE) processes.
They form the basis for digital services of modern
companies, like price comparison portals. Since PIS
are human-readable, employees of these companies
usually have to extract relevant information by hand.
The companies concerned try to automate these pro-
cesses in order to reduce costs and minimize their du-
ration.
Since tables frequently present relevant informa-
tion in PIS, table detection is crucial in automating
the processes. For this reason, a vast number of Ma-
chine Learning (ML)-based models emerged in re-
cent years, based on popular object detection net-
works such as Faster R-CNN or Cascade R-CNN.
State-of-the-art models, such as TableBank or CDeC-
Net, are trained on publicly available table detec-
tion datasets like ICDAR-2013 or ICDAR-2019, and
achieve excellent performance results with F1 scores
over 95%. However, since PIS have particular char-
acteristics that these public datasets do not cover, the
performance of TableBank and CDeC-Net on PIS is
insufficient.
In this paper, we provided a new table detection
dataset, named TabProDS, containing 5,600 docu-
ment images from PIS of the German energy indus-
try to harmonically evaluate the performance of table
detection models on PIS. Applying Transfer Learning
(TL)-methods on TableBank , CDeC-Net, and YOLO,
we used this dataset to train optimized models for de-
tecting tables in PIS appropriately. We experimented
with different Ensembling strategies (i.e., Affirma-
tive, Consensus, and Unanimous) and methods (i.e.,
Weighted Boxes Fusion (WBF) and Non-Maximum
Suppression (NMS)) to further improve the quality of
the TL models. Additionally, we implemented post-
processing steps to remove so-called Table-in-Table
Predictions (TiTP). A specific model variant depends
on many parameters, e.g., the selected Ensembling
strategy and method, as well as different thresholds.
Consequently, the number of possible model variants
is very large. Therefore, we implemented a model
optimization pipeline that automatically evaluates the
quality of the resulting models based on a predefined
set of parameters.
We evaluated over 3,800 different model variants
and gathered several insights. The evaluation has
shown that combining Ensembling with specific post-
processing steps can compensate for lower model
confidences. Also it has shown that applying TL im-
proves the F1 score of TableBank by 26%- (from 63%
to 89%) and CDeC-Net by 10%-points (from 79%
to 89%). Furthermore, it shows that combining TL
with Ensembling and post-processing improves the
quality by another 2%-points. Finally, our TabProIS
model achieves an F1 score of 91.18% on the val-
idation dataset of TabProDS, containing 840 sam-
ples. Since detecting tables in PIS does not require
real-time processing, the overhead of Ensembling and
post-processing is quite acceptable.
We will publish a selection of our models and the
dataset on GitHub so that our results can be repro-
duced.
REFERENCES
Agarwal, M., Mondal, A., and Jawahar, C. V. (2020).
CDeC-Net: Composite Deformable Cascade Network
for Table Detection in Document Images. Technical
Report arXiv:2008.10831, arXiv. arXiv:2008.10831
[cs].
Bochkovskiy, A., Wang, C.-Y., and Liao, H.-Y. M. (2020).
YOLOv4: Optimal Speed and Accuracy of Object De-
tection. arXiv:2004.10934 [cs, eess].
Cai, Z. and Vasconcelos, N. (2017). Cascade R-CNN: Delv-
ing into High Quality Object Detection. Technical Re-
port arXiv:1712.00726, arXiv. arXiv:1712.00726 [cs].
Casado-Garcia, A., Dominguez, C., Heras, J., Mata, E., and
Pascual, V. (2019). The Benefits of Close-Domain
Fine-Tuning for Table Detection in Document Im-
ages. Technical Report arXiv:1912.05846, arXiv.
arXiv:1912.05846 [cs].
Casado-Garcia, A. and Heras, J. (2020). Ensemble methods
for object detection. In ECAI.
Chen, K., Wang, J., Pang, J., Cao, Y., Xiong, Y., Li, X.,
Sun, S., Feng, W., Liu, Z., Xu, J., Zhang, Z., Cheng,
D., Zhu, C., Cheng, T., Zhao, Q., Li, B., Lu, X., Zhu,
R., Wu, Y., Dai, J., Wang, J., Shi, J., Ouyang, W.,
Loy, C. C., and Lin, D. (2019). Mmdetection: Open
mmlab detection toolbox and benchmark. CoRR,
abs/1906.07155.
Das, A., Roy, S., Bhattacharya, U., and Parui, S. K. (2018).
Document Image Classification with Intra-Domain
Transfer Learning and Stacked Generalization of
Deep Convolutional Neural Networks. Technical Re-
port arXiv:1801.09321, arXiv. arXiv:1801.09321 [cs].
Fang, J., Tao, X., Tang, Z., Qiu, R., and Liu, Y. (2012).
Dataset, Ground-Truth and Performance Metrics for
Table Detection Evaluation. In 2012 10th IAPR In-
ternational Workshop on Document Analysis Systems,
pages 445–449, Gold Coast, Queenslands, TBD, Aus-
tralia. IEEE.
Fleiss, J. L., Levin, B., and Paik, M. C. (2003). The Mea-
surement of Interrater Agreement. In Statistical Meth-
ods for Rates and Proportions, pages 598–626. John
Wiley & Sons, Ltd.
Gao, L., Huang, Y., Dejean, H., Meunier, J.-L., Yan, Q.,
Fang, Y., Kleber, F., and Lang, E. (2019). ICDAR
TabProIS: A Transfer Learning-Based Model for Detecting Tables in Product Information Sheets
35

2019 Competition on Table Detection and Recogni-
tion (cTDaR). pages 1510–1515.
Gao, L., Yi, X., Jiang, Z., Hao, L., and Tang, Z. (2017). IC-
DAR2017 Competition on Page Object Detection. In
2017 14th IAPR International Conference on Docu-
ment Analysis and Recognition (ICDAR), pages 1417–
1422, Kyoto. IEEE.
Gilani, A., Qasim, S. R., Malik, I., and Shafait, F. (2017).
Table Detection Using Deep Learning. In 2017 14th
IAPR International Conference on Document Analy-
sis and Recognition (ICDAR), pages 771–776, Kyoto.
IEEE.
Girshick, R. (2015). Fast R-CNN. Technical Report
arXiv:1504.08083, arXiv. arXiv:1504.08083 [cs].
Gobel, M., Hassan, T., Oro, E., and Orsi, G. (2013). ICDAR
2013 Table Competition. In 2013 12th International
Conference on Document Analysis and Recognition,
pages 1449–1453, Washington, DC, USA. IEEE.
Hashmi, K. A., Liwicki, M., Stricker, D., Afzal, M. A.,
Afzal, M. A., and Afzal, M. Z. (2021). Current Sta-
tus and Performance Analysis of Table Recognition
in Document Images with Deep Neural Networks.
arXiv:2104.14272 [cs]. arXiv: 2104.14272.
He, K., Gkioxari, G., Dollár, P., and Girshick, R. (2018).
Mask R-CNN. arXiv:1703.06870 [cs].
Krizhevsky, A., Sutskever, I., and Hinton, G. E. (2012).
ImageNet classification with deep convolutional neu-
ral networks. In Pereira, F., Burges, C., Bottou, L.,
and Weinberger, K., editors, Advances in neural in-
formation processing systems, volume 25. Curran As-
sociates, Inc.
Li, M., Cui, L., Huang, S., Wei, F., Zhou, M., and
Li, Z. (2019). TableBank: Table Benchmark
for Image-based Table Detection and Recognition.
arXiv:1903.01949 [cs]. arXiv: 1903.01949.
Lin, T.-Y., Dollár, P., Girshick, R., He, K., Hariharan, B.,
and Belongie, S. (2017). Feature Pyramid Networks
for Object Detection. arXiv:1612.03144 [cs].
Lin, T.-Y., Maire, M., Belongie, S., Bourdev, L., Girshick,
R., Hays, J., Perona, P., Ramanan, D., Zitnick, C. L.,
and Dollár, P. (2015). Microsoft COCO: Common Ob-
jects in Context. arXiv:1405.0312 [cs].
Prasad, D., Gadpal, A., Kapadni, K., Visave, M., and Sul-
tanpure, K. (2020). CascadeTabNet: An approach for
end to end table detection and structure recognition
from image-based documents. In 2020 IEEE/CVF
Conference on Computer Vision and Pattern Recogni-
tion Workshops (CVPRW), pages 2439–2447, Seattle,
WA, USA. IEEE.
Ren, S., He, K., Girshick, R., and Sun, J. (2016).
Faster R-CNN: Towards Real-Time Object Detection
with Region Proposal Networks. Technical Report
arXiv:1506.01497, arXiv. arXiv:1506.01497 [cs].
Rezatofighi, H., Tsoi, N., Gwak, J., Sadeghian, A., Reid,
I., and Savarese, S. (2019). Generalized Intersection
over Union: A Metric and A Loss for Bounding Box
Regression. arXiv:1902.09630 [cs].
Shafait, F. and Smith, R. (2010). Table detection in hetero-
geneous documents. In Proceedings of the 8th IAPR
International Workshop on Document Analysis Sys-
tems - DAS ’10, pages 65–72, Boston, Massachusetts.
ACM Press.
Siddiqui, S. A., Malik, M. I., Agne, S., Dengel, A., and
Ahmed, S. (2018). DeCNT: Deep Deformable CNN
for Table Detection. IEEE Access, 6:74151–74161.
Sildatke, M., Karwanni, H., Kraft, B., and Zündorf,
A. (2022a). ARTIFACT: Architecture for Auto-
mated Generation of Distributed Information Extrac-
tion Pipelines. In Filipe, J., Smialek, M., Brodsky, A.,
and Hammoudi, S., editors, Proceedings of the 24th
International Conference on Enterprise Information
Systems, ICEIS 2022, Online Streaming, April 25-27,
2022, Volume 2, pages 17–28. SCITEPRESS.
Sildatke, M., Karwanni, H., Kraft, B., and Zündorf, A.
(2022b). FUSION: Feature-based Processing of Het-
erogeneous Documents for Automated Information
Extraction. In Fill, H.-G., Sinderen, M. v., and Maci-
aszek, L. A., editors, Proceedings of the 17th Interna-
tional Conference on Software Technologies, ICSOFT
2022, Lisbon, Portugal, July 11-13, 2022, pages 250–
260. SCITEPRESS.
Solovyev, R., Wang, W., and Gabruseva, T. (2021).
Weighted boxes fusion: Ensembling boxes from dif-
ferent object detection models. Image and Vision
Computing, 107:104117. arXiv:1910.13302 [cs].
Taghva, K., Nartker, T., Borsack, J., and Condit, A. (2000).
Unlv-isri document collection for research in ocr and
information retrieval. 3967.
Torrey, L. and Shavlik, J. (2009). Transfer learning. Hand-
book of Research on Machine Learning Applications.
Viera, A. J. and Garrett, J. M. (2005). Understanding In-
terobserver Agreement: The Kappa Statistic. Family
Medicine, page 4.
Wu, Y., Kirillov, A., Massa, F., Lo, W.-Y., and Gir-
shick, R. (2019). Detectron2. https://github.com/
facebookresearch/detectron2.
Zeiler, M. D. and Fergus, R. (2013). Visualizing and Under-
standing Convolutional Networks. Technical Report
arXiv:1311.2901, arXiv. arXiv:1311.2901 [cs].
Zhang, C. and Ma, Y. (2012). Ensemble Machine Learn-
ing - Methods and Applications. Springer Science &
Business Media, Berlin Heidelberg.
Zhong, X., ShafieiBavani, E., and Yepes, A. J. (2020).
Image-based table recognition: data, model, and eval-
uation. Technical Report arXiv:1911.10683, arXiv.
arXiv:1911.10683 [cs].
Zhou, H., Li, Z., Ning, C., and Tang, J. (2017). CAD: Scale
Invariant Framework for Real-Time Object Detection.
In 2017 IEEE International Conference on Computer
Vision Workshops (ICCVW), pages 760–768, Venice.
IEEE.
Zou, Z., Shi, Z., Guo, Y., and Ye, J. (2019). Object Detec-
tion in 20 Years: A Survey. arXiv:1905.05055 [cs].
IMPROVE 2023 - 3rd International Conference on Image Processing and Vision Engineering
36
