
Towards a Robust Traffic Scene Representation in Cooperative
Connected Automated Mobility
David Yag
¨
ue-Cuevas
a
, Pablo Mar
´
ın-Plaza
b
, Mar
´
ıa Paz-Sesmero
c
and Araceli Sanchis
d
Intelligent Systems Lab, University Carlos III of Madrid, Av. de la Universidad, Legan
´
es, Madrid, Spain
Keywords:
Autonomous Driving, CCAM, Information System, Software Application, Data Representation.
Abstract:
The relevance of methodologies able to exchange data between software modules in charge of controlling
an autonomous vehicle have been increasing accordingly to the interests in the industry. The information
managed by these systems needs to be represented in such a way the autonomous vehicle is able to produce
safe behaviours as well as reliable control outputs when deployed in real-world environments. The efforts to
define these data structures entail the first step in the path towards a fully autonomous platform. In this work, a
representation of this nature is proposed, together with the flow of information of a layered modular software
architecture which aims to operate an autonomous vehicle from low level actuators to high level behaviours.
1 INTRODUCTION
From its beginnings to the present day, autonomous
driving has meant a drastic change in how urban mo-
bility within city environments is understood (Lee
et al., 2015). The appearance of advanced driver-
assistance systems (ADAS) (Kukkala et al., 2018)
have been increasing over the years since 2012, being,
in some cases, compulsory in recent manufactured ve-
hicles. Furthermore, the growth of global population
accompanied by the extensive urbanization is leading
to an increase in the number of vehicles in city envi-
ronments (Cervero, 2000). Hence, part of the auto-
motive industry is now targeting a cutting-edge tech-
nological scope: a fully autonomous platform able to
make decisions dynamically taking into account any
complex traffic situations. For this to happen, there
must exist a system infrastructure in which the flow of
information is well defined, as well as a software ar-
chitecture which integrates and uses that information
to produce safe, efficient and reliable control com-
mands. This system, composed of multiple modules
interacting which each other, is meant to provide a
set of complex behaviours in order to drive a vehicle
without human interaction. Thus, the level 5 vehicle
taking into account the SAE standard (International,
a
https://orcid.org/0000-0001-9679-5589
b
https://orcid.org/0000-0001-7196-434X
c
https://orcid.org/0000-0001-9473-6809
d
https://orcid.org/0000-0002-1429-4092
2021), involves not only implementing the necessary
data structures, but also the software modules able
manage all traffic information.
In recent years, the importance of integrating such
systems has become clear as new approaches to au-
tonomous driving are developed. Systems like Auto-
ware (Kato et al., 2018), ROS (Quigley et al., 2009),
RTMaps (Michel and Du Lac, 2009) or YARP (Metta
et al., 2006) appeared in the industry as middlewares
which strive to enhance and speed up the elaboration
of robotic software. In some cases, they target spe-
cific applications like Autoware for self-driving ve-
hicles, and in other cases, its application is multi-
disciplinary and very flexible like YARP. Sometimes,
the constraints these tools impose on the development
process force developers to choose carefully in which
system the future software architecture is going to
be integrated. Hence, all these tools come with pros
and cons depending on the target application. Par-
ticularly, Autoware provides a stack build upon ROS
which includes all of the necessary functions to drive
an autonomous vehicles. Nevertheless, those modules
are applied only from the ego vehicle perspective and
they lack of cooperative information exchange. Con-
versely, RTMaps is a graphic development platform
for rapid prototyping, but limits the developer when
implementing new features on its components. On the
other hand, YARP compels the developer to imple-
ment some of the basic bare bones of the communi-
cation infrastructure, and although it is very flexible,
the time needed for this tasks may be unmanageable.
Yagüe-Cuevas, D., Marín-Plaza, P., Paz-Sesmero, M. and Sanchis, A.
Towards a Robust Traffic Scene Representation in Cooperative Connected Automated Mobility.
DOI: 10.5220/0011841100003479
In Proceedings of the 9th International Conference on Vehicle Technology and Intelligent Transport Systems (VEHITS 2023), pages 265-272
ISBN: 978-989-758-652-1; ISSN: 2184-495X
Copyright
c
2023 by SCITEPRESS – Science and Technology Publications, Lda. Under CC license (CC BY-NC-ND 4.0)
265

Finally, ROS as an standalone tool, provides a full set
of software libraries to build a robot applications but it
restricts the developer to a specific operating system.
Choosing between these tools depends on the
goals in mind. However, the problem presented here
is but a problem of managing information, since
the information required for an autonomous vehicle
to produce reliable results is computationally heavy.
The amount of data perceived from the sensors gen-
erates very complex virtual scenarios, and its density,
together with the required high rate of operation, de-
mand high end systems able to process everything, as
well as efficient data structures to represent properly
all the needed knowledge. In one hand, perception
information comes from sensors such as Radars, Li-
DARs and/or Cameras placed externally on the ve-
hicle, and raw sensor data is processed dynamically
inside modules which usually implements Deep Neu-
ral Networks trained specifically to detect, classify
and/or track external agents on the road (Rao and Fr-
tunikj, 2018), (Shengbo et al., 2019), (Stroescu et al.,
2019). These systems are in charge of processing dy-
namic events while providing semantic information
about the scene and its agents. Road information, on
the other hand, is usually managed with HD Maps
which represents virtually all the road static infras-
tructure with accuracy and fidelity. That is, lanes, sig-
nals, crosswalks, etc. (WONSang-Yeon et al., 2020),
(Barsi et al., 2017), (Seif and Hu, 2016). Moreover,
the geometric data related to roads are usually repre-
sented in the Frenet Coordinate system that defines,
with two parameters: S and D, the longitudinal and
lateral displacement respectively from the start of the
lane to the end, like it is shown in Figure 1.
Figure 1: Frenet Lane Representation.
Finally, cooperative information is share between
road agents through V2V and V2X vehicular net-
works that transmit the information provided by any
sensors deployed at any other agent on the road (He
et al., 2019), (Ahmed et al., 2022), (Cheng et al.,
2018). Nowadays, a number of applications and stan-
dards that utilise 5G capabilities have been under de-
velopment for some years now constituting promising
bets for V2X communication (Ge et al., 2017), (Yang
and Hua, 2019), (Ortega et al., 2018) in future smart
cities.
Since this information needs to be organized in
such a way it can be utilized by the systems in charge
of controlling the autonomous platform, the effort on
standardising such data structures and modules inter-
action entails a matter that needs to be tabled as the
autonomous capabilities grow. For this reason, a set
of data structures are presented in this work, together
with the information flow within a software architec-
ture able to control an electric vehicle autonomously.
The main aim of this proposal is not only to organize
the information an autonomous vehicle can extract
from the road, but also provide a valid representation
to achieve what it is known as Cooperative, connected
and automated mobility (CCAM).
2 DATA REPRESENTATION
In this section, each of the proposed data structures to
represent the traffic scene will be explained. This rep-
resentation is divided in several scopes. Road events
that come from the HD Map, Awareness events that
come from the vehicle anomalies, Perception events
that come from sensor data, and Cooperative events
that come from any other road agents.
2.1 Road Events
Road events represent the planning information re-
trieve from the HD map. The most important data
structure is the Road, that contains the current plan-
ning lane in which the vehicle is located. The Lane
itself is divided in several and important data items:
the lane id to identify it within the HD map, the
type of lane, that can be categorized as Normal, In-
tersection, Emergency, Multi, Overtaking, Turn, Bike
or Unknown, the lane geometry with its length and
width, the speed limits, defined with the speed limit
and the set of lane section in which this restriction ap-
plies, and finally the waypoint path, that is an array
of waypoints which contains not only the frenet co-
ordinates with S and D of every waypoint of the lane
(with an arbitrary separation between them), but also
the cartesian coordinates which will be used by local
planners to generate the set of possible trajectories the
VEHITS 2023 - 9th International Conference on Vehicle Technology and Intelligent Transport Systems
266
vehicle can follow until the goal is reached.
RoadEvent (RoadEvent)
CurrentRoad (Road)
PlanningLane (PlanningLane)
Lane (Lane)
LaneId (int64)
LaneType (uint8)
LaneGeometry (LaneGeometry)
LaneLength (float)
LaneWidth (float)
SpeedLimits (SpeedLimits[])
SpeedLimit (float)
LaneSection (LaneSection)
SStart (float)
SStart (float)
WaypointPath (Waypoint[])
LaneContacts (LaneContact)
Successor (LaneContact)
ContactLane (Lane)
ContactType (uint8)
LeftNeighbor (LaneContact)
RightNeighbor (LaneContact)
LeftNeighborSucc (LaneContact)
RightNeighborSucc (LaneContact)
LaneAction (LaneAction)
WaypointRoad (Waypoint)
Pose3D (Pose)
DOffset (float)
SOffset (float)
In order to plan over the road, a data structure
is build containing every road from the vehicle cur-
rent location to the selected map location. This mes-
sage aggregates a vector of Roads that contains ev-
ery possible lane the vehicle can traverse to reach
its goal. Furthermore, the logical connections (Left-
Neighbor, RightNeighbor, LeftNeighborSucc, Right-
NeighborSucc, Successor lanes) are added together
with the type of connection between them: Stop,
Yield, StopAll, LaneEnd, LaneChange, LaneContinu-
ation, SpeedBump, TrafficLight, Crosswalk, Unknown
or Invalid. For each planning lane the system gen-
erates the lane information already explained, and
also the estimated action to reach the goal targeted
within the HD Map; these actions are: ActionCon-
tinue, ActionChangeLeft, ActionChangeRight, Actio-
nEnd or ActionUnknown. Then, this plan is loaded in
a module (Waypoint Manager) in charge of tracking
the position of the vehicle on the road by computing
the current road, lane and waypoint at which the vehi-
cle is located. This current waypoint is used by other
high level module (Trajectory Manager) to gener-
ate the set of trajectories available for the vehicle to
follow. Then, the final set of trajectories is processed
by the decision making module (Decision Manager)
that will select, taking into account all other events de-
tected on the road, the most suitable trajectory. This
other events are perception events, cooperative events
and awareness events.
2.2 Awareness Events
Awareness events define the state of the vehicle and
all of its components. The Status field can take the
following values: Failure, Success, Waiting or Idle. If
any module fails or is detected to perform in a non
expected way, this events exchange information with
the decision making module in order to decide what
to do next, likely stopping the vehicle until a solu-
tion is found. The SystemInvolved field represents the
layer affected: Sensor, Software, Planning, Control
or LowLevel and if any system related to those layers
fails, this event will inform the high level to reflect a
fail with the NodesInvolved field which contains the
PIDs of the subsystems that encounter the error. With
this information, any internal failure or error can be
detected to ensure the security of the platform.
AwarenessEvent (AwarenessEvent)
SystemStatus (SystemStatus[])
Status (Status)
Status (uint8)
SystemInvolved (uint8)
NodesInvolved (PID[])
2.3 Perception Events
The perception events are used to manage all the hy-
pothesis about what the perception layer is detecting.
The set of hypothesis is generated with a Score that
represents the amount of uncertainty the perception
systems produced when detecting an object. Impor-
tant datasets in the literature, like Nuscenes (Caesar
et al., 2020) o KITTI (Liao et al., 2021), on which
many deep learning detection systems are based, con-
tain multiple classes and groups, as well as tracking
features to estimate the speed and bounding box for
each detected object. Hence, a detection hypothe-
sis is composed of three arrays of hypothesis: the
set of class hypothesis (ClassTypeHypothesis), the set
of kinematic hypothesis (VelocityHypothesis), and the
set of estimated 3D bounding boxes (BBoxHypothe-
sis) with an approximate Center, Width, Height and
Length. The Center of the bounding box can be used
to estimate the position globally, and the Size can be
used to verify a safe manoeuvre. Moreover, this in-
formation is used in conjunction with the Type and
ClassDetection, which not only can be road users,
such as vehicles or pedestrians, but also vertical sig-
Towards a Robust Traffic Scene Representation in Cooperative Connected Automated Mobility
267
nage like traffic lights or yield/stop signs. And, al-
though this classification is restricted to those values,
it can be extended in future iterations since both, the
software architecture as well as the data representa-
tion, are very flexible and easy to change.
DetectionEvent (DetectionEvent)
Detection (Detection[])
Id (int64)
DetectionHypothesis (DetectHypothesis)
ClassType (ClassTypeHypothesis[])
Score (float)
Type (uint8)
ClassDetection (uint8)
BoundingBox (BBoxHypothesis[])
Score (float)
BoundingBox (BoundingBox3D)
Center(Pose)
Size (Vector3)
Width (float)
Height (float)
Length (float)
Velocity (VelocityHypothesis[])
Score (float)
VelocityVector (Vector3)
The field Type can take the following values:
VEHICLE, PEDESTRIAN, SIGNAL, INFRASTRUC-
TURE. On the other hand, the ClassDetection de-
tected can be: Car, Van, Truck, Bus, Motorcy-
cle, Bike, Tractor, Bulldozer, Train or Walker for
road users; Warning, CautionPedestrian, Caution-
Bike, Yield, Stop, Roundabout, MaxSpeed, Recom-
mendedSpeed, CautionCconstructionZone, Manda-
toryTurnLeft, MandatoryTurnRight and Mandatory-
TurnForward for signals; and TrafficLightRed, Traf-
ficLightYellow, TrafficLightGreen, LaneMarkingStop,
LaneMarkingYield, LaneMarkingCrosswalk, Lane-
MarkingSolid, LaneMarkingBroken or LaneMarking-
DoubleSolid for infrastructure.
Finally, the hypothesis constructed are ultimately
processed by the (Perception Manager) module that
sends useful information to the decision layer in order
to know the restrictions over the road and compare
them with the ones stored in the HD Map. In addition,
it also warns the planning and control layers about any
threat or obstacle in the way to prepare the collision
avoidance and/or overtake procedures.
2.4 Cooperative Events
The main aim of Cooperative events is the exchange
of traffic information between road agents identified
within the same network. Consequently, the same
messages already explained are used here. In this
case, however, two different scopes must be differ-
entiated: the information the connected vehicle is
able to provide about itself (SelfCooperation) together
with any other nearby user information (Coopera-
tionAgents), and the information about what is being
detected by its perception systems (CooperationDe-
tections). In the first case, information given is re-
liable, while in the second, it must be represented
as an hypothesis on what the system is perceiving.
Thereby, the representation of the CooperationDetec-
tions is very similar when compare with a Detection.
The only difference is that the provider of the infor-
mation is not the ego vehicle perception layer but a
different agent connected to the traffic network. On
the other hand, CooperationAgents represents the in-
formation received by any agent on the road, allowing
the ego vehicle to collect distant perception data. As a
consequence, this information is propagated through
the network so that any agent can use it without being
in the vicinity and act in advance.
CooperationEvent (CooperationEvent)
Cooperation (CooperationMessage[])
AgentId (int64)
SelfCooperation (CooperationItem)
ClassType (ClassType)
BoundingBox (BoundingBox3D)
Velocity (Velocity)
CooperationAgents (CooperationItem[])
CooperationDetections (Detection[])
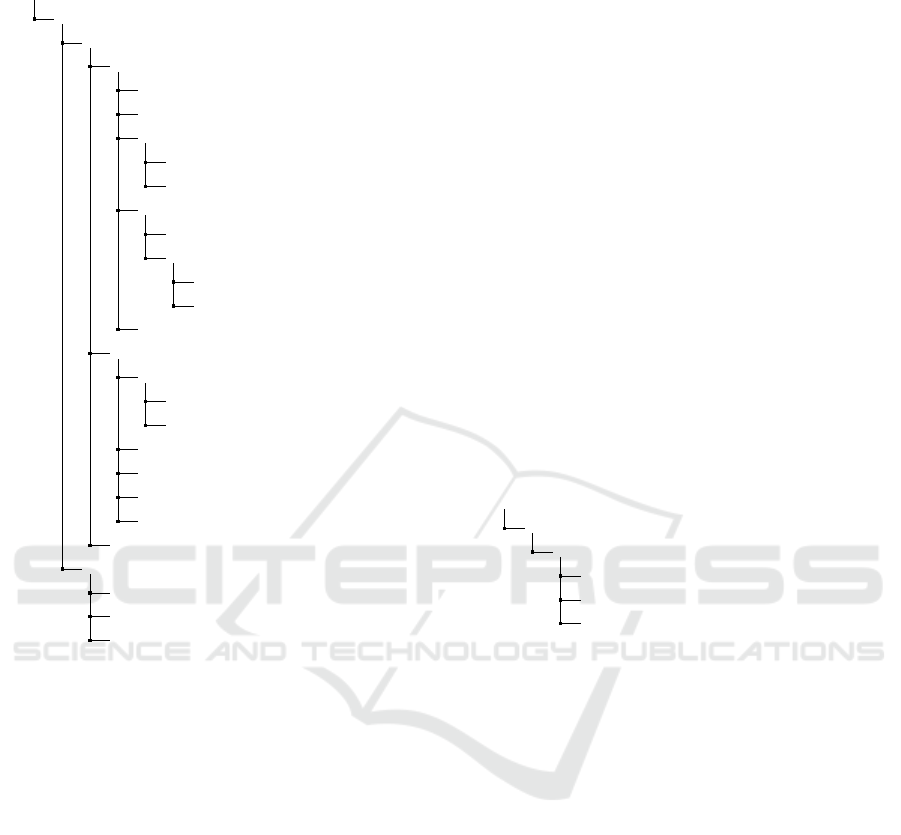
2.5 Scene Representation
Finally, with all this information aggregated, the com-
plete traffic scene is depicted in Figure 2. In which
the road, perception and cooperative events already
explained allow the vehicle to localize itself, make
plans, and decide, generating an internal represen-
tation on, ”how are my systems”, ”where I am”,
”where I want to go”, ”what is my way” and ”what I
need to do next”.
Figure 2: Scene Representation.
VEHITS 2023 - 9th International Conference on Vehicle Technology and Intelligent Transport Systems
268

3 SOFTWARE ARCHITECTURE
Once all traffic information is organized, a software
architecture is implemented to enable control, plan-
ning and decision making capabilities. In this section,
all the layers that compose such system are presented.
3.1 Sensor Layer
In Sensor layer, Figure 3, every sensor output is pro-
cessed to prepare the raw sensor readings and obtain
the data structures explained. These outputs are fed
directly to the Perception-Localization layer where
perception modules receive LiDAR, camera and radar
data for Deep Neural Networks to detect and catego-
rize road objects. Besides, localization modules en-
sure a precise positioning using a differential GPS,
IMU and vehicle telemetry that come directly from
the low level actuators. Odometry sources are the
inputs of the localization layer. Although, thanks to
the high modularity of the system, alternative meth-
ods of localization can be used such us LiDAR o vi-
sual odometry. Either way, all readings related with
odometry outputs are processed in the next layer:
Perception-Localization Layer, while detection events
are built from LiDAR, camera and radar data.
Figure 3: Sensor Layer.
3.2 Perception-Localization Layer
Inside the perception-localization layer, Figure 4, sev-
eral modules in charge of providing an accurate global
positioning can be found. To localize the vehicle,
an Undescended Kalmam Filter (UKF) (Moore and
Stouch, 2014) is used fusing the GPS, IMU, vehicle
telemetry and any other source of odometry to ob-
tain a filtered odometry. This helps to provide a well
formed transformation tree (Foote, 2013) to verify the
evolution of each part of the vehicle over time. On the
other hand, several other modules whose responsibil-
ity is the perception of road objects are implemented
here. These modules are inside the DNN module
which fuses LiDAR, radar and camera data to pro-
vide all objects detected as Perception Events. When
the Perception Event is built, a new module named
Perception Manager uses these detection inputs to
produce the semantics of the scene for theDecision
Manager to choose what to do next. Finally, the Sen-
sor Awareness, provides a tool to check the integrity
of all sensors and the general status of the hardware
and software on board, as well as the validity of the
data provided when the system is working.
Figure 4: Perception-Localization Layer.
Finally, once the system is able to perceive its sur-
roundings and localize itself, the vehicle is able to
plan using the road information stored in the HD Map.
3.3 Planning-Decision Layer
The planning-decision layer, Figure 5, is in charge
of building a plan using the road infrastructure man-
aged by the AD Map module. This module parses a
file following the ASAM OpenDRIVE standard (for
Standardization of Automation and Systems, 2022),
and stores all traffic information. With this informa-
tion, a new plan is generated every time the user tar-
gets a goal. Then, this plan is stored in memory and
the module Waypoint Manager starts its tracking by
computing the vehicle position with respect to the
plan using the localization given by the Perception-
Localization layer. The plan consist of a road array
that must be traversed to reach the goal targeted from
the current map position. Hence, knowing the posi-
tion the vehicle is in with respect to the plan, the geo-
metric information of the current road is used to build
the Road event that stores in which lane the vehicle
is located. Afterward, the Trajectory Manager uses
the Road event to produce the set of viable trajectories
the vehicle should follow to reach the goal.
Thereafter, the Decision Manager processes this
set of trajectories considering the semantics of the
scene given a Perception event, the internal status of
Towards a Robust Traffic Scene Representation in Cooperative Connected Automated Mobility
269

Figure 5: Planning-Decision Layer.
the systems given an Awareness event, and any other
cooperative event from any user on the road, to select
the course of action and the most suitable trajectory
to follow. This trajectory is then transmitted to the
control layer and the Decision Manager, that is al-
ways tracking the plan with the Waypoint Manager,
checks the current lane action in order to continue on
the same lane or change to a more suitable neighbour.
3.4 Control and GUI Layers
The planning-decision layer is directly connected to
the control layer, Figure 6, in which a set of con-
trollers are developed, like a MPC (Borrelli et al.,
2005), or a Stanley Controller (Hoffmann et al.,
2007). Furthermore, the speed computed is surveyed
with the Speed Manager which selects the most suit-
able one depending on the trajectory, the restrictions
of the road, and the situation of the traffic scene. Fi-
nally, for security reasons, redundant modules are im-
plemented here: the Control Manager which selects
the type of controller if the architecture have more
than one, and the Movement Manager, which checks
whether the platform is allowed to move.
Figure 6: Control and GUI Layer.
Finally, these commands can be overridden by the
GUI layer which is composed of different modules
that supervise the system from different perspectives.
The fleet GUI oversees multiple vehicles working at
once, the Passenger GUI implements a display that
depicts information for the user, and the Operator
GUI displays critical information about the system
performance and implements a human-machine inter-
face to provide dynamic parameters updates.
3.5 Low Level Layer
Lastly, with the control command computed, the last
step is to send them to the low level modules, Figure
7, that convert the controller commands into low level
signal able to control the vehicle engine. These can
be throttle/brake or Ackermann commands. With this
last iteration, the ego vehicle is able to control itself
while perceiving its environment and deciding when
to stop, continue, change from one lane to another,
etc. That is, a level 5 automation behaviours.
Figure 7: Low Level Layer.
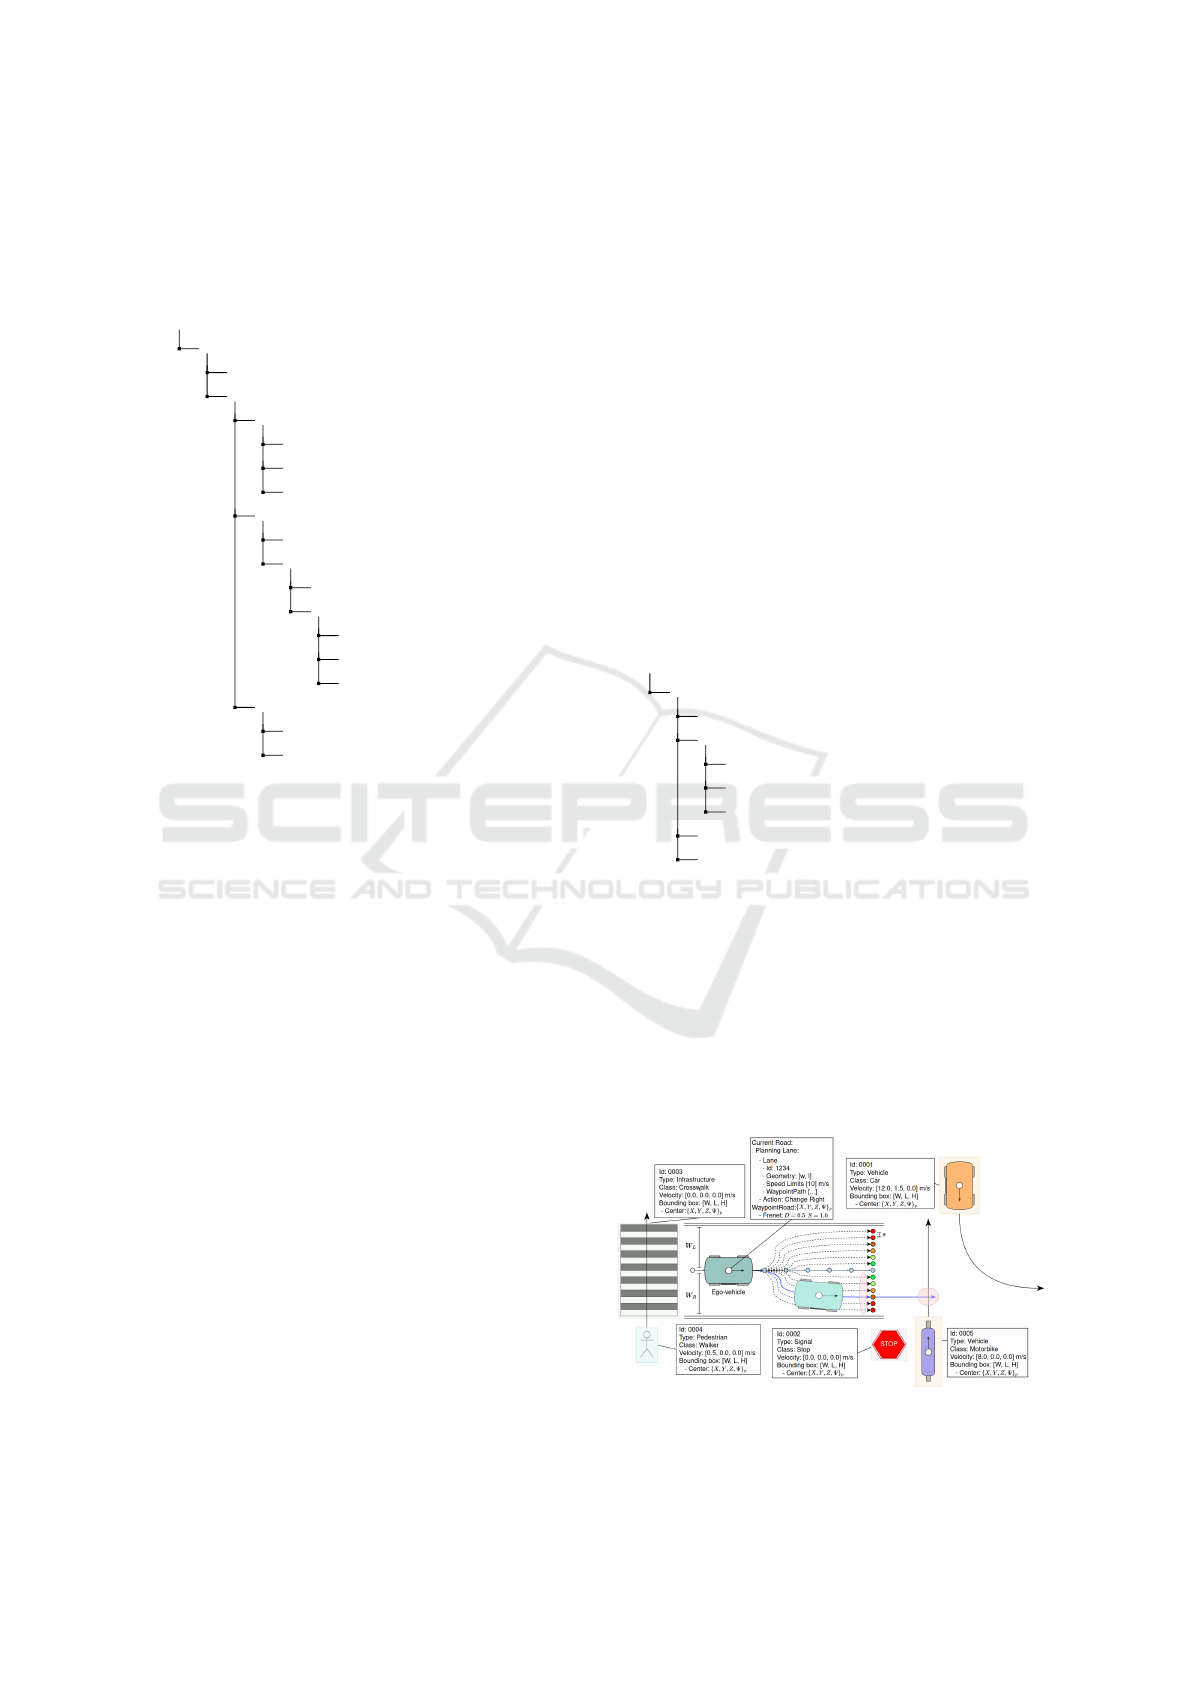
4 SYSTEM EVALUATION
Data structures and modules presented in this work
are continuously developed and integrated inside an
ecosystem based on ROS 2, focused on controlling
the platform in real time. This ecosystem was mostly
designed and tested in a simulation based on Gazebo
(Yag
¨
ue-Cuevas et al., 2021) and Carla (Dosovitskiy
et al., 2017), and ultimately verified on real platforms
(Marin-Plaza et al., 2021), (Marin-Plaza et al., 2019).
In Figure 8 the map information can be seen. Red
arrow lines represent road lanes with its respective
id, which allow the system to keep track of the vehi-
cle location with the help of the Waypoint Manager.
Moreover, the vehicle model is depicted together with
the transformation tree, and all map infrastructure
items like vertical signage and traffic lights. These
items contain a bounding box with a pose referenced
globally since they are treated as Detections. Further-
more, the ClassType and the uncertainty (Score) of
this detection are shown. Finally, the vehicle on board
camera image is shown at the bottom left part of the
display recording part of Carla world.
VEHITS 2023 - 9th International Conference on Vehicle Technology and Intelligent Transport Systems
270
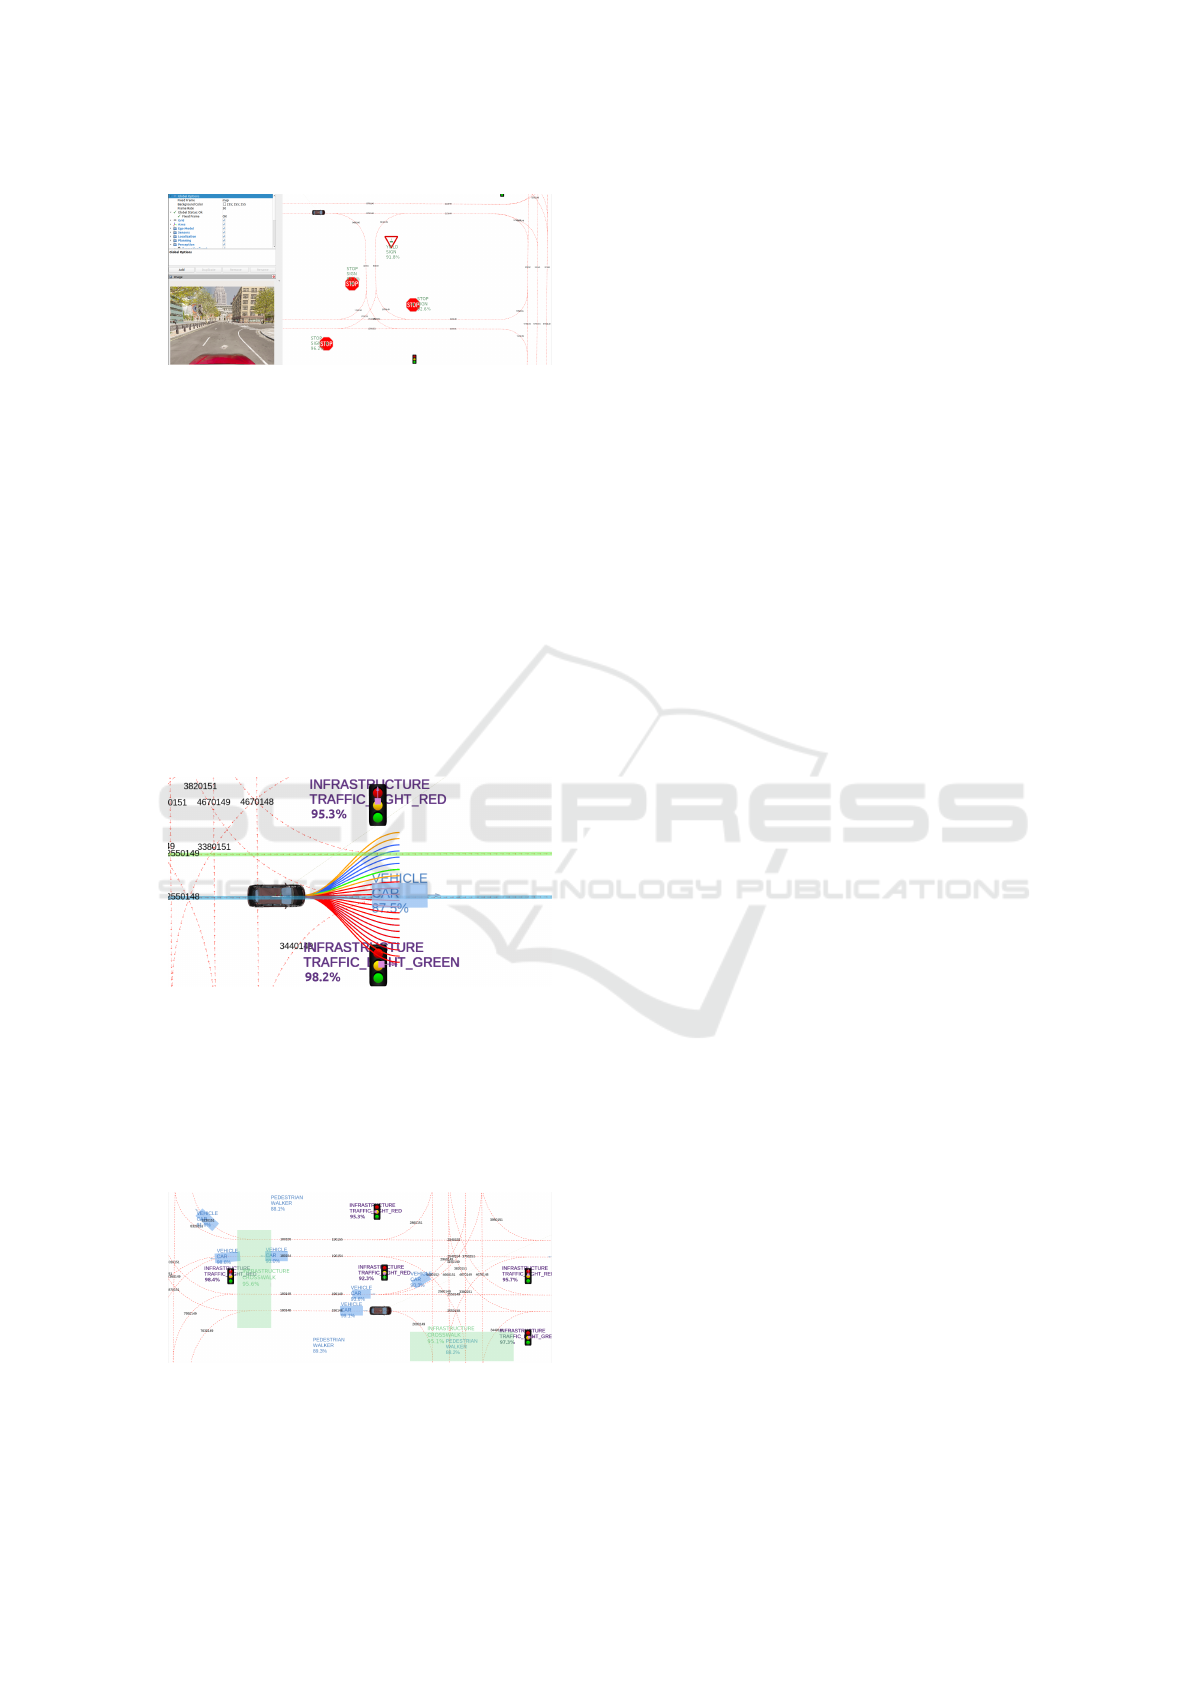
Figure 8: HD Map information.
In Figure 9 the planning information is depicted.
Blue lines symbolise lanes in which the vehicle needs
to change in order to follow the goal, and green lines
symbolise lanes in which the vehicle needs to con-
tinue the course. This information is used by the De-
cision Manager module which process the action re-
lated to the particular lane the vehicle is located in
order to select the most suitable trajectory to follow.
Furthermore, the outputs of the Trajectory Manager
can be seen with the set of trajectories computed from
the current location. Orange and Red trajectories are
of high cost and forbidden, respectively, and blue tra-
jectories are those that can be chosen by the Decision
Manager to follow. Finally, the selected and final tra-
jectory the vehicle will follow is in green.
Figure 9: Planning on Road.
Finally, in Figure 10 the information extracted
from the HD Map and the Perception/Cooperative
systems is depicted, allowing the vehicle to generate
an internal representation of the traffic scene which is
ultimately processed to decide what is the most suit-
able action to perform next.
Figure 10: Perceptions Events.
5 CONCLUSIONS
Like a brain that gathers and filters irrelevant informa-
tion to perceive the environment, autonomous vehi-
cles require not only well-structured information, but
also systems that allow them to aggregate and utilize
this knowledge in order to operate properly. In the
path towards a fully connected autonomous platform,
the way this information is virtually represented en-
tail a critical step. Road events used in conjunction
with perception events address the problem of local-
ization and perception, and are the basic bare bones
to build a robust scene representation, while coop-
erative event enable the exchange of information be-
tween traffic agents to act ahead of time. However, as
the need of organized software ecosystem increase,
platforms that guarantee a flexible and modular de-
velopment cycle are still a fundamental milestone to
address in the automation of any vehicle. A layered
software architecture wagers for a modular system in
which the responsibilities are well defined and easily
updated and debugged. Hence, with the virtual rep-
resentation of the traffic scene proposed and the flow
of information within a layered software architecture
already presented, this work attempts to take a step
towards an autonomous and connected vehicle.
ACKNOWLEDGEMENTS
Grants PID2019-104793RB-C31 and
PDC2021-121517-C31, funded by
MCIN/AEI/10.13039/501100011033, and by the
European Union, “NextGenerationEU/PRTR” and
the Comunidad de Madrid, through SEGVAUTO-
4.0-CM (P2018/EMT-4362). New paradigm for
emergency transport services management: ambu-
lance. AMBULATE-CM.
REFERENCES
Ahmed, H. U., Huang, Y., Lu, P., and Bridgelall, R. (2022).
Technology developments and impacts of connected
and autonomous vehicles: An overview. Smart Cities,
5(1):382–404.
Barsi, A., Pot
´
o, V., Somogyi, A., Lovas, T., Tihanyi, V., and
Szalay, Z. (2017). Supporting autonomous vehicles by
creating hd maps. Production Engineering Archives.
Borrelli, F., Falcone, P., Keviczky, T., Asgari, J., and Hrovat,
D. (2005). Mpc-based approach to active steering for
autonomous vehicle systems. International journal of
vehicle autonomous systems, 3(2-4):265–291.
Caesar, H., Bankiti, V., Lang, A. H., Vora, S., Liong, V. E.,
Xu, Q., Krishnan, A., Pan, Y., Baldan, G., and Bei-
jbom, O. (2020). nuscenes: A multimodal dataset for
Towards a Robust Traffic Scene Representation in Cooperative Connected Automated Mobility
271

autonomous driving. In Proceedings of the IEEE/CVF
conference on computer vision and pattern recogni-
tion, pages 11621–11631.
Cervero, R. (2000). Growing smart by linking transporta-
tion and urban development. Virginia Environmental
Law Journal, pages 357–374.
Cheng, N., Lyu, F., Chen, J., Xu, W., Zhou, H., Zhang, S.,
and Shen, X. (2018). Big data driven vehicular net-
works. IEEE Network, 32(6):160–167.
Dosovitskiy, A., Ros, G., Codevilla, F., Lopez, A., and
Koltun, V. (2017). CARLA: An open urban driving
simulator. In Proceedings of the 1st Annual Confer-
ence on Robot Learning, pages 1–16.
Foote, T. (2013). tf: The transform library. In Technologies
for Practical Robot Applications (TePRA), 2013 IEEE
International Conference on, Open-Source Software
workshop, pages 1–6.
for Standardization of Automation, A. and Systems, M.
(2022). Asam opendrive. https://www.asam.net/
standards/detail/opendrive/. Last accessed 09 Novem-
ber 2022.
Ge, X., Li, Z., and Li, S. (2017). 5g software defined ve-
hicular networks. IEEE Communications Magazine,
55(7):87–93.
He, J., Tang, Z., Fu, X., Leng, S., Wu, F., Huang, K., Huang,
J., Zhang, J., Zhang, Y., Radford, A., Li, L., and
Xiong, Z. (2019). Cooperative connected autonomous
vehicles (cav): Research, applications and challenges.
In 2019 IEEE 27th International Conference on Net-
work Protocols (ICNP), pages 1–6.
Hoffmann, G. M., Tomlin, C. J., Montemerlo, M., and
Thrun, S. (2007). Autonomous automobile trajectory
tracking for off-road driving: Controller design, ex-
perimental validation and racing. In 2007 American
Control Conference, pages 2296–2301. IEEE.
International, S. (2021). Sae international levels of driving
automation. https://www.sae.org/binaries/content/
assets/cm/content/blog/sae-j3016-visual-chart 5.3.
21.pdf. Last accessed 03 November 2022.
Kato, S., Tokunaga, S., Maruyama, Y., Maeda, S.,
Hirabayashi, M., Kitsukawa, Y., Monrroy, A., Ando,
T., Fujii, Y., and Azumi, T. (2018). Autoware on
board: Enabling autonomous vehicles with embedded
systems. In 2018 ACM/IEEE 9th International Con-
ference on Cyber-Physical Systems (ICCPS), pages
287–296.
Kukkala, V. K., Tunnell, J., Pasricha, S., and Bradley, T.
(2018). Advanced driver-assistance systems: A path
toward autonomous vehicles. IEEE Consumer Elec-
tronics Magazine, 7(5):18–25.
Lee, J.-G., Kim, K. J., Lee, S., and Shin, D.-H. (2015). Can
autonomous vehicles be safe and trustworthy? effects
of appearance and autonomy of unmanned driving
systems. International Journal of Human–Computer
Interaction, 31(10):682–691.
Liao, Y., Xie, J., and Geiger, A. (2021). KITTI-
360: A novel dataset and benchmarks for urban
scene understanding in 2d and 3d. arXiv preprint
arXiv:2109.13410.
Marin-Plaza, P., Hussein, A., Martin, D., and de la Escalera,
A. (2019). icab use case for ros-based architecture.
Robotics and Autonomous Systems, 118:251–262.
Marin-Plaza, P., Yag
¨
ue-Cuevas, D., Royo, F., de Miguel,
M. A., Moreno, F. M., Ruiz-de-la Cuadra, A.,
Viadero-Monasterio, F., Garcia, J., San Roman, J. L.,
and Armingol, J. M. (2021). Project ares: Driverless
transportation system. challenges and approaches in
an unstructured road. Electronics, 10(15).
Metta, G., Fitzpatrick, P., and Natale, L. (2006). Yarp: yet
another robot platform. International Journal of Ad-
vanced Robotic Systems, 3(1):8.
Michel, G. and Du Lac, N. (2009). The rtmaps soft-
ware, an integration platform for multi-parnter coop-
erative projects developing multi-sensor applications.
In 16th ITS World Congress and Exhibition on Intelli-
gent Transport Systems.
Moore, T. and Stouch, D. (2014). A generalized extended
kalman filter implementation for the robot operating
system. In Proceedings of the 13th International Con-
ference on Intelligent Autonomous Systems (IAS-13).
Ortega, V., Bouchmal, F., and Monserrat, J. F. (2018).
Trusted 5g vehicular networks: Blockchains and
content-centric networking. IEEE Vehicular Technol-
ogy Magazine, 13(2):121–127.
Quigley, M., Conley, K., Gerkey, B., Faust, J., Foote, T.,
Leibs, J., Wheeler, R., Ng, A. Y., et al. (2009). Ros: an
open-source robot operating system. In ICRA work-
shop on open source software. Kobe, Japan.
Rao, Q. and Frtunikj, J. (2018). Deep learning for self-
driving cars: Chances and challenges. In Proceed-
ings of the 1st International Workshop on Software
Engineering for AI in Autonomous Systems, SEFAIS
’18, page 35–38, New York, NY, USA. Association
for Computing Machinery.
Seif, H. G. and Hu, X. (2016). Autonomous driving in the
icity—hd maps as a key challenge of the automotive
industry. Engineering, 2(2):159–162.
Shengbo, L., Yang, G., Lian, H., Hongbo, G., Jingliang,
D., Shuang, L., Yu, W., Bo, C., Keqiang, L., Wei, R.,
et al. (2019). Key technique of deep neural network
and its applications in autonomous driving. Journal of
Automotive Safety and Energy, 10(2):119.
Stroescu, A., Cherniakov, M., and Gashinova, M. (2019).
Classification of high resolution automotive radar im-
agery for autonomous driving based on deep neural
networks. In 2019 20th International Radar Sympo-
sium (IRS), pages 1–10.
WONSang-Yeon, JEONYoung-Jae, JEONGHyun-Woo,
and KWONChan-Oh (2020). A comparison of ko-
rea standard hd map for actual driving support of au-
tonomous vehicles and analysis of application layers.
Journal of the Korean Association of Geographic In-
formation Studies, 23(3):132–145.
Yag
¨
ue-Cuevas, D., Ru
´
ız-de-la Cuadra, A., Mar
´
ın-Plaza, P.,
and Mar
´
ıa-Armingol, J. (2021). Optimizacion del en-
torno de simulaci
´
on para el depurado de arquitectura
software en veh
´
ıculos aut
´
onomos. pages 857–861.
Yang, Y. and Hua, K. (2019). Emerging technologies for 5g-
enabled vehicular networks. IEEE Access, 7:181117–
181141.
VEHITS 2023 - 9th International Conference on Vehicle Technology and Intelligent Transport Systems
272
