
Optimization of SNP Search Based on Masks
Using Graphics Processing Unit
´
Alvaro Magri Nogueira da Cruz
1 a
, Vitoria Zanon Gomes
1 b
, Matheus Carreira Andrade
1 c
,
Anderson Rici Amorim
1 d
, Carlos Roberto Val
ˆ
encio
1 e
, Gilberto Vaughan
2 f
and Geraldo Francisco Doneg
´
a Zafalon
∗,1 g
1
Department of Computer Science and Statistics, Universidade Estadual Paulista (UNESP),
Rua Crist
´
ov
˜
ao Colombo, 2265, Jardim Nazareth, S
˜
ao Jos
´
e do Rio Preto - SP, 15054-000, Brazil
2
Division of Viral Hepatitis, Centers for Diseases Control and Prevention, Atlanta, 30329, U.S.A.
Keywords:
Single Nucleotide Polymorphism, Next Generation Sequencing, Graphics Processing Unit, Parallel
Processing, Bioinformatics.
Abstract:
In the context of bioinformatics one of the most important problems to be solved is the search for simple nu-
cleotide polymorphism (SNP). When we perform the analysis of the files from the next generation sequencing
(NGS) the search task for SNPs becomes more prohibitive due to the millions of sequences present on them.
CPU multithreaded approaches are not enough when millions of sequences as considered. Then, the use of
graphics processing units (GPUs) is a better alternative, because it can operate with hundreds of arithmetic
logic units while CPU with no more than tens. Thus, in this work we developed a method to detect SNPs using
a mask approach under GPU architecture. In the tests, a speedup of up to 5175.86 was obtained when com-
pared to the multithreaded CPU approach, evaluating from 100,000 to 800,000 sequences using five masks to
detect the occurrence of SNPs.
1 INTRODUCTION
One area that stands out with Bioinformatics is the
search for Single Nucleotide Polymorphism (SNP)
(Trick et al., 2009). A SNP is defined as a single
change of base in a DNA sequence. The DNA se-
quence is a linear combination of four nucleotides:
Adenine (A), Thymine (T), Cytosine (C) or Guanine
(G). When comparing two DNA sequences, position
by position, the presence of different nucleotides in
the same position is defined by SNP (Trick et al.,
2009; Sachidanandam et al., 2001). However, for a
locus to be classified as polymorphic, or to be termed
as a SNP, the variation must be frequent at least 1%
of the general population, otherwise the phenomenon
a
https://orcid.org/0000-0002-7918-0109
b
https://orcid.org/0000-0003-4176-566X
c
https://orcid.org/0000-0002-1670-266X
d
https://orcid.org/0000-0001-7862-7530
e
https://orcid.org/0000-0002-9325-3159
f
https://orcid.org/0000-0002-7863-3970
g
https://orcid.org/0000-0003-2384-011X
is called mutation (Rall
´
on et al., 2010; Li and Sadler,
1991).
The detection of SNPs in nucleotide sequences
is fundamental for possible inferences about diseases
and responses to treatments, in addition to predic-
tions to susceptibility (Chatterjee et al., 2016). The
analyzes are performed on files generated by DNA
sequencers. Recently, new generation sequencers
(NGS) are the focus (Jia et al., 2017; Cheng et al.,
2017; Mohanty et al., 2017). Thus, methods that
assist in the analysis of the data produced by these
sequencers are necessary, since they generate large
data volumes, especially when compared with Sanger
(Pabinger et al., 2014) sequencers.
The SNPs search using masks (Zafalon et al.,
2018; Campo et al., 2014) has become an important
task in recent years. In the biological context, a mask
is a defined set of characters. The task consists of
searching for a determined string of characters, in a
sequence, and considers a SNP the subsequent posi-
tion to the mask. For example, when searching for
the mask ”ATG” in the sequence ”ACTATGCTC”,
we notice that from the fourth to the sixth character a
134
Nogueira da Cruz, Á., Gomes, V., Andrade, M., Amorim, A., Valêncio, C., Vaughan, G. and Zafalon, G.
Optimization of SNP Search Based on Masks Using Graphics Processing Unit.
DOI: 10.5220/0011841500003467
In Proceedings of the 25th International Conference on Enterprise Information Systems (ICEIS 2023) - Volume 2, pages 134-141
ISBN: 978-989-758-648-4; ISSN: 2184-4992
Copyright
c
2023 by SCITEPRESS – Science and Technology Publications, Lda. Under CC license (CC BY-NC-ND 4.0)

match was obtained, then the seventh position, char-
acter ”C” is the SNP position.
The most relevant question around NGS is the size
of its output files, as they easily exceed the gigabytes
(Brouwer et al., 2016). Therefore, the amount of se-
quences to be analyzed is also huge. Thus, strate-
gies which use of parallel computing are indispens-
able to manipulate and process the data. However,
some approaches are not enough to reduce the exe-
cution time to process these files, for example, if the
choice is multithreaded one. As can be seen in (Lang-
don and Lam, 2017), when dealing with a large vol-
ume of data, the multithreaded strategy applied to pro-
cessors is not as efficient when compared to the use of
clusters (Manogaran et al., 2018), grids (Langmead
and Nellore, 2018) and GPUs (Hemani et al., 2011).
Considering the three strategies aforementioned, the
one better fits to the problem is the GPU. This asser-
tion might be done because the SNP search is a task
that performs a large volume of simple comparison
instructions, which can performed with excellence by
the many cores of GPU.
This work is organized as follows: in section 2,
we describe literature methods about the SNP search
problem with GPU optimization. In Section 3, we de-
tail our methodology to carry out the SNP search with
GPU architecture. In Section 4, we show the results
of our method, focusing on time execution improve-
ment. Finally, in Section 5, we make our conclusions
about the work.
2 RELATED WORKS
Concerning methods about SNPs, we have GBOOST
(Yung et al., 2011), which is a BOOST method im-
provement with GPU support. BOOST method aims
to find patterns of SNPxSNP interactions through
comparisons between SNP pairs, as well as (Tsai
et al., 2017) developed an algorithm to compute a
complete significant SNP search and the main effects
of the SNPxSNP interactions. The performed opera-
tions in the SNP pairs comparisons are of the O(nm)
order, in which n is the samples number of SNPs
and m is the distinct SNPs number. With the GPU
use, it obtained a 40 times speedup, given that GPUs
are efficient in bit operations (Yung et al., 2011).
The achieved improvement can be seen in the per-
formed test for BOOST method, which took 2.5 days,
while GBOOST 1.34 hours in a computer with Nvidia
GeForce GTX 285 GPU.
In (Zafalon et al., 2018) was developed a multi-
threaded SNP search method using masks, to improve
the search process that was done sequentially. For
that, the multithreaded processing of the CPU was
used to allow the execution of the algorithm in the
FASTA files provided by the Sanger sequencing and
obtained a 98.05 speedup. However, the proposed
method is unfeasible for the processing of genomic
data provided by NGS, which is widely used today
and has millions of sequences instead of hundreds.
Elgart et al. (2022) proposed an ensemble method
of SNP selection with gradient boosted trees (XG-
Boost) to select SNPs non-linear and interactions ef-
fects, getting an great in the percentage variance when
compared to the standard linear PRS model.
Wagner et al. (2020) checks SNP-SNP interac-
tions in genes as a way to identify if they are a pos-
sible cause of renal cell carcinoma, by the evasion of
immune surveillance by tumor cells. The HaploReg
v4.1 and RegulomeDB tools were used to analyze the
interactions.
Nobre et al. (2020) proposed a CPU+GPU ap-
proach to detect multiple SNPs to correlate genotypes
with a number of traits. The GPU part of the method
relies on CUDA cores, and five different CPU+GPU
configurations were used to evaluate the SNP-SNP in-
teractions, achieving a performance close to the theo-
retically possible for GPUs.
Sreeharsh et al. (2022) proposed a new algorithm
called Kernelized Scalable Random Sampling with
Iterative Optimization Fuzzy c-Means, based on an
Apache Spark. The kernel function here is used to to
achieve better mapping for non-linear datasets while
avoid the problem of loading the entire data in the
memory all at once.
Wienbrandt et al. (2021) proposed a new tool
called SNPInt-GPU for epistasis testing using Nvidia
CUDA framework and can be used without the GPU
hardware as well, implementing logistic regression,
BOOST, log-linear regression, mutual information
and information gain to help with the SNP interac-
tions analysis.
Finally, in (Shen et al., 2017) was performed an
interaction analysis of two locus in all genome for
which identified epistatic multiple SNP pairs, which
can offer prostate cancer risk. It was found significant
potential epistasis, that can contribute to the growth
of prostate cancer. In the computational scope, it is
clean the need of automatic methods for SNP analy-
sis. The GBOOST (Yung et al., 2011) and SHEsisEpi
(Hu et al., 2010) tools were used, respectively, for
SNP-SNP interactions analysis and to validate it. The
use of these tools corroborates with the importance of
the development of new methods to contribute to SNP
studies.
Optimization of SNP Search Based on Masks Using Graphics Processing Unit
135
3 MATERIALS AND METHODS
3.1 Processing Outside the GPU
The GPU can not seek data in secondary memory and
processing it. For that, it is necessary to load the data
in primary memory, i.e, RAM. In this case, we have
two data on analysis: sequences and masks.
Sequences
+
qualities
Masks
Mask
insert
RAM
Secondary memory
.fastq file
ATGC
TCCTGCC
.
.
.
TGTGCAGT
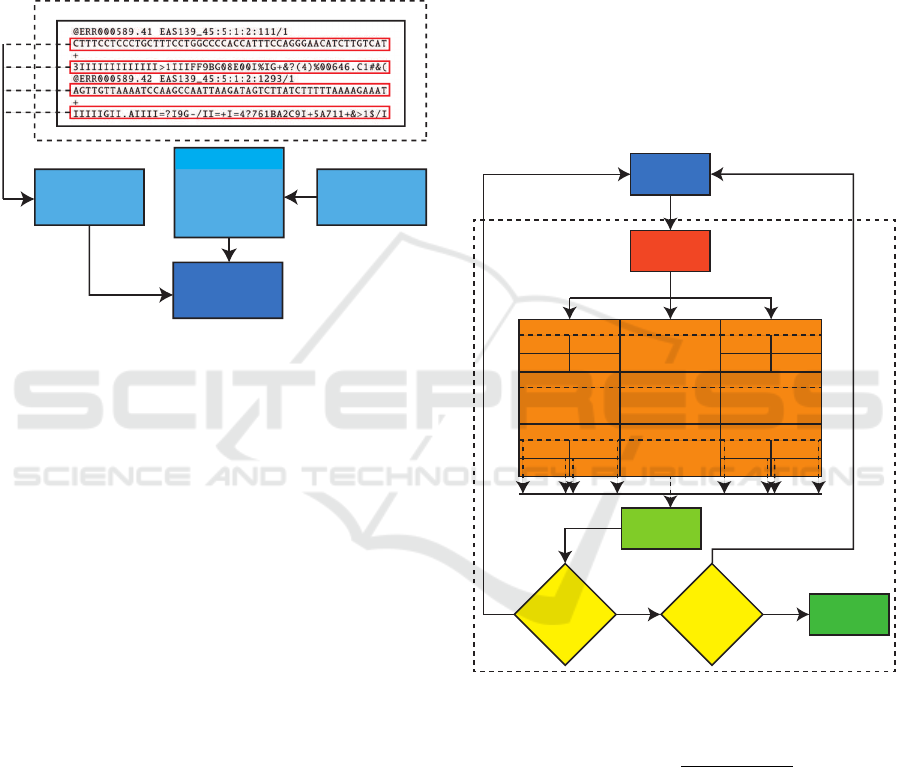
Figure 1: Flowchart of external GPU processing.
As can be seen in the flowchart (Figure 1), the
fastq file has other extra data in addition target se-
quences. Among the contained data in the file, it has
the sequence names, then the sequence itself, and, be-
low the “+” character, we have the nucleotide quality
obtained by sequencing. It is important to notice that
the file follows the order previously mentioned.
Moreover, as input to the method, we need the in-
sertion of masks. A mask, as described by (Campo
et al., 2014) and (Zafalon et al., 2018), is predefined
character sequences that precede an SNP occurrence.
Given this, sequences and masks in the primary mem-
ory can be loaded by GPU.
3.2 GPU Internal Processing
GPU processes can be divided into two stages: file
segmentation and processing load distribution. The
first, referring to files that are larger than the GPU
memory, while the second aims to perform the load
distribution process, i.e, the distribution of a sequence
for the available thread, after that it is possible to per-
form the SNP search.
3.2.1 File Segmentation
Generally, GPU has a memory capacity smaller than
computer primary memory. Thus, it is necessary the
file segmentation for files that are larger than GPU
memory capacity. Thus, a clear difference between
the CPU multithreaded method and GPU method can
be noticed, given that the CPU method can access
primary memory to process the data. However, the
small memory capacity of the GPUs is compensated
for larger quantity processing cores, which can im-
prove a possible problem with much segmentation of
a large scale file in a number of sequences.
It is possible to notice in Figure 2 that GPU loads
the sequences and masks which are in primary mem-
ory. This process can be segmented depending on file
size under analysis following the Equation 1, in which
FileSize represents the file size, GPU capacity how
much available memory GPU has and segments is the
number of parts in which the file must be divided.
RAM
GPU
One sequence per thread
Sequences + masks +
qualities
Block 1,1
Thread 1 Thread 2
Thread 3 Thread K
. . . Block 1,N
Thread 1 Thread 2
Thread 3 Thread K
. . .
Block M,1
Thread 1 Thread 2
Thread 3 Thread K
Block M,N
Thread 1 Thread 2
Thread 3 Thread K
. . .
. . .
. . .
. . .
. . . . . .
. . .
. . .
SNP
Search
Are there
any sequence
left?
Yes
No
Result
No
Yes
GPU
Are there
any mask
left?
Figure 2: Flowchart of GPU internal processing.
[segments] =
FileSize
GPUcapacity
, (1)
where,
[segments] = min{n ∈ Z|n ≥ segments}
3.2.2 Processing Load Distribution
Following the segmentation process, or not in the case
of the file not be bigger than GPU available memory,
we have the distribution process of the sequences for
threads.
It is important to emphasize that threads block
representation is a necessary abstraction for program-
ICEIS 2023 - 25th International Conference on Enterprise Information Systems
136

ming in GPUs, because only in this way it is possible
to assign specific tasks to threads.
In order to facilitate the programming and un-
derstanding the method, an abstraction in 1D was
adopted, thus defining a specific index of thread as
shown in Equation 2.
identi f ier = blockIdx.x ∗ blockDim.x +threadIdx.x
(2)
3.3 SNP Search
SNP search, codified in Algorithm 1, it is performed
after the processing load distribution, i.e, after each
sequence be assigned to a thread, the search is car-
ried out. As can be seen in Algorithm 1, each thread
has a id, which also identifies a sequence in the in-
put set of sequences. Thus, e.g, identifier number
356 represents the sequence number 356 that will be
processed by GPU thread that has the same identifier.
When completing the search, the number of SNP oc-
currences of nucleotides A, T, G, and C are returned.
In the end, all occurrences are counted for a given
mask, and if there is another mask to be searched,
continue the SNP search.
Algorithm 1: SNP search algorithm over GPU architecture.
Input: Sequences, Qualities, NumberofSequences,
A, T, G, C, Mask, MinimumQuality
Output: Number of SNPs occurrences A, T, G e C
id ← threadIdx.x + blockIdx.x ∗ blockDim.x;
if (id < NumberOfSequences) then
while (end of sequence) do
if (Mask ⊂ Sequences[id] and Qualities[id] >=
MinimumQuality) then
SNP ← position after the mask occurred;
SNPQuality ← SNP quality found;
if (SNP == ‘A’) and (SNPQuality >= Mini-
mumQuality) then
A ← A + 1;
elseif (SNP == ‘T’) and (SNPQuality >= Min-
imumQuality) then
T ← T + 1;
elseif (SNP == ‘C’) and (SNPQuality >= Min-
imumQuality) then
C ← C + 1;
elseif (SNP == ‘G’) and (SNPQuality >= Min-
imumQuality) then
G ← G + 1;
end
end
end
end
return A, T, G e C
4 RESULTS
4.1 Test Platforms
All test cases in the present work were performed at
the Laboratory of Bioinformatics at UNESP, S
˜
ao Jos
´
e
do Rio Preto campus. The tests were run under in
a computer with Windows 10 operating system, ar-
chitecture 64 bits, Intel (R) Core (TM) processor i7-
6700HQ 2.60GHz with 4 cores, 32GB of RAM, GPU
GeForce GTX 960, which has 1127MHz of process-
ing, 1024 CUDA cores and 2GB.
4.2 Tests
In order to evaluate the behavior and performance of
the method, it was decided to vary the number of se-
quences and the number of masks used to search for
SNPs. The sequences were provided by the Centers
for Disease Control and Prevention (CDC). The be-
havior of the method is observed by increasing the
volume of data to be analyzed. Each combination
number of sequences versus the number of masks was
performed 5 times, to obtain greater statistical consis-
tency in the collected data. In this way, a comparison
is made with the method that uses the multithreaded
technology in order to verify possible performance
gains with the use of the GPU, for this the speedup
(Eager et al., 1989) is evaluated average obtained. The
speedup is defined as the amount of time it takes to
run a program with one processor (sequential execu-
tion), by the time it takes to run when p processors are
available. Then, the speedup is defined by the equa-
tion 3:
S(p) =
T (1)
T (p)
, (3)
where T(1): execution time using a single proces-
sor and T (p): execution time using p processors.
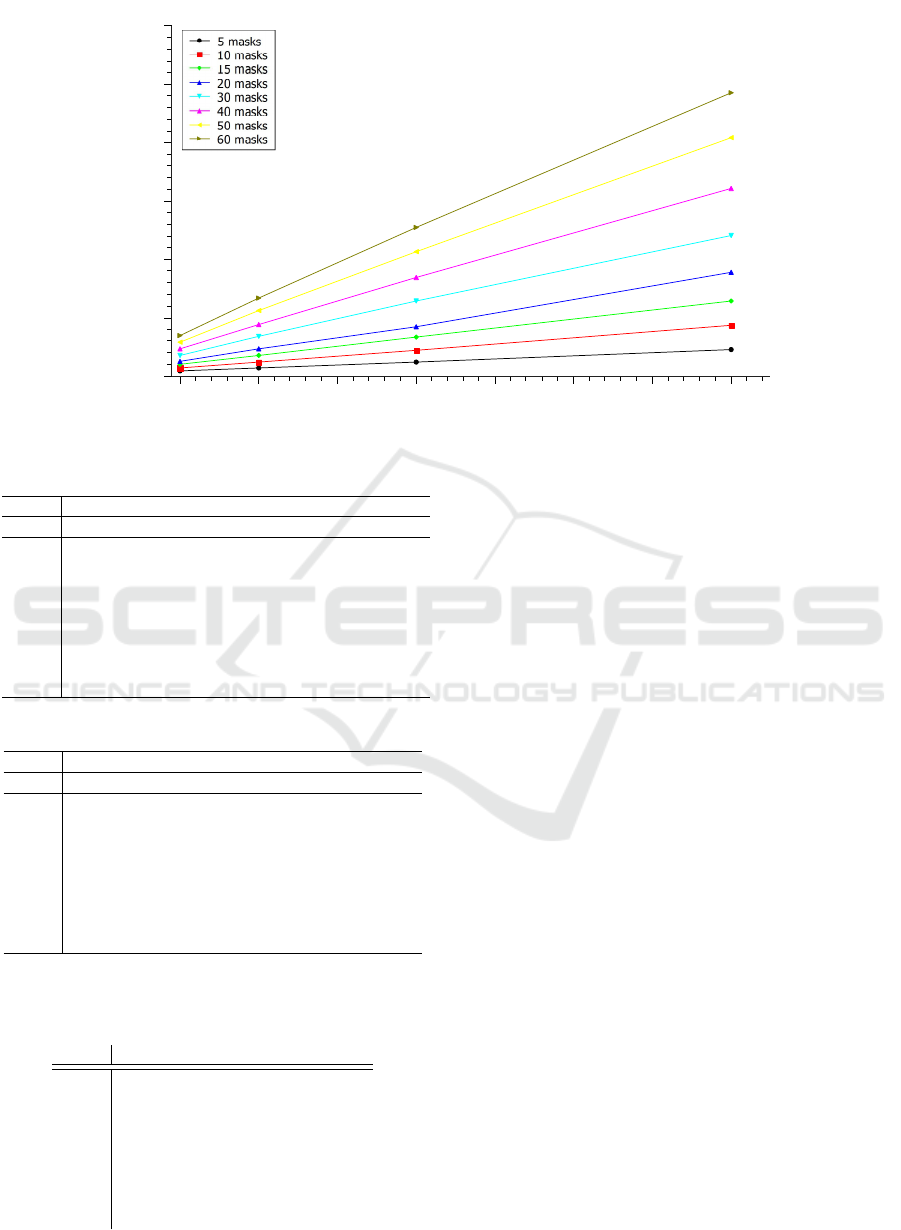
When looking at Figure 3 it is possible to notice
that the number of masks affects the performance of
the method as much as the number of sequences an-
alyzed. This fact is evident, given that the proces-
sor used has four processing cores, so it can process
a maximum of four masks at the same time. As a
result, for every four more masks the processor will
need a new round of masks processing. The perfor-
mance of the method is linked to the number of cores
available in the processor used, i.e, the more cores the
greater the performance of the method. The best exe-
cution time observed was 487.34 seconds for a com-
bination of 100,000 sequences and only five masks,
while the worst time observed was 165,241.50 sec-
onds for 800,000 sequences and 60 masks, see Ta-
Optimization of SNP Search Based on Masks Using Graphics Processing Unit
137

ble 1. In addition, the standard deviations for each
test case are shown in Table 2. It is noteworthy that
there is an increase in the oscillation in the execution
time as the number of sequences increases, as well
as the number of masks. Since the method is multi-
threaded, cores can only be allocated for further pro-
cessing once all cores are free again. As a result, stan-
dard deviations are linked to the waiting time in the
allocation of cores.
Concerning the GPU tests, see Table 1, the best
result achieved was 0.84 seconds for combining
100,000 sequences and five masks, and the worst ex-
ecution time was 48.47 seconds with the combination
of 800,000 sequences and 60 masks. In Table 2 it
can be seen that the method is more stable than under
CPU architecture, when considering the low standard
deviations when compared to those in Table 2. It can
be seen in Figures 3 and 4 that as in the CPU multi-
threaded architecture, the number of masks analyzed
also influenced the performance of the algorithm in
the GPU. However, it is possible to notice the perfor-
mance gains when comparing the methods.
In order to describe a comparison between the
methods, a study was made on the speedup obtained
by the proposed method when contrasted to the multi-
threaded method. For this, we calculated the average
time execution with each mask used, i.e, we summed
all tests with one mask and divided by the number
of tests, with this we have the average time with one
specific mask, we did this process with all masks. It
is noticed in Table 3 that the highest average speedup
obtained was with the use of five masks, thus optimiz-
ing the method using GPU in 5,175.86 times. How-
ever, it is evident that the increase in the number of
masks directly impacts the algorithm speedup, veri-
fied in the use of 50 masks which achieved 1,943.88
of speedup. Also, from Table 3 it can be seen that the
method tends to stabilize close to 2,000 of speedup as
the number of masks grows. It is important to notice
that in the worst test case performed, the GPU’s per-
formance was 1,943 times faster than the CPU, which
further highlights the new method.
To validate the new method on a large scale of se-
quences, six extra tests were carried out compared to
the comparison of CPU against GPU, with files from
512MB to 16GB of data. Besides, in order to demon-
strate how impractical the tests on this scale are with
the use of CPU, a degree two polynomial regression
study was performed on the data obtained in previous
CPU tests. To be more precise in the execution time
estimation, eight different regression equations were
calculated, one for each set of masks. The equations
are:
• 5 masks: y = 6.79 ∗ 10
−8
x
2
− 9.30 ∗ 10
−3
x +
864.27 (R
2
= 0.9999);
• 10 masks: y = 8.07 ∗ 10
−8
x
2
− 1.16 ∗ 10
−2
x +
1, 144.32 (R
2
= 0.9999);
• 15 masks: y = 1.18 ∗ 10
−7
x
2
− 1.22 ∗ 10
−2
x +
1, 144.59 (R
2
= 0.9999);
• 20 masks: y = 1.23 ∗ 10
−7
x
2
− 1.13 ∗ 10
−2
x +
1, 246.35 (R
2
= 0.9999);
• 30 masks: y = 1.33 ∗ 10
−7
x
2
− 1.64 ∗ 10
−2
x +
1, 554.47 (R
2
= 0.9999);
• 40 masks: y = 2.14 ∗ 10
−7
x
2
− 2.78 ∗ 10
−2
x +
2, 669.60 (R
2
= 0.9999);
• 50 masks: y = 2.20 ∗ 10
−7
x
2
− 2.99 ∗ 10
−2
x +
2, 908.49 (R
2
= 0.9999);
• 60 masks: y = 3.02 ∗ 10
−7
x
2
− 3.45 ∗ 10
−2
x +
3, 708.89 (R
2
= 0.9999);
x is the number of sequences and y the SNP search
time (in seconds).
R
2
= 0.9999 of the equations stands out, which
means that the equation describes the set with 99.99%
accuracy. In Table 4 we can noticed the estimates for
tests from 1,600,000 to 51,200,000 of sequences, in
CPU architecture. When analyzing, it is evident that
it is not plausible to carry out these tests in a feasible
time to complete this work, since in its worst case it
would take 9,127.10 days.
In Tables 5, we have the execution times for large
scale tests, i.e, millions of sequences, for GPU archi-
tecture. The best execution time observed was 8.19
seconds with the use of five masks and 1,600,000
sequences. On the other hand, the worst case was
511.33 seconds with 60 masks and 51,200,000 se-
quences. The superiority in performance is evident
when compared to Table 4 because all tests in the
CPU took into days. Furthermore, Table 6 shows
the stability of the proposed method, given that stan-
dard deviations remain low even under large-scale
performance tests. Finally, if we sum the total run-
ning time of both methods, we can see the discrep-
ancy between CPU and GPU methods, in which CPU
obtained 51.54 days adding all the tests, while GPU
achieved 0.02 days or 28.8 minutes for the tests with
100,000 until 800,000 sequences. However, if sum
all test with GPU method, we obtained 0.42 days or
10.08 hours of execution that is so smaller than CPU
tests.
5 CONCLUSIONS
The application of the GPU-based strategy can op-
timize the execution time when searching for SNPs.
ICEIS 2023 - 25th International Conference on Enterprise Information Systems
138

Table 1: CPU and GPU method execution time (in seconds).
CPU GPU
Number of sequences
Masks 100,000 200,000 400,000 800,000 100,000 200,000 400,000 800,000
5 487.34 1,942.67 7,898.83 36,895.69 0.84 1.38 2.37 4.54
10 638.05 2,332.78 9,296.58 43,578.87 1.38 2.44 4.36 8.71
15 937.87 3,760.48 15,098.26 67,334.90 2.05 3.52 6.63 12.91
20 971.34 3,859.09 15,439.90 69,188.67 2.47 4.63 8.49 17.79
30 996.57 4,019.79 16,049.51 73,562.26 3.53 6.78 12.85 24.12
40 1,586.56 6,446.14 25,386.36 117,364.60 4.66 8.84 16.93 32.17
50 1,625.08 6,586.60 25,687.37 119,713.90 5.76 11.20 21.27 40.80
60 2,177.88 8,935.98 35,656.64 165,241.50 6.92 13.31 25.45 48.47
Table 2: Standard deviations of tests under CPU and GPU methods.
CPU GPU
Number of sequences
Masks 100,000 200,000 400,000 800,000 100,000 200,000 400,000 800,000
5 2.51 19.17 63.93 360.91 0.18 0.12 0.18 0.25
10 4.56 27.68 108.99 303.19 0.06 0.13 0.2 0.41
15 4.86 31.07 201.47 790.95 0.1 0.21 0.37 0.47
20 11.61 19.26 79.92 528.23 0.21 0.31 0.41 0.03
30 3.91 45.92 75.53 452.21 0.18 0.36 0.48 0.12
40 5.43 70.03 207.94 848.24 0.27 0.47 0.4 0.09
50 16.94 32.90 169.27 1,374.84 0.27 0.16 0.69 0.27
60 6.91 125.51 338.52 973.32 0.34 0.46 0.56 0.12
U
UUan
H
H
H
H
UU
H H H H H H H H H
Figure 3: Test chart on multithreaded architecture of a four cores CPU for until 800,000 sequences and until 60 masks.
Table 3: GPU test Speedup.
N. of Masks Speedup
5 5,175.86
10 3,306.59
15 3,470.66
20 2,680.95
30 2,001.04
40 2,048.59
50 1,943.88
60 2,251.84
It should be noted that the speedup obtained touched
5,716.86 in a test case which analyzed from 100,000
to 800,000 sequences using five masks. Furthermore,
we can note that the performance of the method is
linked to the processing capacity of the GPU, i.e,
the more memory, number of cores, and processing
speed, the better the proposed algorithm will behave.
Future studies will focus on larger tests in the
number of sequences and more masks. Also, an-
other possibility is to perform tests with more pow-
Optimization of SNP Search Based on Masks Using Graphics Processing Unit
139
U
UUan
UU
H H H H H H H H
Figure 4: Test chart on GPU architecture with 384 cores for until 800,000 sequences and until 60 masks.
Table 4: Forecasting CPU tests (in days).
Number of sequences (in millions)
Masks 1.6 3.2 6.4 12.8 25.6 51.2
5 1.85 7.71 31.51 127.37 512.22 2,054.36
10 2.19 9.15 37.43 151.41 609.02 2,442.88
15 3.3 13.62 55.34 223.12 896.06 3,591.43
20 3.4 14.05 57.12 230.36 925.29 3,708.88
30 3.65 15.17 61.85 249.78 1,003.91 4,025.33
40 5.85 24.35 99.35 401.42 1,613.81 6,471.62
50 5.99 24.97 102 412.33 1,658.09 6,649.97
60 8.25 34.33 140.10 566.10 2,275.96 9,127.10
Table 5: GPU performed tests (in seconds).
Number of sequences (in millions)
Masks 1.6 3.2 6.4 12.8 25.6 51.2
5 8.19 8.68 17.21 33.65 42.54 41.81
10 15.97 16.89 33.53 66.16 81.75 83.61
15 23.84 25.45 50.21 99.39 122.59 128.66
20 31.86 34.11 67.40 136.01 163.46 170.54
30 47.74 50.02 100.97 204.35 247.47 256.45
40 63.37 66.69 134.2 271.06 326.42 337.29
50 79.47 83.11 167.42 335.64 414.2 422.68
60 96.67 101.44 201.89 402.86 492.29 511.33
Table 6: Standard deviations for large-scale testing under
GPU architecture.
Number of sequences (in millions)
Masks 1.6 3.2 6.4 12.8 25.6 51.2
5 0.04 0.09 0.12 0.14 0.55 0.24
10 0.03 0.03 0.16 0.32 1.24 1.04
15 0.03 0.72 0.21 0.50 0.67 1.18
20 0.16 0.90 0.94 1.18 0.91 1.53
30 0.08 0.07 0.57 1.80 0.11 1.26
40 0.16 0.16 0.37 0.42 1.15 1.77
50 0.14 0.11 0.32 1.02 1.45 3.88
60 0.20 0.87 0.38 1.91 1.44 1.27
erful GPUs or even with multiple GPUs in order to
ascertain their behavior. This work brings many con-
tributions to the development of new methods about
SNP searches, which are relevant for biologists and
geneticists into their processes of decision-making.
ACKNOWLEDGEMENTS
The authors would like to thank Coordenac¸
˜
ao de
Aperfeic¸oamento de Pessoal de N
´
ıvel Superior -
Brasil (CAPES), under grants 88882.434386/2019-01
and 88887.686064/2022-00, and S
˜
ao Paulo Research
Foundation (FAPESP), under grants 2019/00030-3
and 2020/08615-8, for the partial financial support.
REFERENCES
Brouwer, C., Vu, T. D., Zhou, M., Cardinali, G., Welling,
M. M., van de Wiele, N., and Robert, V. (2016). Cur-
rent opportunities and challenges of next generation
sequencing (ngs) of dna; determining health and dis-
eases. Biotechnol. J, 13(4).
Campo, D. S., Dimitrova, Z., Yamasaki, L., Skums, P.,
Lau, D. T., Vaughan, G., Forbi, J. C., Teo, C.-G.,
and Khudyakov, Y. (2014). Next-generation sequenc-
ing reveals large connected networks of intra-host hcv
variants. BMC genomics, 15(5):S4.
Chatterjee, N., Shi, J., and Garc
´
ıa-Closas, M. (2016).
Developing and evaluating polygenic risk prediction
models for stratified disease prevention. Nature Re-
views Genetics, 17(7):392.
Cheng, J. Y., Mailund, T., Nielsen, R., and Stegle, O.
(2017). Fast admixture analysis and population tree
ICEIS 2023 - 25th International Conference on Enterprise Information Systems
140

estimation for snp and ngs data. Bioinformatics,
33(14):2148–2155.
Eager, D. L., Zahorjan, J., and Lazowska, E. D. (1989).
Speedup versus efficiency in parallel systems. IEEE
Transactions on Computers, 38(3):408–423.
Elgart, M., Lyons, G., Romero-Brufau, S., Kurniansyah, N.,
Brody, J. A., Guo, X., Lin, H. J., Raffield, L., Gao, Y.,
Chen, H., et al. (2022). Non-linear machine learning
models incorporating snps and prs improve polygenic
prediction in diverse human populations. Communi-
cations biology, 5(1):1–12.
Hemani, G., Theocharidis, A., Wei, W., and Haley, C.
(2011). Epigpu: exhaustive pairwise epistasis scans
parallelized on consumer level graphics cards. Bioin-
formatics, 27(11):1462–1465.
Hu, X., Liu, Q., Zhang, Z., Li, Z., Wang, S., He, L., and Shi,
Y. (2010). Shesisepi, a gpu-enhanced genome-wide
snp-snp interaction scanning algorithm, efficiently re-
veals the risk genetic epistasis in bipolar disorder. Cell
research, 20(7):854.
Jia, M., Guan, J., Zhai, Z., Geng, S., Zhang, X., Mao, L.,
and Li, A. (2017). Wheat functional genomics in the
era of next generation sequencing: An update. The
Crop Journal.
Langdon, W. B. and Lam, B. Y. H. (2017). Genetically
improved barracuda. BioData mining, 10(1):28.
Langmead, B. and Nellore, A. (2018). Cloud computing
for genomic data analysis and collaboration. Nature
Reviews Genetics, 19(4):208.
Li, W.-H. and Sadler, L. A. (1991). Low nucleotide diversity
in man. Genetics, 129(2):513–523.
Manogaran, G., Vijayakumar, V., Varatharajan, R., Kumar,
P. M., Sundarasekar, R., and Hsu, C.-H. (2018). Ma-
chine learning based big data processing framework
for cancer diagnosis using hidden markov model and
gm clustering. Wireless personal communications,
102(3):2099–2116.
Mohanty, A. S., Gomez-Gelvez, J. C., Petrova-Drus, K.,
Zaidinski, M., Wang, W., Yao, J. J., Ho, C., Zehir,
A., and Arcila, M. E. (2017). Use of next genera-
tion sequencing and single nucleotide polymorphism
(snp) fingerprinting to assess post transplant engraft-
ment status.
Nobre, R., Santander-Jim
´
enez, S., Sousa, L., and Ilic, A.
(2020). Accelerating 3-way epistasis detection with
cpu+ gpu processing. In Workshop on job schedul-
ing strategies for parallel processing, pages 106–126.
Springer.
Pabinger, S., Dander, A., Fischer, M., Snajder, R., Sperk,
M., Efremova, M., Krabichler, B., Speicher, M. R.,
Zschocke, J., and Trajanoski, Z. (2014). A sur-
vey of tools for variant analysis of next-generation
genome sequencing data. Briefings in bioinformatics,
15(2):256–278.
Rall
´
on, N. I., Naggie, S., Benito, J. M., Medrano, J., Re-
strepo, C., Goldstein, D., Shianna, K. V., Vispo, E.,
Thompson, A., McHutchison, J., et al. (2010). Asso-
ciation of a single nucleotide polymorphism near the
interleukin-28b gene with response to hepatitis c ther-
apy in hiv/hepatitis c virus-coinfected patients. Aids,
24(8):F23–F29.
Sachidanandam, R., Weissman, D., Schmidt, S. C., Kakol,
J. M., Stein, L. D., Marth, G., Sherry, S., Mullikin,
J. C., Mortimore, B. J., Willey, D. L., et al. (2001). A
map of human genome sequence variation containing
1.42 million single nucleotide polymorphisms. Na-
ture, 409(6822):928–933.
Shen, J., Li, Z., Song, Z., Chen, J., and Shi, Y. (2017).
Genome-wide two-locus interaction analysis identi-
fies multiple epistatic snp pairs that confer risk of
prostate cancer: A cross-population study. Interna-
tional journal of cancer, 140(9):2075–2084.
Sreeharsh, N., Sawarkar, S., and Tiwari, A. (2022). Gpu-
accelerated scalable feature extraction techniques with
scalable kernelized fuzzy clustering algorithms and its
application to real-life genomics data for gene identi-
fication.
Trick, M., Long, Y., Meng, J., and Bancroft, I. (2009). Sin-
gle nucleotide polymorphism (snp) discovery in the
polyploid brassica napus using solexa transcriptome
sequencing. Plant biotechnology journal, 7(4):334–
346.
Tsai, S.-F., Tung, C.-W., Tsai, C.-A., and Liao, C.-T.
(2017). An exhaustive scan method for snp main ef-
fects and snp× snp interactions over highly homozy-
gous genomes. Journal of Computational Biology,
24(12):1254–1264.
Wagner, M., Tupikowski, K., Jasek, M., Tomkiewicz, A.,
Witkowicz, A., Ptaszkowski, K., Karpinski, P., Zdro-
jowy, R., Halon, A., and Karabon, L. (2020). Snp-snp
interaction in genes encoding pd-1/pd-l1 axis as a po-
tential risk factor for clear cell renal cell carcinoma.
Cancers, 12(12):3521.
Wienbrandt, L., K
¨
assens, J. C., and Ellinghaus, D. (2021).
Snpint-gpu: tool for epistasis testing with multiple
methods and gpu acceleration. In Epistasis, pages 17–
35. Springer.
Yung, L. S., Yang, C., Wan, X., and Yu, W. (2011). Gboost:
a gpu-based tool for detecting gene–gene interactions
in genome–wide case control studies. Bioinformatics,
27(9):1309–1310.
Zafalon, G. F. D., da Cruz,
´
A. M. N.and Amorim, A. R., An-
drade, M. C., Contessoto, A. G., Neves, L. A., Souza,
R. C. G., Val
ˆ
encio, C. R., and Sato, L. M. (2018).
Performance improvement of snp search using mul-
tithread programming. Journal of Computer Science,
14(11):1465–1474.
Optimization of SNP Search Based on Masks Using Graphics Processing Unit
141
