
The Correlation of ESG Ratings and Abnormal Returns:
An Event Study Using Machine Learning
Dominic Strube
1a
and Christian Daase
2b
1
Hochschule Wismar, University of Applied Sciences, Technology, Business and Design, Wismar, Germany
2
Institute of Technical and Business Information Systems, Otto-von-Guericke University, Magdeburg, Germany
Keywords: Environmental, Social and Governance (ESG), Impact Investing, Financial Performance, Sustainability,
Machine Learning.
Abstract: This short study uses machine learning (ML) to investigate whether the inclusion of sustainability ratings in
the training data can improve the estimated accuracy of the prediction of a company's abnormal returns. For
this purpose, we examined 72 companies that are listed in the indices EURO STOXX 50
®
or/and EURO
STOXX 50
®
ESG or/and EURO STOXX
®
ESG LEADERS 50. We found out that the mean-adjustment model
used to estimate returns produces more accurate results than with adding MSCI's sustainability ratings. The
preliminary results suggest that sustainability ratings are currently inappropriate for estimating expected or
abnormal returns and their inclusion in the training data interferes the algorithm behind the ML approach. By
extension, this leads to the assumption that the relation between ESG ratings and a business’ success are
suitably irregular to significantly decrease an ML models quality.
1 INTRODUCTION
In recent years, the importance of sustainability rating
agencies has steadily increased. These ratings are
more and more becoming tools for investors as well
as managers for strategic decision support and as
guideposts for capital investments amounting to
trillions of dollars. This assumption is also confirmed
by the inflow of funds (net of inflows and outflows)
into sustainable funds, which amounted to around
USD 650 billion worldwide in 2021. Global
sustainable fund assets reached a record level of
around USD three trillion at the end of 2021, with
Europe accounting for over 80% (Morningstar,
2022). Increasing investor demand for sustainable
investments thus calls for sustainability performance
ratings that are as objective as possible. Unlike credit
ratings, which focus on the probability of default of a
loan, environmental, social and governance (ESG)
ratings are directed at several different assessment
targets predominantly commissioned and paid for by
institutional investors such as investment funds, asset
managers, financial institutions (from the issuer's
perspective, so-called unsolicited rating)
a
https://orcid.org/0000-0003-3017-5189
b
https://orcid.org/0000-0003-4662-7055
(Christensen et al., 2022; Kögler, 2021) and influence
portfolio construction and trading (Serafeim and
Yoon, 2022). However, the relevance of ESG ratings
and their credibility are widely debated. Many studies
prove that ESG ratings have high inconsistency due
to low correlation with each other owing to diversity
of methodologies and ratings like type and number of
data, evaluation and weighting of data and rating
scales (Berg et al., 2019; Dimson et al., 2020).
Therefore, in academic research, studies
analyzing correlations between ESG aspects and
different performance indicators of a company have
become increasingly important. In particular, the
causality of ESG ratings by major sustainability
rating agencies on the future development of the
financial performance of rated companies is currently
a much-studied area of research. The findings
indicate that over a long-term span, roughly nine out
of ten studies exhibit a correlation between ESG and
financial performance that is not negative (Friede et
al., 2015; Whelan et al., 2020). Furthermore, ESG
portfolios yield better returns compared to
conventional investments, particularly for long-term
investors, and offer safeguards against losses during
76
Strube, D., Strube, D., Daase, C. and Daase, C.
The Correlation of ESG Ratings and Abnormal Returns: An Event Study Using Machine Learning.
DOI: 10.5220/0011841700003494
In Proceedings of the 5th International Conference on Finance, Economics, Management and IT Business (FEMIB 2023), pages 76-81
ISBN: 978-989-758-646-0; ISSN: 2184-5891
Copyright
c
2023 by SCITEPRESS – Science and Technology Publications, Lda. Under CC license (CC BY-NC-ND 4.0)

economic or societal turmoil (Whelan et al., 2020).
However, it is criticized that investors are led by the
assumption to use sustainability ratings for
investment decisions without knowing exactly their
measurement validity (Chatterji et al., 2016;
Dorfleitner et al., 2014).
This article explores the assumption whether
providing knowledge about the current rating of a
major ESG provider could improve the quality of
abnormal return predictions, meaning the difference
between actual and expected returns based on a long-
term average. The idea behind this assumption is that
responsible companies (assuming that ESG ratings
validly measure sustainability levels) may
outperform or underperform investors' expectations,
or that (institutional) investors may invest in
companies with a positive rating, thereby increasing
the stock price, while selling lower-rated stocks. In
this study, a machine learning (ML) approach with
two stages is applied. First, an ML model is trained
with a set of key performance indicators (KPIs) of
different companies that have received ESG ratings in
the past. However, this ML model is unaware of these
ratings. In addition, a second model is trained with the
exact same KPIs, but with the complementary
knowledge of ESG ratings. Thus, both models can be
viewed as imitating stock market experts, and it is
investigated whether the model with the additional
knowledge of ESG ratings outperforms the first
model. This research aims on answering the
following research question (RQ):
RQ: What impact does the addition of knowledge
about ESG ratings have on the accuracy of abnormal
return predictions with a trained ML model?
As mentioned earlier, research on ESG and financial
performance is often inconsistent in how
sustainability factors are measured and defined. For
this reason, we will also examine our ESG data using
descriptive analysis in a previous step.
2 METHODOLOGY AND DATA
The study focuses on the use of machine learning to
better explain abnormal returns through sustainability
ratings. The analysis and prediction of certain
financial values such as prices of resources and
valuable goods (Mahato and Attar, 2014; Tapia
Cortez et al., 2018; Zounemat-Kermani et al., 2020),
risk determinations (Wang et al., 2022), and stock
share prices and unforeseen disruptions (Sun et al.,
2019; Zhong and Enke, 2019) already has a history in
economics.
For the purpose of evaluating ESG impacts, we
use the price data of the companies from the EURO
STOXX 50
®
, the EURO STOXX 50
®
ESG and the
EURO STOXX
®
ESG LEADERS 50 for the study
period from 01.01.2018 to 22.11.2022. The EURO
STOXX 50® is a stock index consisting of 50 large,
listed eurozone companies and is regarded as one of
the leading stock market barometers in Europe. The
EURO STOXX 50 ESG® Index reflects the EURO
STOXX 50® Index with a standardized set of ESG
exclusion criteria and minimum sustainability rating
criteria by the ESG rating provider Sustainalytics.
The STOXX Europe ESG Leaders 50 Index offers
exposure to global leaders in environmental, social
and governance criteria, based on ESG indicators
supplied by Sustainalytics (STOXX® Index
Methodology Guide).
Estimated returns are calculated using simple
mean adjustment. The mean adjustment assumes that
the average returns and systematic risks associated
with the securities remain constant. Historical or
expected returns from the Τ-estimation period (with
Τ-element from {T0; ...; T1}) are used to estimate
returns (Brown and Warner, 1980). Current market
events are not taken into account. Since the ML
models used in this study are intended to imitate
experts for abnormal return predictions, the time
frame for available data must be previous to the date
to be predicted. The abnormal return of a security is
calculated for week τ in the event period, where τ is
defined as the last weekly event in the observation
period S={T
0
; T
1
; ... ; τ}.
𝐴𝑅
,
= 𝑅
,
−
1
𝑛(𝑆)−1
𝑅
,
AR
n,τ
= abnormal return of the stock n in one-week τ
in the event period
R
n,τ
= Return of the share on one-week τ in the event
period
T
0
= first week of the estimation period
n(S) = Number of weeks in the estimation period
The share price data used to calculate the returns was
downloaded from the following online databases:
Ariva, finanzen.net and finance.yahoo. The share
price data are the weekly closing prices in euros. In
the case that price data were only available from a
later date, the period from the first trading day was
considered.
The data basis for the ESG ratings comes from the
MSCI database. In particular, the MSCI ESG rating
is cited as an inclusion requirement for MSCI indices;
The Correlation of ESG Ratings and Abnormal Returns: An Event Study Using Machine Learning
77
for example, the requirement for inclusion in the
MSCI World ESG Leaders is an MSCI ESG rating of
"BB" or higher. In addition, MSCI is considered by
many to be one of the leading providers of data to the
investment community. MSCI also offers ESG scores
to institutional investors and utilizes ESG information
to generate additional stock market indices.
(Christensen et al., 2022).
The scoring system is divided from 0 to 10 into
seven equal parts, each corresponding to a letter grade
from AAA to CCC. These scores should not be
viewed as absolute, but rather in comparison to other
companies in the same industry. The ESG rating for
the company is determined based on the enterprise
value after taking industry-specific adjustments into
account. For the description of the exact methodology
for the determination of the rating see the ESG
methodology documents (ESG Ratings Methodology
- MSCI, 2022). Since MSCI does not publish the
Company Score, we assign a score of 1 (AAA) bus 7
(CCC) to each letter for further calculation.
Table 1: MSCI-ESG-Rating-Scale and Weighting (MSCI
ESG Research LLC).
LETTER LEADER/
LAGGARD
ADJUSTED
COMPANY SCORE
AAA Leader 8.571 - 10.0
AA Leader 7.143 – 8.571
A Average 5.714 – 7.143
BBB Average 4.286 – 5.714
BB Average 2.857 – 4.286
B Laggard 1.429 – 2.857
CCC Laggard 0.0 – 1.429
For the comparative analysis, we use the latest ratings
from Sustainalitics and Renfintiv. The data
availability for the ESG data is consistently above 90
percent over the entire study period through 2021, as
shown in Table 2. For 2022, data availability is likely
to be as solid as in previous years, although ESG data
for that year had not yet been fully published at the
time of the assessment and therefore may lead to bias
in the results. This limitation applies to all subsequent
analyses.
Table 2: Data availability of the MSCI ESG data for the
observation period [in %].
2018 2019 2020 2021 2022
MSCI
94.4 97.2 97.2 97.2 63.9
SST
98.6*
REF.
97.2*
* According to the last available rating
From the technical side, the influence of ESG
ratings on abnormal return prediction accuracy is
estimated using machine learning algorithms. Since
predicting daily price values is a complex, probably
unsolvable problem, relying on a comparison of mean
absolute errors between the two ML models is an
abstract yet more feasible approach. The ML model
for this purpose is therefore simplistically based on a
linear regression, using as independent variables the
data of previous weeks. If the ML model with the
additional integration of ESG ratings as features
performs significantly better than the model without
this knowledge, this can be understood as an indicator
that ESG ratings have an impact on how returns
develop and how certain effects influence the
behavior of a stock. To train the models, the data on
weekly returns and associated values from the
companies listed in the indices EURO STOXX 50
®
,
EURO STOXX 50
®
ESG and EURO STOXX
®
ESG
LEADERS 50 from 2018 until 2022 were used. After
a preprocessing stage, 17736 rows of data served as a
training and evaluation data set. The ML models were
trained by using BigQuery ML in Google Cloud, as it
is a powerful platform for data storage and analysis,
especially useful for analyst teams collaboratively
working in a cloud environment.
3 DESCRIPTIVE ANALYSIS
First, a descriptive analysis of the sustainability rating
data is conducted to critically evaluate the validity of
the rating.
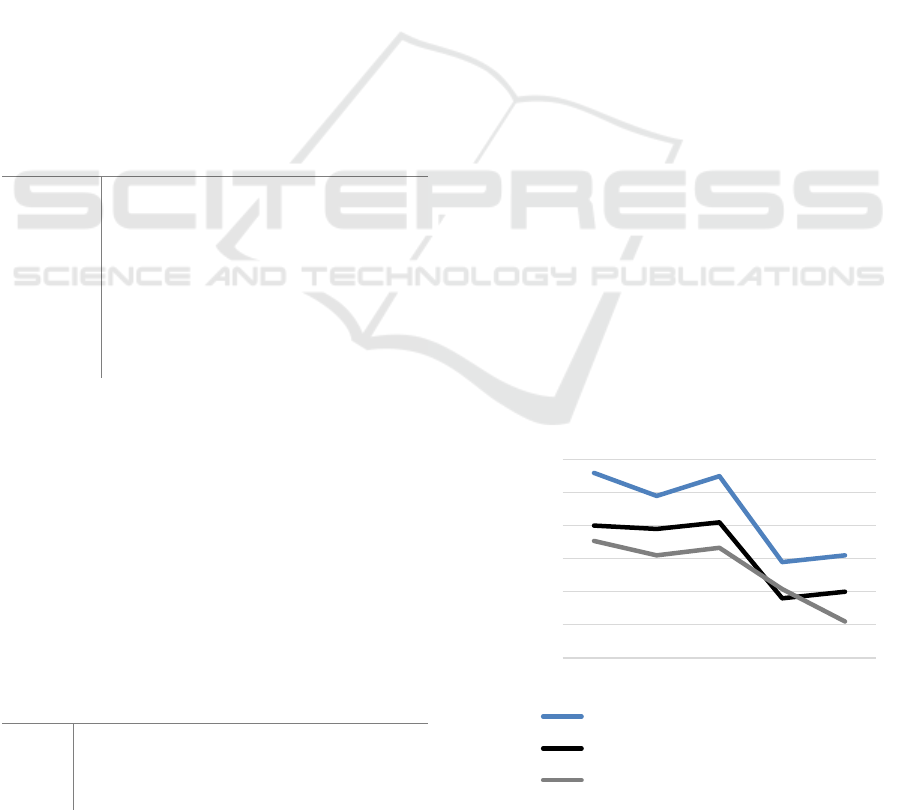
Figure 1 shows the average ESG scores of the
companies analyzed over time. Overall, a significant
improvement in the ESG scores from 2011 to 2022
can be seen for all the indices studied. In addition, the
Figure 1: Ø MSCI-ESG-rating development over time.
2
2,1
2,2
2,3
2,4
2,5
2,6
2018 2019 2020 2021 2022
Ø ESG-Rating
EURO STOXX 50®
EURO STOXX 50® ESG
EURO STOXX® ESG Leaders 50
FEMIB 2023 - 5th International Conference on Finance, Economics, Management and IT Business
78

overall rating of the ESG indices is consistently better
compared to the base index, with the EURO STOXX
®
ESG LEADERS 50 achieving even slightly better
rating results.
Table 3: Pearson rank correlation coefficients of the ESG
ratings and market cap.
MSCI Sustainalytics Marketcap
MSCI
Corr. 1
Sig.
N 70
Sustainalytics
Corr. .305
*
1
Sig. .011
N 69 71
Marketcap
Corr. .046 -.153 1
Sig. .710 .204
N 69 71 71
*. Correlation is significant at the 0.05 level (2-tailed).
This observation is consistent with empirical results
from other samples (Christ et al., 2021). The question
of the extent to which a good ESG rating is associated
with a higher level of sustainability cannot be
answered conclusively. A study by Drempetic et. al.
shows that the amount of data availability alone has a
positive significance with the ESG rating, so there is
a possibility that even the lack of availability of
sustainability data leads to a more negative rating
(Drempetic et al., 2020). For example, the company
'Isra Vision' was given a worst rating of ‘D-‘ by
Institutional Shareholder Services (ISS) because it
refused to participate in the preparation of an
unsolicited assessment. Only after legal action did
Isra Vision force a ban on publication (Blume, 2020).
As noted earlier, there is uncertainty as to whether
ESG performance is adequately represented by the
ratings used. However, even beyond the lack of data
availability, there are limits to the operationalizability
of the ratings. It is conceivable that larger companies
with more resources could share ESG data with ESG
rating agencies. Some studies find this effect
(Drempetic et al., 2020; Gregory, 2022). Table 3
shows the correlation between market capitalization
and ESG ratings from Sustainalytics and MSCI,
among others, of the dataset studied, with no
significant correlation. There also appears to be
inconsistencies in the assessment of relevant
disclosures. For example, the approaches of the
individual ESG rating agencies differ in terms of the
selection of evaluation criteria and their weighting.
Table 3 also shows the rank correlation coefficients
of the ESG rating providers for the entire sample
studied. There is a slightly significant correlation
between the MSCI rating and that of Sustainalytics.
4 PRELIMINARY RESULTS
The first step to propose an answer to the RQ is to
contrast the two trained ML models from which one
solely comprises accessible data on past KPIs and the
other one additionally integrates current and past ESG
ratings from MSCI. As the so-called label, the target
variable to be predicted, the previously explained
abnormal return was used with a time frame for
averaging past returns of 20 weeks. The first objective
to acquire meaningful results was to apply feature
engineering to assemble a suitable set of input
parameters for the construction of an ML model that
already provides the capability to predict the
abnormal return approximately correctly to a certain
degree.
The features that were best suited for an initial
training phase are the respectively three last returns
and the averages of returns of the last 20, 10, and 5
weeks. Table 4 summarizes the evaluation parameters
of the first ML model that has been trained without
ESG knowledge. The mean absolute error of 3.273 in
consideration of the meaning of the input data
describes a usual deviation of about 3.3 percent of
predicted abnormal returns to actually realized
abnormal returns. The median absolute error of 2.36
percent indicates that the deviations are not equally
distributed but tend to be less accurate in absolute
numbers, while some predictions are in turn closer to
the actual outcome. The R
2
coefficient with almost 90
percent suggests that the model has quite a good
ability to approximate to the correct values.
Table 4: Evaluation of ML model without ESG ratings.
Evaluation parameter Value
Mean absolute erro
r
3.273
Mean square
d
erro
r
22.5101
Mean s
q
uare
d
lo
g
erro
r
1.4438
Median absolute erro
r
2.3631
Rs
q
uare
d
0.8947
To estimate the impact that additional knowledge of
ESG ratings might have, ESG ratings from 2018 to
The Correlation of ESG Ratings and Abnormal Returns: An Event Study Using Machine Learning
79

2022 are added as features to the first model. Each
row of data is preprocessed to remove values from the
ESG cells if the date of the row is earlier than the year
in which the ESG rating was published. In this way,
the model mimics an expert who also has only the
currently available knowledge about a stock price and
related information. However, one limitation of this
model is that the ratings are usually not published at
the very beginning of a year, but rather during the
course of the year. Table 5 presents the evaluation
parameters of the model. In contrast to the mean
absolute error shown in Table 4, the value of 3.9577
is about 21 percent higher. Furthermore, considering
the higher median absolute error and the lower R2, it
can be observed that the integration of ESG ratings
significantly lowers the accuracy of the model. With
respect to the RQ, this result leads to the assumption
that ESG ratings not only do not improve the quality
of the model, but rather confuse the algorithm behind
it. One reason for this could be that the model learns
a false correlation based on some examples in the data
where successful companies have low ESG ratings
and less successful companies receive better ratings
in comparison. As it is then faced with predicting
abnormal returns of highly rated companies, it falls
back on knowledge based on uncorrelated data. Two
examples in the data used are the German company
Adidas, with AAA ratings over the entire period
observed, and the German company Volkswagen,
with CCC to B ratings. Although Adidas is better
rated at each point in time, its return over the last five
years is about -32 percent, while Volkswagen has a
slightly less negative performance of about -20
percent over the same period. The lower accuracy of
the model suggests that this contrasting relationship
between ratings and performance is not an exception,
but to a large extent the rule. In response to the RQ,
the inclusion of ESG ratings during the training of an
ML model with the specified features and labels has
a negative impact on accuracy, as it appears to disrupt
the training by suggesting a misinterpreted
correlation between ESG ratings and a company's
performance.
Table 5: Evaluation of ML model with ESG ratings.
Evaluation
p
arameter Value
Mean absolute erro
r
3.9577
Mean s
q
uare
d
erro
r
35.7671
Mean square
d
log erro
r
2.2909
Median absolute erro
r
2.7699
R square
d
0.8697
5 LIMITATIONS AND
CONCLUSION
A large number of studies have attempted to provide
evidence that sustainability ratings affect the return
performance of a stock, with many studies finding a
positive correlation (Friede et al., 2015; Whelan et al.,
2020). In this context, we investigate whether
machine learning can be used to better estimate a
company's returns by adding a sustainability rating
from MSCI. Our results show that adding the rating
degrades the model for prediction. This may be due
to the fact that no standardized metrics are currently
used to measure sustainability, leading to a diffusivity
between rating-providers that distorts our results.
Second, it is possible that there is no correlation
between ESG and financial performance currently. In
addition, it is possible that the population of our study
with predominantly positively rated companies leads
the model to incorrect assumptions. Also, the use of
mean value adjustment is a very simple procedure;
here, for example, the capital asset pricing model
(CAPM) or the Fama-French three-factor model
could lead to better predictions.
Further research should improve the study and the
model by using a larger population and other methods
to calculate expected returns and by adding more
financial parameters to the model. A shift to more
complex solution approaches such as deep neural
networks to address the complexity of the problem
domain of stock market predictions could also be a
reasonable extension.
REFERENCES
Berg, F., Kö, lbel, J., & Rigobon, R. (2019).
Aggregate Confusion: The Divergence of ESG Ratings.
SSRN Electronic Journal. Advance online publication.
Blume, J. (2020, March 10). Green Finance. Handelsblatt.
https://www.handelsblatt.com/finanzen/steuern-recht/
recht/green-finance-oekoratings-vor-gericht-isra-visio n-
erwirkt-verbot-gegen-agentur-iss-esg/25629486.html
Brown, S. J., & Warner, J. B. (1980). Measuring security
price performance. Journal of Financial Economics,
8(3), 205–258.
Chatterji, A. K., Durand, R., Levine, D. I., & Touboul, S.
(2016). Do ratings of firms converge? Implications for
managers, investors and strategy researchers. Strategic
Management Journal, 37(8), 1597–1614.
Christ, J., Koclan, J., & Lehmann, K. (2021). Der neue
DAX 50 ESG unter der Lupe: Mehr grün, weniger
Risiko? Corporate Finance, 1–8.
Christensen, D. M., Serafeim, G., & Sikochi, A. (2022).
Why is Corporate Virtue in the Eye of The Beholder?
FEMIB 2023 - 5th International Conference on Finance, Economics, Management and IT Business
80

The Case of ESG Ratings. The Accounting Review,
97(1), 147–175.
Dimson, E., Marsh, P., & Staunton, M. (2020). Divergent
ESG Ratings. The Journal of Portfolio Management,
47(1), 75–87.
Dorfleitner, G., Halbritter, G., & Nguyen, M. (2014).
Measuring the Level and Risk of Corporate
Responsibility - An Empirical Comparison of Different
ESG Rating Approaches. SSRN Electronic Journal.
Advance online publication.
Drempetic, S., Klein, C., & Zwergel, B. (2020). The
Influence of Firm Size on the ESG Score: Corporate
Sustainability Ratings Under Review. Journal of
Business Ethics, 167(2), 333–360.
ESG Ratings Methodology - MSCI. (2022, November 29).
https://www.msci.com/esg-and-climate-methodologies
Friede, G., Busch, T., & Bassen, A. (2015). ESG and
financial performance: aggregated evidence from more
than 2000 empirical studies. Journal of Sustainable
Finance & Investment, 5(4), 210–233.
Gregory, R. P. (2022). The influence of firm size on ESG
score controlling for ratings agency and industrial
sector. Journal of Sustainable Finance & Investment,
1–14.
Kögler, A. (2021, May 4). Worauf Sustainalytics beim
ESG-Rating achtet. FINANCE. https://www.finance-
magazin.de/finanzabteilung/investor-relations/worauf-
sustainalytics-beim-esg-rating-achtet-43642/
Mahato, P. K., & Attar, V. (2014). Prediction of gold and
silver stock price using ensemble models. In 2014
International Conference on Advances in Engineering
& Technology Research (ICAETR - 2014) (pp. 1–4).
IEEE.
Morningstar (2022). Global Sustainable Fund Flows: Q3
2022 in Review: Flows fell further but held up better
than the broader market, 1–35. https://assets.content
stack.io/v3/assets/blt4eb669caa7dc65b2/blt77ddb1651
bd21f15/635c12de55e3125597604f2e/Global_ESG_Q
3_2022_Flow_Report_12pm_27_Oct_2022_FRES_E
DIT.pdf
MSCI ESG Research LLC. ESG Ratings Methodology.
https://www.msci.com/documents/1296102/34424357/
MSCI+ESG+Ratings+Methodology.pdf/390b55a3-
031f-e32f-a22e-7f5c8cab9250?t=1666182604205
Serafeim, G., & Yoon, A. (2022). Which Corporate ESG
News Does the Market React To? Financial Analysts
Journal, 78(1), 59–78.
STOXX® Index Methodology Guide. https://www.stoxx.
com/document/Indices/Common/Indexguide/stoxx_in
dex_guide.pdf
Sun, J., Xiao, K., Liu, C., Zhou, W., & Xiong, H. (2019).
Exploiting intra-day patterns for market shock
prediction: A machine learning approach. Expert
Systems with Applications, 127, 272–281.
Tapia Cortez, C. A., Saydam, S., Coulton, J., & Sammut, C.
(2018). Alternative techniques for forecasting mineral
commodity prices. International Journal of Mining
Science and Technology, 28(2), 309–322.
Wang, L., Jia, F., Chen, L., & Xu, Q. (2022). Forecasting
SMEs’ credit risk in supply chain finance with a
sampling strategy based on machine learning
techniques. Annals of Operations Research. Advance
online publication.
Whelan, T., Atz, U., & Clark, C. (2020). ESG and Financial
Perfomance: Uncovering the Relationship by
Aggregating Evidence from 1,000 Plus Studies
Published between 2015 – 2020, 1–19. https://sri360.
com/wp-content/uploads/2022/10/NYU-RAM_ESG-
Paper_2021-2.pdf
Zhong, X., & Enke, D. (2019). Predicting the daily return
direction of the stock market using hybrid machine
learning algorithms. Financial Innovation, 5(1).
Zounemat-Kermani, M., Ramezani-Charmahineh, A.,
Razavi, R., Alizamir, M., & Ouarda, T. B. (2020).
Machine Learning and Water Economy: a New
Approach to Predicting Dams Water Sales Revenue.
Water Resources Management, 34(6), 1893–1911.
The Correlation of ESG Ratings and Abnormal Returns: An Event Study Using Machine Learning
81
