
Towards a Transition Matrix-Based Concept Drift Approach:
Experiments on the Detection Task
Antonio Carlos Meira Neto, Rafael Gaspar de Sousa, Marcelo Fantinato and Sarajane Marques Peres
School of Arts, Science and Humanities, University of S
˜
ao Paulo, S
˜
ao Paulo, Brazil
Keywords:
Concept Drift, Process Mining, Transition Matrix, Event Log, Process Drift, Data Mining.
Abstract:
Contemporary process mining techniques commonly assume business processes are in a steady state. How-
ever, business processes are prone to change and evolution in response to various factors, which can happen
at any time, in a planned or unplanned way. This phenomenon of business process evolution and change is
known as concept drift, and identifying and understanding is of paramount relevance for business process
management, so that organizations can respond and adapt to the new challenges they face. The goal of this
paper is to introduce the use of transformed transition matrices as a data structure to support the treatment
of concept drifts in process mining, given its efficiency, simplicity, and expandability. The proposed data
structure allows to handle different concept drift aspects in an integrated way. Three concept drift detection
methods are first adapted to work on transformed transition matrices. The results obtained in the experiments
are compared with a state-of-the-art method (baseline), and the three methods used achieved good results,
showing an encouraging potential for future planned work.
1 INTRODUCTION
Business processes are prone to continuous, unex-
pected changes in response to many factors, including
changes in the competitive environment, regulations,
supply, demand, and technology resources, as well as
seasonal factors (Maaradji et al., 2015). This is an in-
herent characteristic of the business, which can hap-
pen at any time and whether planned or not. Changes
impact the dynamics of operations and affect business
process performance (Ostovar et al., 2016). Conse-
quently, the changes impact the process mining anal-
yses, especially the quality of the process model dis-
covered based on the event log (Sato et al., 2021).
This phenomenon of change in business process
behavior over time is called concept drift (or process
drift). Concept drift refers to when the business pro-
cess changes during analysis (van der Aalst and et al.,
2012) or, more specifically, when there is a statis-
tically significant difference in the business process
behavior (Maaradji et al., 2015). Nonetheless, con-
temporary process mining techniques assume busi-
ness processes are in steady state (Sato et al., 2021).
E.g., when discovering a process model from an event
log, the business process at the beginning of the event
logged period is assumed to be the same as the one
at the end of the event logged period. Identifying and
understanding concept drift is of paramount impor-
tance in business process management, so that organi-
zations can respond and adapt to the associated chal-
lenges (Bose et al., 2014).
Process mining has supported organizations to
handle business processes in descriptive, predictive,
and prescriptive ways. As summarized by de Sousa
et al. (2021), following van der Aalst (2014, 2016)’s
definitions, process mining relies primarily on the
concepts of event, case, trace, log, and attribute. An
event is the occurrence of a business process activity
at a given time, performed by a given resource, at a
given cost. A case corresponds to a process instance
and comprises events such that each event relates ex-
actly to a case. A trace is a mandatory attribute of
a case and corresponds to a finite sequence of events
such that each event appears only once. An event log
is a set of cases such that each event appears only
once in the entire event log. Each event in the event
log comprises a set of non-mandatory attributes such
as identifier, timestamp, activity, resource, and cost.
Cases can also have non-mandatory attributes, often
related to domain-specific data.
To deal with concept drift in process mining, the
following aspects (or dimensions) should be consid-
ered (Sato et al., 2021): tasks (detection, localization,
characterization, and explanation), types of change
Neto, A., Gaspar de Sousa, R., Fantinato, M. and Peres, S.
Towards a Transition Matrix-Based Concept Drift Approach: Experiments on the Detection Task.
DOI: 10.5220/0011843600003467
In Proceedings of the 25th International Conference on Enterprise Information Systems (ICEIS 2023) - Volume 2, pages 361-372
ISBN: 978-989-758-648-4; ISSN: 2184-4992
Copyright
c
2023 by SCITEPRESS – Science and Technology Publications, Lda. Under CC license (CC BY-NC-ND 4.0)
361

(sudden, gradual, recurring, and incremental), pro-
cess perspectives (control-flow, time, resource, and
data), and data scenario (online and offline). For a
complete, end-to-end analysis of the concept drift, a
holistic view is required that fully considers all as-
pects (Manoj Kumar et al., 2015).
Success in dealing with a wide range of differ-
ent aspects of concept drift in process mining may
rely on the features (Maaradji et al., 2015) and hence
the data structure used. Data structure is the format
used to store, represent, organize, and manage data
extracted from event logs, such as vector, list, matrix,
tree, graph, etc. Features refer to values represented
in these data structures, such as event frequency, av-
erage time, total of a resource, etc. Data structure and
features are the means to represent the business pro-
cess behavior (called here process representation) and
hence are crucial to identify and understand concept
drifts. However, most studies have addressed in a very
limited way the different aspects of concept drifts.
The main goal of this paper is to introduce a com-
prehensive concept drift approach for process mining
based on a transformed transition matrix as a single,
simple, effective, and expandable data structure. The
transformed transition matrix allows the proposed ap-
proach to be potentially used to fully deal with all
concept drift aspects in process mining. In this pa-
per, we first show the good results of the proposed ap-
proach for the task of detecting sudden changes from
the control-flow perspective for an offline scenario.
The remainder of this paper is organized as fol-
lows. Section 2 discusses related work on concept
drift in process mining. Section 3 details the proposed
approach. Section 4 reports the undertaken experi-
ments. Finally, section 5 concludes the paper.
2 RELATED WORK
Table 1 summarizes the representations used in re-
lated work, as well as the concept drift aspects cov-
erage. Some works are put together as they are pub-
lished as an evolution or addition of a single approach.
Several types of representations (data structures
and features) have been proposed, each with benefits
and drawbacks depending on its purpose. The repre-
sentation choice should consider which aspects’ items
are addressed. E.g., if the approach aims to handle
only the detection task, the chosen data representa-
tion may not be suitable for handling other tasks. On
the other hand, different data representations specific
for each aspect item (e.g., one for detection and an-
other for localization) may result in a complex, non-
integrated solution, making a holistic analysis diffi-
cult or even impossible (de Sousa et al., 2021).
Moreover, if the features that can capture a pro-
cess change cannot be expressed in the chosen data
structure, then such a change cannot be identified, re-
gardless of the detection method used. In addition,
each representation may be different in terms of, e.g.,
processing cost to transform raw data into the chosen
representation, supportability for each item of the dif-
ferent aspects of concept drift (i.e., tasks, types, pro-
cess perspectives, and data scenario), and supporta-
bility for user interpretation of data. Thus, the choice
of representation used by the concept drift approach
is of paramount relevance.
Per Table 1, of the few works addressing several
aspects’ items, Yeshchenko et al. (2021) stands out for
its larger coverage as it addresses three tasks and all
types of change. However, only the control-flow per-
spective in the offline scenario is handled. In addition,
their experiments are not clearly reported (Sato et al.,
2021). They compare their method effectiveness with
Ostovar et al. (2016)’s, but without using the same
full set of public synthetic event logs made available
and without defining the F-score calculation. Cer-
avolo et al. (2022) compare several concept drift de-
tection methods and cite Yeshchenko et al. (2021)’s
study with the worst effectiveness and efficiency re-
sults when increasing the size of event logs due to the
many pre-processing steps before the detection task.
Adams et al. (2021) also present great coverage,
addressing two tasks and all perspectives. However,
only the sudden type in the offline scenario is handled.
Moreover, the data representation comprises disjoint
features (i.e., not necessarily extracted using a sin-
gle data structure) and transformed into time series.
An approach expansion to handle the other two tasks,
which need more data detail, might be unfeasible.
The studies presented by Maaradji et al. (2015,
2017) and Ostovar et al. (2016, 2017, 2020) are
considered state-of-the-art due to their effectiveness,
although featuring low coverage of aspects’ items.
Maaradji et al. (2015, 2017) address one task, one per-
spective, and two types, only in the offline scenario,
while Ostovar et al. (2016, 2017, 2020) address three
tasks, one perspective, and one type, in the online sce-
nario. Data representations of both studies are spe-
cific to the control-flow perspective (i.e., Alpha con-
currency and frequency of Alpha plus relations).
As for our approach, it is designed to be used for
all aspects’ items, as it is based on a data structure
that centralizes the data used, allowing full integra-
tion. However, in this first paper, only one item per
aspect is being tested. Moreover, the approach does
not use any costly pre-processing and the data struc-
ture is simple and efficient.
ICEIS 2023 - 25th International Conference on Enterprise Information Systems
362

Table 1: Comparison of related work.
Work Representation Task Perspective Type Scenario
Bose et al. (2011, 2014); Martju-
shev et al. (2015)
Relation type count, relation entropy, local window
count, J-measure
D, L C S, G Off
Weber et al. (2011) Probabilistic deterministic finite automata, Alpha
relations
D C S On*
Luengo and Sep
´
ulveda (2012) Maximal repeat (a special substring in a sequence),
trace starting time
D C G Off
Accorsi and Stocker (2012) Distance between pair of activities D, L C S Off
Carmona and Gavald
`
a (2012) Trace as Parikh vectors D C S On*
Manoj Kumar et al. (2015) Event class correlation D C S Off
Hompes et al. (2015, 2017) Stochastic similarity matrix between cases D C, D S Off
Maaradji et al. (2015, 2017) Alpha concurrency (runs) D C S, G Off
Ostovar et al. (2016, 2017, 2020) Frequency of Alpha plus relations, Process tree model D, L, C C S On
Seeliger et al. (2017) Graph metrics from Heuristic miner D, L C S Off
Zheng et al. (2017) Directly-follows and weak order relations D C S Off
Richter and Seidl (2017) Time interval between activities D, L T S, I, R On
Barbon Junior et al. (2018);
Tavares et al. (2019)
Frequency of activities, Graph-distance (trace and
time)
D C, D S, G On
Liu et al. (2018) Alpha relations matrix, Process model D, L, C C S, G, I, R On*
Stertz and Rinderle-Ma (2018) Process model D, C C S, G, I, R On
Pauwels and Calders (2019) Extended dynamic Bayesian network D C, D, R N/D Off
Hassani (2019) Directly-follows relations D C S On
Kurniati et al. (2019, 2020) Metrics of process model, trace and activity levels D C N/D Off
Yeshchenko et al. (2019a,b,
2020, 2021)
DECLARE constraints confidence D, L, C C S, G, I, R Off
Brockhoff et al. (2020) Trace and time as stochastic languages D C, D S Off
Impedovo et al. (2020) Dynamic networks D, L C S Off
Adams et al. (2021) Several measures extracted over time D, E C, T, D, R S Off
Lu et al. (2021b) Directly-follows relations D, L C S Off
Lu et al. (2021a) Exclusive choice splits from process model D, L C S Off
de Sousa et al. (2021) Activity and transitions trace vector profile D, L C S On*
Lin et al. (2022) Directly-follows relations D C S Off
Our approach Transition features in transformed transition matrix All (D) All (C) All (S) All (Off)
Legend: Task (Detection, Localization, Characterization, and Explanation); Perspective (Control-flow, Time, Data, and Resources);
Type (Sudden, Gradual, Incremental, and Recurring); Scenario (Offline and Online).
* Online methods that work with trace stream instead of event stream.
N/D: when the aspect item is not specified by the study.
3 PROPOSED APPROACH
The proposed approach is organized as a sequence of
integrated steps (illustrated in Figure 1). The first step
refers to receiving the event log, which can be batch,
for the offline scenario, or stream, for the online sce-
nario. The second refers to applying a windowing
strategy, where the event log is split into samples over
time (windows). The third refers to instantiating the
proposed data structure (i.e., a transition matrix) for
each window, containing all the necessary informa-
tion to represent the process (i.e., process features),
considering the different perspectives (control-flow,
time, resources, or data). The fourth refers to compar-
ing the windows over time, obtaining information that
can represent the change over time (change features).
The fifth refers to detecting the existence of change in
a given window. The detection method with the win-
dowing strategy impacts the types of change (sudden,
gradual, recurring, and incremental) which can be de-
tected. Finally, the sixth refers to executing the other
tasks (i.e., localization, characterization, and explana-
tion) that allow a better understanding of the detected
drift, which are not explored herein.
The approach is proposed as a conceptual frame-
work based on the transition matrix. The other com-
ponents are flexible, i.e., different methods are eligi-
ble for the windowing strategy and detection, local-
ization, characterization, and explanation tasks. Also,
different features can be chosen for extraction from
both the event log (process features) and the compar-
ison between windows (change features).
The approach’s components are described below,
emphasizing the data structure and detection method.
Towards a Transition Matrix-Based Concept Drift Approach: Experiments on the Detection Task
363

Figure 1: Overview of the proposed approach steps.
3.1 Windowing Strategy
Windowing strategies serve to sample data over time,
i.e., to create data windows for analysis. These win-
dows act as a picture of the data at different points in
time. Each windowing strategy perform this sampling
in a specific way. There are typically two windows,
the reference window and the detection window. At
each iteration, the data in these two windows are com-
pared with each other aiming to detect concept drifts.
Some characteristics and parameters that differ
among the windowing strategies are: window size for
fixed-size windows, minimum and maximum window
size for adaptive-size windows, fixed or sliding refer-
ence window, windows with or without overlapping
slides and with or without continuous slides, slide
size for windows with overlapping slides, and gap
size for windows with non-continuous slides. Osto-
var et al. (2016), e.g., used a non-overlapping, con-
tinuous, adaptive-size, and sliding reference window.
Each windowing strategy has strengths and weak-
nesses, depending on the specific purpose of use (Lu
et al., 2019; Gemaque et al., 2020; Sato et al., 2021).
Some strategies combine two or more basic window-
ing strategies in order to complement the results.
The choice of the windowing strategy, as well as
the choice of values for its parameters, is crucial when
using the proposed approach, as this choice reflects on
the effectiveness and delay in detecting concept drifts.
Furthermore, certain windowing strategies may allow
all or only some of the types (sudden, gradual, recur-
ring, and incremental) to be detected.
3.2 Process Representation
The execution of the different concept drift tasks (i.e.,
detection, localization, characterization, and explana-
tion) is based on features describing the process be-
havior over time. Thus, features showing what is hap-
pening in the process over time need to be extracted
from event logs as part of the proposed approach. Ex-
amples of such features are activity frequency, tran-
sition average time, total of a resource, etc. Each
feature represents a process perspective (control-flow,
time, resources, and data). However, a given feature
does not necessarily allows to fully represent a pro-
cess perspective. E.g., the feature number of process
activities allows to represent changes that add or re-
move activities to/from the process, but it does not
allow to represent any change in activity transitions.
As a result, to provide a full representation of a given
process perspective, a set of features that complement
each other may be required. Moreover, the choice of
feature (or set of features) to be extracted is crucial
when using the proposed approach in order to iden-
tify the desired perspectives. These features extracted
in this step are named process features.
Process feature values must be represented in a
data structure. We introduce here transition matri-
ces for this purpose. First, the values of each chosen
process feature are extracted as a transition matrix.
Then all transition matrices are combined into a single
transformed transition matrix containing all process
features. A transition matrix is a granular structure,
as it stores data in a high level of detail, i.e., transi-
tions between activities according to the event log
1
.
A transition matrix is a square matrix, containing
n rows and n columns, where n is the number of pro-
cess activities. Each value in a transition matrix repre-
sents some process feature value that refers to a transi-
tion between two activities according to the event log,
1
This matrix would more correctly be called directly-
follows relation matrix rather than transition matrix, as one
activity directly followed by another in an event trace does
not necessarily represent a transition in a process (van der
Aalst, 2016). However, for simplicity, as done by de Sousa
et al. (2021), we kept the nomenclature used by previous
authors (Song et al., 2009; Appice and Malerba, 2016).
ICEIS 2023 - 25th International Conference on Enterprise Information Systems
364

i.e., a transition from an activity represented by a row
in the matrix to an activity represented by a column
in the matrix. E.g., a transition matrix can contain
the values for the process feature transition frequency
that occurred between activity n
1
and activity n
2
. This
process feature value can refer to data extracted di-
rectly from the event log (e.g., frequencies) or derived
data calculated from data in the event log (e.g., infor-
mation derived from Alpha relations). Figure 2 illus-
trates how transition matrices are created. From an
event log, four transition matrices are created, repre-
senting four process features from a process perspec-
tive, namely: the transition probability (probability
column) and the transition frequency (frequency col-
umn) from control-flow perspective; the average tran-
sition time (average time column) and the transition
time variance (time variance column) from time per-
spective; among all activities in the event log.
As stated earlier, the proposal consists of extract-
ing each process feature chosen to be used in the ap-
proach, as a transition matrix, and in the end com-
bining them into a single transformed transition ma-
trix, containing all process features. The transforma-
tion of the transition matrices is a way of represent-
ing the same information but arranged in a different
format. This new format has two columns with the
transition matrix indices (the transition activities) and
a single column containing the process feature infor-
mation (probability, frequency, etc.).
Figure 2 also illustrates how occurs the transfor-
mation of a set of transition matrices into a single
transformed transition matrix (a snippet of the trans-
formed transition matrix is shown). A transformed
transition matrix is a n
2
× (2 + m) matrix, where n
is the number of activities in the process and m is
the number of input transition matrices which in turn
refers to the number of extracted features. Each of
the columns refers to: (column 1) the row index of
the input transition matrix representing the transition
source activity, (column 2) the column index of the
input transition matrix representing the transition tar-
get activity, and (columns 3...2 + m) the feature val-
ues at those two indices that represent the transition in
the input transition matrices. In the example of Fig-
ure 2(c), the following features are extracted: transi-
tion probability, transition frequency, average transi-
tion time, and transition time variance.
This single data structure is designed to contain
data with such a high level of detail it allows to han-
dle all four tasks of concept drift (i.e., detection, lo-
calization, characterization, and explanation). Also,
the transition matrix is a simple data structure that al-
lows efficient storage and update operations, which
makes its use feasible in the online scenario, as it can
be updated with each new event at low cost.
Extracting features from the event log can be as
simple as counting the transitions from one activity to
another in the window, or more complex operations
such as getting the type of relationship between two
activities in a transition according to the Alpha algo-
rithm. The more features are extracted, the more pro-
cess perspectives related to concept drift can be ana-
lyzed. On the other hand, more operations should be
performed to process the data and the data structure,
which can impact the approach execution time.
The extracted features must always be represented
by numerical values. Categorical features (such as Al-
pha algorithm’s relationship types of each transition)
must be transformed into indicator variables (binary
or frequency). For features associated with individ-
ual activities rather than activity transitions, such as
the role of who performed the activity, the features
associated with each of the two activities part of the
transition must be concatenated, generating v
2
indica-
tor variables, where v is the number of distinct values
in the window. For the role feature example, an in-
dicator variable could be analyst-manager, making it
possible to count transitions from activities performed
by an analyst to activities performed by a manager.
3.3 Change Representation
We assume the transformed transition matrix can rep-
resent changes in the process over time. Thus, for two
windows representing two moments between which
there is a concept drift, when comparing the trans-
formed transition matrices for both windows, signifi-
cant differences can be observed in the values of one
or more process features represented in such matrices.
Figure 3 exemplifies the comparison of trans-
formed transition matrices from different periods be-
tween which there is a concept drift in the control-
flow. Two process models are shown at the top of the
figure: the one on the left represents a process that
occurs before t
i
(moment in time when a concept drift
occurs) and the one on the right represents the pro-
cess that occurs after t
i
. The respective transformed
transition matrices generated from the event log for
each of the two processes are shown at the bottom
of the figure, where different values can be observed
for the activity transitions where the concept drift oc-
curs (highlighted with a red rectangle). Regardless of
the windowing strategy used, each window is com-
pared with some other window over time, which are
called reference and detection windows, respectively.
For each comparison, features (change features) can
be extracted based on the process features differences
(or changes) between the transformed transition ma-
Towards a Transition Matrix-Based Concept Drift Approach: Experiments on the Detection Task
365
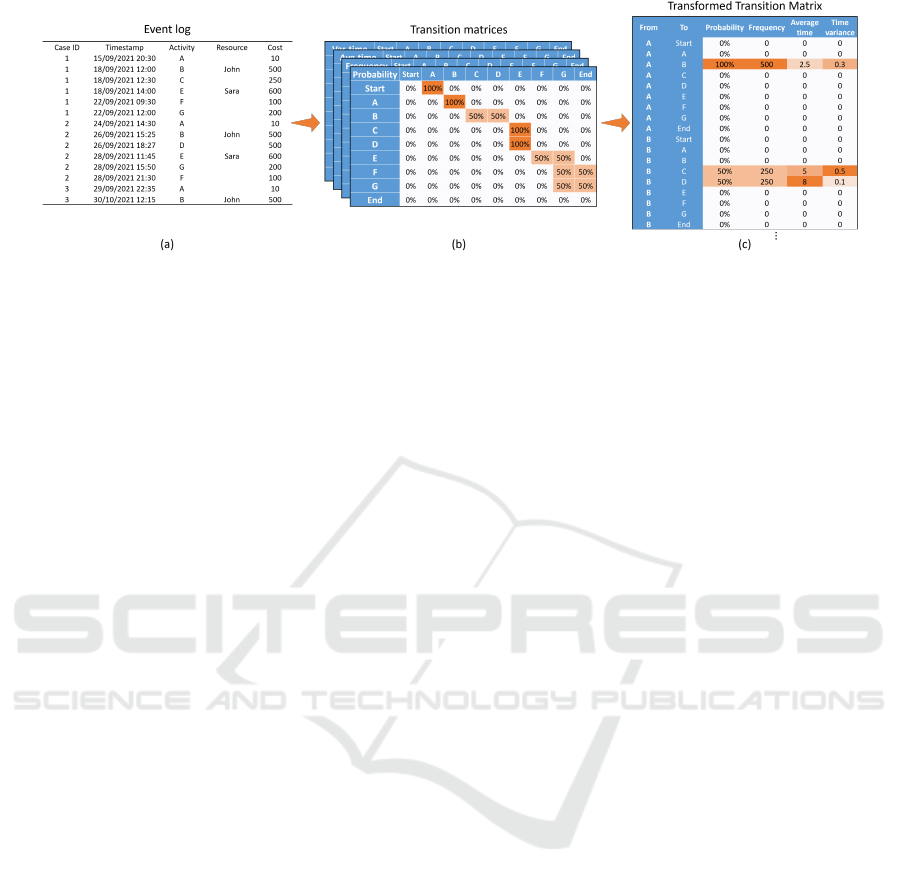
Figure 2: Illustrative example of creating a set of transition matrices from a event log and combining them into a single
transformed transition matrix snippet.
trix from the reference window and the transformed
transition matrix from the detection window, e.g., fre-
quency difference. The way of extracting, storing and
using the change features depends on the technique
used in the concept drift tasks step.
3.4 Concept Drift Detection Task
Our approach is designed to allow different concept
drift detection methods to be used in the detection
task. We describe below three strategies that are
adapted for this purpose, namely: time series strategy,
statistical test strategy, and threshold strategy.
3.4.1 Time Series Strategy
At the change representation step, change features can
be extracted in multivariate time series format, such as
the total transition frequency difference between win-
dows over time. Features like multivariate time series
can be used as input to time series techniques special-
ized in concept drift detection. Such techniques are
focused on a more complete analysis of temporal fea-
tures, which represent a relevant combination for the
concept drift detection task. We prioritized the time
series techniques known as change point detection,
mainly because such techniques have been used and
considered effective by state-of-the-art studies in pro-
cess mining (Yeshchenko et al., 2021; Adams et al.,
2021). Change point detection aims to estimate the
point at which the statistical properties of a sequence
of observations change (Truong et al., 2020).
To transform window comparisons into multivari-
ate time series, the absolute difference between the
windows must be calculated through a modulus sub-
traction (|x − y|) for each process feature and activity
transition. In the sequence, the total difference of each
change feature can be obtained and then concatenated
with the totals of the other comparisons.
3.4.2 Statistical Test Strategy
Change features can also be calculated as a result of
hypothesis testing on a given feature of both windows
being compared. Hypothesis testing results over time
can be used to identify when different windows show
statistically significant differences.
In Figure 3, the chi-square test can be applied to
test the independence of the two samples using the
frequency variable. In this hypothesis testing, the
null hypothesis is “there is no significant difference
between the distributions”, while the alternative hy-
pothesis is “there is a significant difference between
the distributions”. The result of the hypothesis test is
the p-value, or probability of significance. A p-value
greater than a chosen threshold, usually 0.01 or 0.05,
means the null hypothesis cannot be rejected. A p-
value less than or equal to the threshold means the null
hypothesis can be rejected, thus assuming the samples
are different, i.e., the event log data come from differ-
ent processes, configuring a concept drift.
Pre-processing may be required depending on the
type of hypothesis test used to ensure the conditions
and assumptions of the test. By the example above,
the two samples from each window need to be com-
bined in a pairwise way into a contingency matrix, in
the format 2×d, where d is the number of distinct ac-
tivity transitions with frequency greater than 0 in any
of the windows. Moreover, for some types of hypoth-
esis testing, the windowing strategy should result in
windows of the same or similar amount of transitions.
3.4.3 Threshold Strategy
The change features can be seen as simple metrics,
i.e., a quantifiable measure of behavior observed.
Thus, one can use a metric threshold to trigger a pos-
sible concept drift when the threshold is crossed.
There are many ways to set a threshold value, e.g.,
if the difference of a change feature is greater than a
fixed value x at any time, or if the value of a change
ICEIS 2023 - 25th International Conference on Enterprise Information Systems
366

Figure 3: Illustrative comparison of transformed transition matrices.
feature increases by at least y% at time i compared to
time i-1. These values often rely on prior knowledge
of the operating environment. At the change repre-
sentation step, interpretable features can be obtained,
such as the total differences of transition frequencies
over time, which can help a process manager to define
a threshold based on the business risk appetite.
4 EXPERIMENTS
In this first experiment, only the concept drift detec-
tion task is evaluated as our first goal to evaluate the
proposed approach. In addition, the following as-
pects’ items are considered: sudden changes from the
control-flow perspective for an offline scenario.
4.1 Planning and Setup
Each of the steps of the proposed approach, as de-
scribed in Section 3 (and summarized in Figure 1) are
addressed. Figure 4 summarizes the decisions made
including the choice of windowing strategy, process
and change features, and concept drift detection meth-
ods. The solution is coded in Python.
A set of public synthetic event logs called Busi-
ness Process Drift, created by Maaradji et al. (2015),
is used as input. This dataset has been used in several
other studies on this subject in the literature. As done
by Maaradji et al. (2015), event logs with 2,500 events
are not considered in the experiments, given the short
distance between the concept drifts and the window
size tested (about 250 traces or 2,500 transitions), not
allowing stability between the concept drifts.
As for the windowing strategy, the following def-
initions are chosen: the windows have a fixed size of
4,000 transitions each; the reference window is fixed
as the first window of the event log; the detection win-
dows follow a sliding strategy, with overlap and in a
continuous way; the size of the sliding is 200 transi-
tions, where for each window is added this number of
newer transitions and the same number of the older
transitions is deleted.
As the data structure (transformed transition ma-
trix) has a high granularity, being process transitions,
it is expected detection strategies need a large number
of samples to represent the process and its changes.
Therefore, as the goal is to test whether the strategies
can have good effectiveness, a window size of 4,000
transactions and a sliding of 200 transitions was cho-
sen for the experiment to use the largest possible win-
dow size but still be able to use the Business Process
Drift logs with 5,000 events with some stability be-
tween the concept drifts.
The third step is process representation. For this
experiment, transition frequency (named Freq) and
probability (named Prob) are extracted as process fea-
tures and stored in the transformed transition matrix.
The fourth step is the change representation,
where each detection window is compared with the
fixed reference window. In order to test the three de-
tection strategies mentioned in the previous section,
some actions are carried out. First, for the time se-
ries strategy, an operation to get the absolute differ-
ence is applied for each transition and feature in the
transformed transition matrix comparison, resulting
in a transformed transition matrix containing the dif-
ferences between the windows (named Delta matrix).
A feature derived from the product of the frequency
Towards a Transition Matrix-Based Concept Drift Approach: Experiments on the Detection Task
367
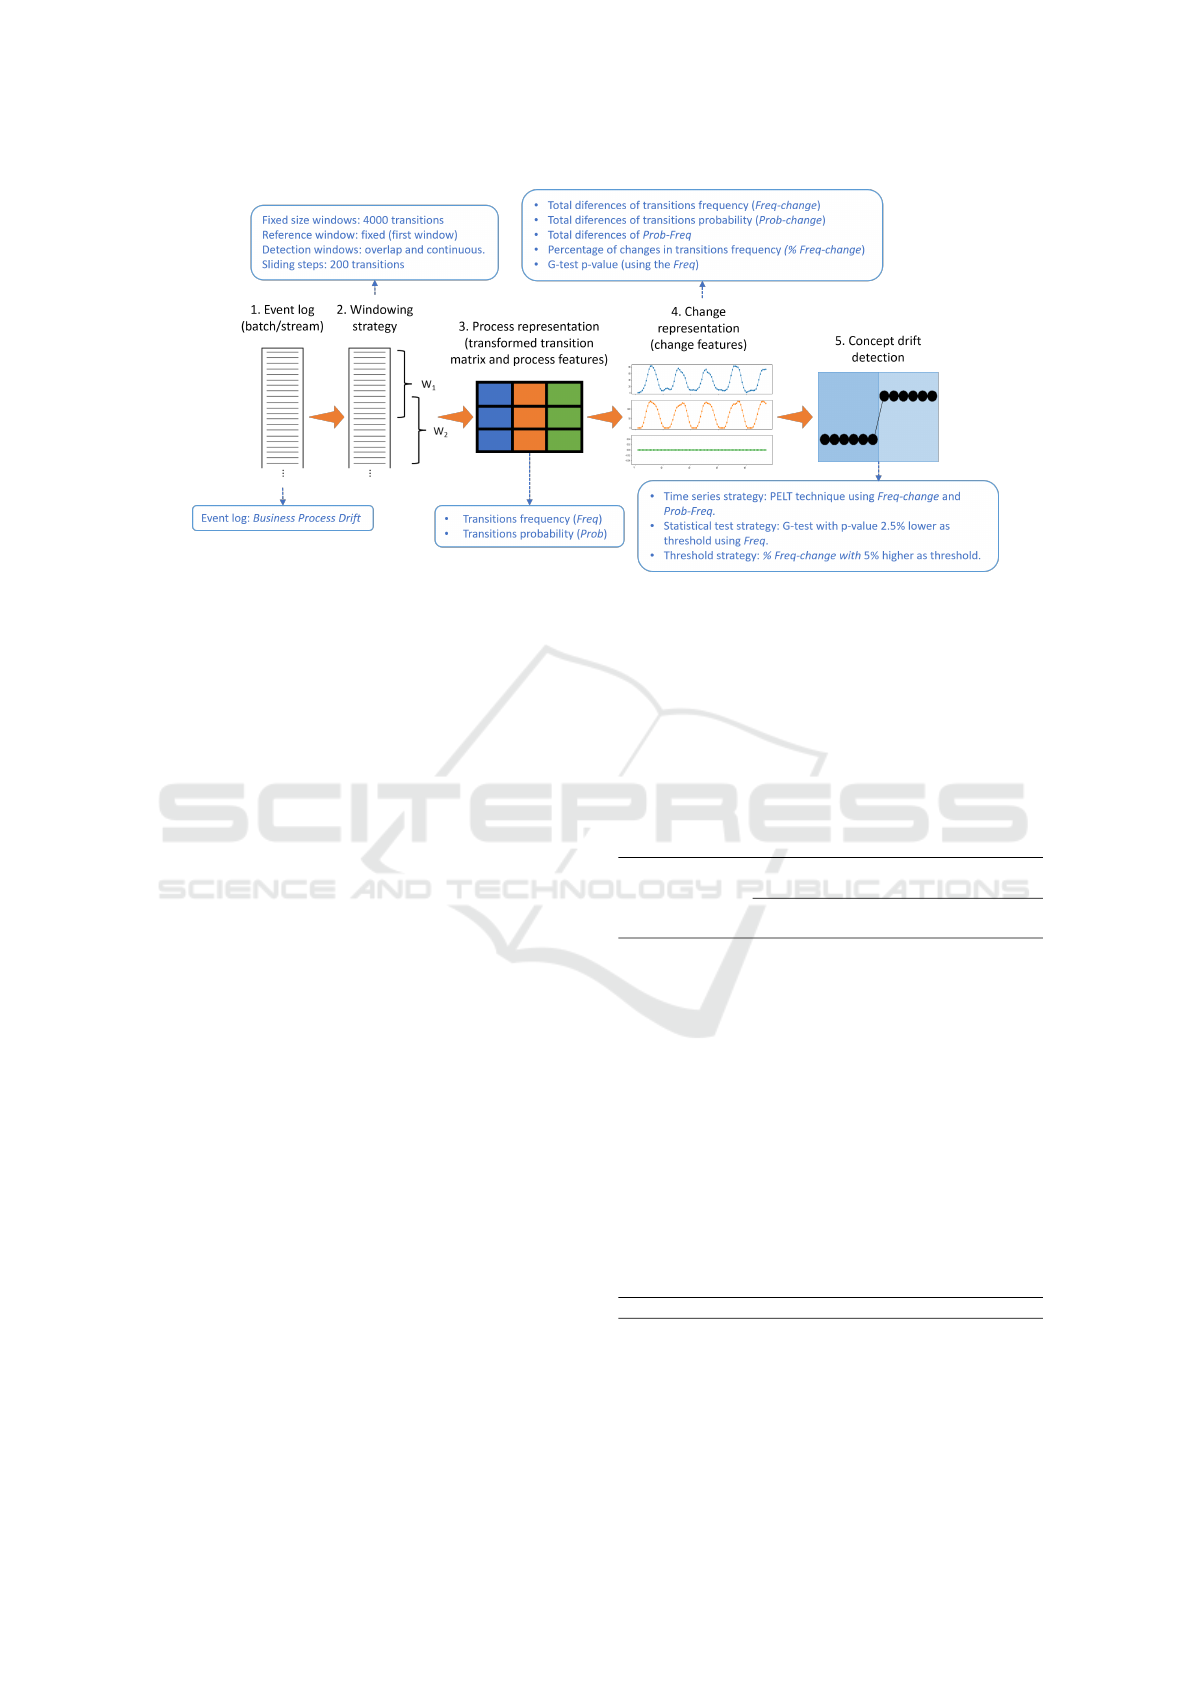
Figure 4: Summary of the strategies, techniques and features used in the experiments.
and probability differences (named Prob-Freq) is cre-
ated. This derived feature is a way of giving weight
to the differences that occur in both original features.
In sequence, each feature in Delta matrix is aggre-
gated using the sum function, resulting in a vector
containing the total differences for the transition fre-
quency (named Freq-change), transition probability
(named Prob-change) and Prob-Freq change features.
Second, for the statistical test strategy, the statistical
hypothesis test G-test (McDonald and of Delaware,
2009) is applied, based on the work of Ostovar et al.
(2016), using Freq of both windows being compared
to get the test p-value. Finally, for the threshold strat-
egy, the Freq-change is divided by the total amount of
transitions from both windows, resulting in the per-
centage of changes in transition frequency (named %
Freq-change), to be used in the threshold strategy.
The fifth step is the concept drift detection task.
For the time series strategy, based on the work of
Yeshchenko et al. (2021), the values of Freq-change
and Prob-Freq are used as input data, separately, for a
change point detection technique, named Pruned Ex-
act Linear Time (PELT) (Killick et al., 2012). PELT
performs an exact search, capable of detecting abrupt
changes and it can be used in cases where the exact
number of changes is not known. For the hypothesis
testing strategy, the test p-value result is used for de-
tecting concept drift, with the threshold of 2.5% lower
being considered a drift. In addition, a smoothing
treatment is applied to avoid outlier variations in the
p-value which could result in a false detection. Sim-
ilarly, for the threshold strategy, a threshold of 5%
higher in % Freq-change is used to detect a drift, as
well as a smoothing treatment is applied to avoid out-
lier variations in the feature.
4.2 Results
The results for the three detection strategies are re-
ported for effectiveness (through F1-score) and de-
tection delay and compared with the state of the art.
Table 2 and Table 3 summarize all results, which are
detailed in the following sections.
Table 2: Effectiveness results through F1-score for the three
strategies including comparison with baseline.
Change Base-
Time series Stat test Threshold
pattern line
strategy strategy strategy
Prob-
Freq
Freq-
change
Freq % Freq-
change
cb 0.92 1.00 1.00 1.00 1.00
cd 0.88 1.00 1.00 1.00 1.00
cf 0.98 1.00 1.00 1.00 1.00
cm 1.00 1.00 1.00 1.00 1.00
cp 1.00 1.00 1.00 1.00 1.00
fr 0.75 1.00 0.92 1.00 0.87
lp 1.00 1.00 1.00 1.00 0.84
pl 1.00 1.00 1.00 1.00 1.00
pm 1.00 1.00 1.00 1.00 1.00
re 1.00 1.00 1.00 1.00 0.87
rp 0.96 1.00 1.00 1.00 1.00
sw 1.00 1.00 1.00 1.00 1.00
IOR 1.00 1.00 1.00 1.00 1.00
IRO 1.00 1.00 1.00 1.00 1.00
OIR 0.97 1.00 1.00 1.00 1.00
ORI 1.00 1.00 1.00 1.00 1.00
RIO 0.98 1.00 1.00 1.00 1.00
ROI 1.00 1.00 1.00 1.00 1.00
Mean 0.969 1.000 0.996 1.000 0.976
F1-score is the result of the combination (har-
monic mean) of two other measures, precision and re-
call. Precision is given by the number of true positive
results divided by the number of all positive results,
even incorrect ones. The recall is given by the num-
ICEIS 2023 - 25th International Conference on Enterprise Information Systems
368

Table 3: Detection delay for the three strategies (in win-
dows) including comparison with baseline (in traces).
Change Base-
Time series Stat test Threshold
pattern line
strategy strategy strategy
Prob-
Freq
Freq-
change
Freq % Freq-
change
cb 52 10.82 10.41 8.96 9.33
cd 30 11.07 10.96 8.30 8.41
cf 28 11.26 10.45 7.59 8.70
cm 44 10.85 10.48 7.56 8.33
cp 32 11.15 10.81 7.00 8.04
fr 67 11.00 10.03 10.00 9.35
lp 54 11.70 11.44 9.48 8.14
pl 45 10.74 10.85 7.82 7.89
pm 32 10.93 10.66 7.26 8.18
re 28 11.63 11.00 8.89 8.25
rp 33 10.96 11.00 7.30 8.52
sw 30 11.00 10.85 6.67 7.44
IOR 24 11.56 11.33 7.26 8.92
IRO 47 10.78 10.44 7.63 9.18
OIR 19 11.22 11.15 6.48 6.93
ORI 32 11.29 11.11 6.89 8.37
RIO 37 11.04 11.04 7.48 9.44
ROI 18 11.22 11.07 6.33 7.11
Mean 36.22 11.12 10.84 7.72 8.36
ber of true positive results divided by the number of
all samples that should be classified as positive. A
detection is given as a true positive if at least one pos-
itive result is within the margin of error of the actual
concept drift (ground truth). F1-score is a normalized
measure, its highest possible value is 1 (or 100%) and
the smallest 0 (or 0%). Thus, methods with higher
F-scores are preferable.
Detection delay is a relevant point for the interpre-
tation of the validation criterion. The delay represents
the number of detection delay windows. As the win-
dowing strategy uses a sliding strategy, one can multi-
ply the detection delay value by the number of sliding
steps to arrive at the number of delay transitions. E.g.,
a delay of 10, using 200 transitions as sliding steps,
results in 2,000 detection delay transitions.
Moreover, the chosen windowing strategy has
window overlap, i.e., only the number of sliding
steps are new transitions from one window to an-
other. Therefore, when a concept drift occurs, it is
only present in the new transitions that have just ar-
rived. To know how many steps/windows are needed
to have a window with all new transitions, one can di-
vide the window size by the number of sliding steps.
E.g., for window size of 4,000 transitions and sliding
steps of 200 transitions, 20 steps/windows are taken
to have a window with all new transitions. This is im-
portant to evaluate the detection delay because, for the
same example above, a delay of 10 windows means
detection is performed in a window where half of the
transitions are from the new concept and the other half
from the old one; thus, getting a window with all tran-
sitions in the new concept was not necessary.
Finally, a margin of error of three windows is set
from the actual window starting the concept drift, plus
the number of slides needed until the window is com-
plete with new data. For the example above again,
the window takes 20 steps/windows to complete with
new data, adding three more steps result in 23 steps
of margin of error or acceptable distance to be con-
sidered a true positive.
4.2.1 Time Series Strategy
Table 2 shows the results of the time series strategy of
the Freq-change and Prob-Freq. The F1-score and
delay values represent the mean value in the three
event logs of different sizes (5,000, 7,500 and 1,0000
events) for each change pattern. The only change pat-
tern with F1-score different than 1.0 is fr, using Freq-
change. However, Prob-Freq is successful in per-
fectly capturing changes in this change pattern, most
likely because it considers changes in probability in
addition to frequency. Change pattern fr has more
subtle changes than the other change patterns, as they
only change the frequency of flows, which is probably
best represented by Prob-Freq.
Figures 5 and 6 illustratively show Freq-change
and Prob-Freq, respectively, over time for the event
logs of change pattern fr. The blue background rep-
resents the period in which the event log is composed
by the original process and the pink background rep-
resents the period where the event log is composed
by the process with the process changed. Vertical
dashed lines represent the concept drift detected by
the strategy. One can notice Prob-Freq better repre-
sents change pattern fr in a more stable way.
Figure 5: Time series strategy with Freq-change in change
pattern fr.
Figure 7 shows Freq-change for change pattern lp,
with F1-score of 1.0. One can notice the changes are
clearly represented by the feature, unlike change pat-
tern fr. All other change patterns with F1-score of 1.0
Towards a Transition Matrix-Based Concept Drift Approach: Experiments on the Detection Task
369
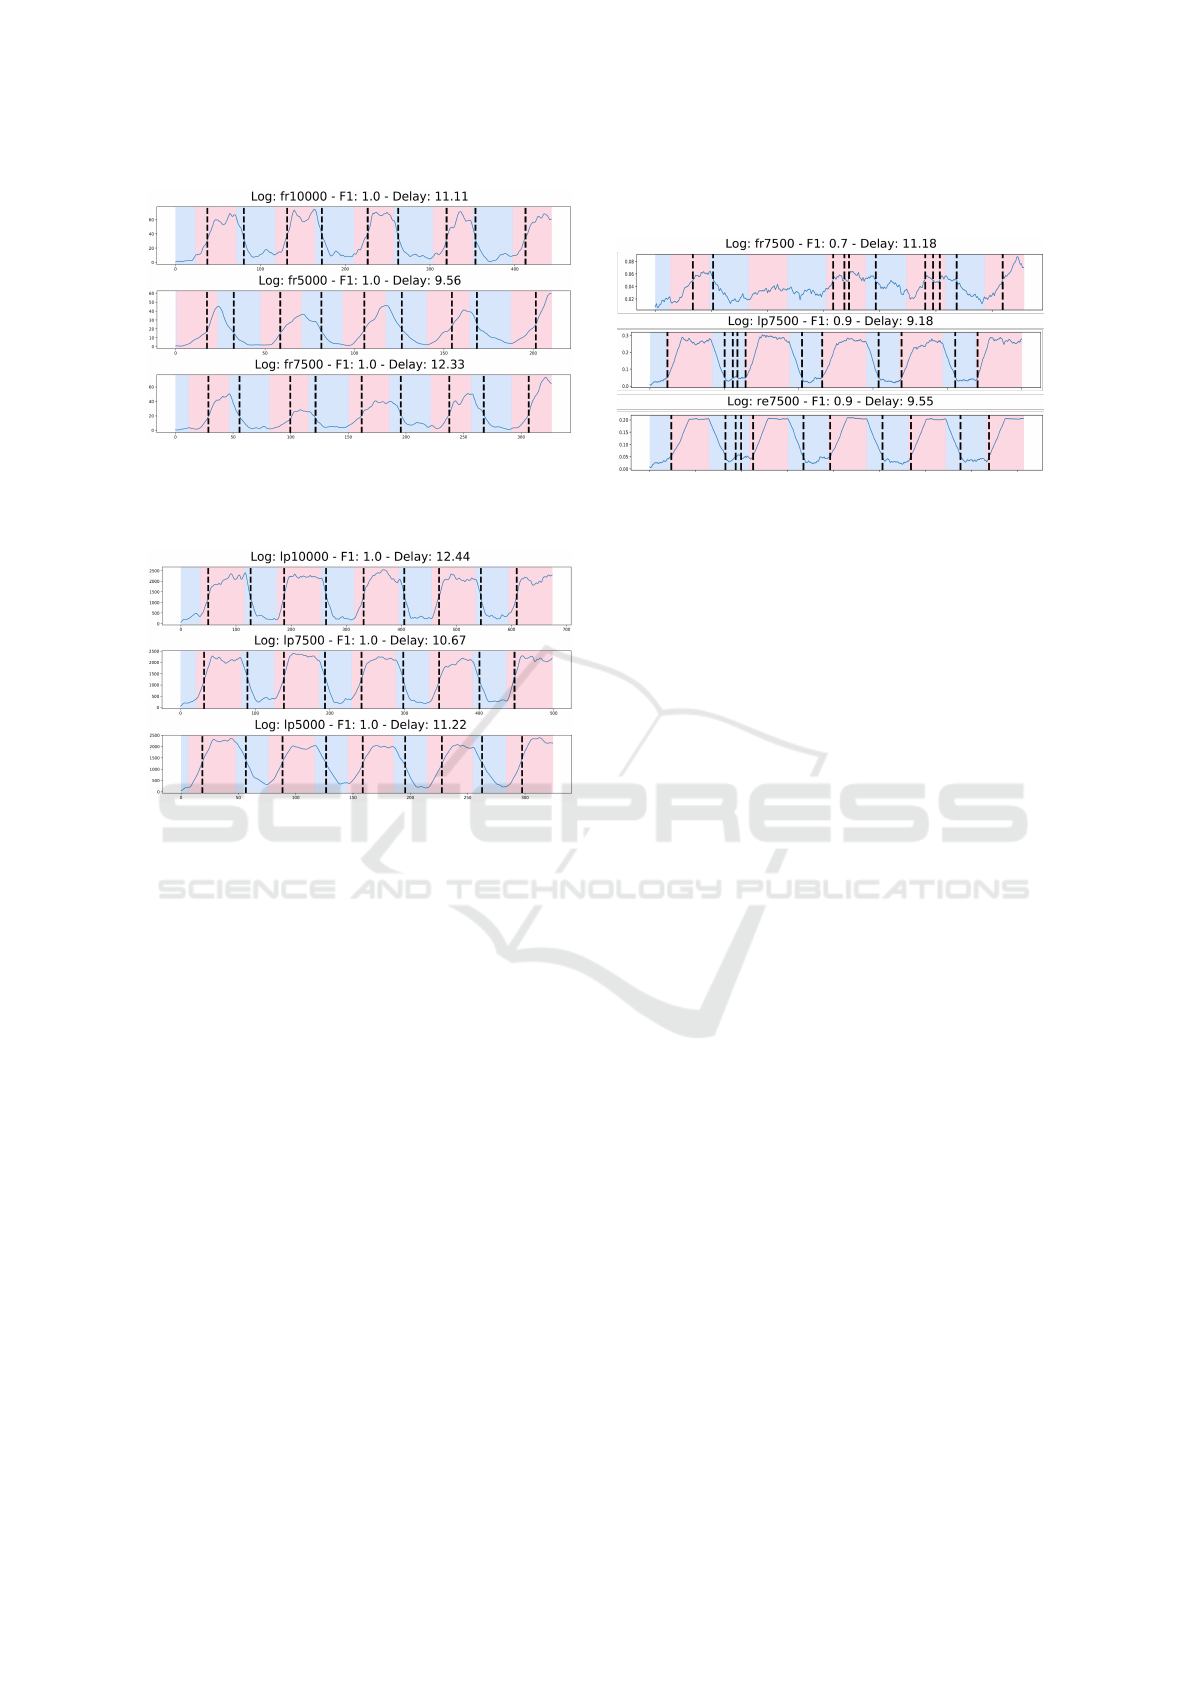
Figure 6: Time series strategy with Prob-Freq in change
pattern fr.
have change representations similar to Figure 7.
Figure 7: Time series strategy with Freq-change in change
pattern lp.
As for the detection delay in Table 3, both features
have similar results, with a slightly longer delay for
Prob-Freq. Overall, both features can detect changes
when the sliding window has about a little more than
half of the transitions with the new concept.
4.2.2 Statistical Test Strategy
Table 2 and Table 3 also shows the results of the statis-
tical test strategy using Freq. The strategy has perfect
F1-Score and the lowest mean delay. The mean delay
of change pattern fr stands out as above the rest and
similar to the delay of the same change pattern in the
time series strategy using Freq-change (i.e., 10.03),
which may mean a certain detection difficulty for this
change pattern. However, unlike the time series strat-
egy, which had an F1-score of 0.92, all concept drifts
are correctly detected for this strategy.
4.2.3 Threshold Strategy
Table 2 and Table 3 also shows the results of the
threshold strategy with % Freq-change, using 5% as
threshold. The results are very good, considering de-
tection is a fixed rule. Only three change patterns did
not have F1-score 1.0: fr, lp and re. Figure 8 shows a
result example for each of these change patterns.
Figure 8: Threshold strategy with % Freq-change in change
patterns fr, lp and re.
The % Freq-change has the same behavior as
Freq-change (cf. Figure 5), i.e., change pattern fr is
not well represented. Therefore, the threshold strat-
egy also has difficulties in detecting this change pat-
tern. The change patterns lp and re are well repre-
sented; however, at certain windows, the 5% thresh-
old is exceeded although there is no concept drift.
With a slightly higher threshold (e.g., 10%), the strat-
egy would detect all concept drifts for these two
change patterns, while a 10% threshold would detect
no concept deviations for the change pattern fr.
4.2.4 Baseline Comparison
Table 2 also shows the F1-score results of all strate-
gies tested compared with the results of the best
method (AWIN) from Maaradji et al. (2015)’s work
used as a baseline. In general, our experiments re-
sulted in better F1-scores than the baseline, which did
not obtain 100% in 7 of the 18 change patterns. In-
terestingly, change pattern fr is the worst result in the
baseline, showing it is a really difficult change pattern
to detect perfectly. However, our experiments only
focused on ensuring a better F1-score using a larger
window size, while the baseline looked for the best
balance between F1-score and detection delay.
Table 3 also shows the detection delay results
of the three tested strategies along with the baseline
results, although they are not directly comparable.
Despite different metrics, one can note the baseline
method manages to achieve a good balance between
the F1-score and the detection delay as it presents an
overall mean delay of 36 traces. As for our experi-
ments, the best result was achieved by the statistical
test strategy, with an overall mean delay of 7.72 win-
dows (equivalent to about 154 traces). However, from
the perspective of the percentage of the new concept
data in relation to the window size that were neces-
sary for the method to detect concept drift, the results
are equivalent. The baseline averages 36% (i.e., 36.22
ICEIS 2023 - 25th International Conference on Enterprise Information Systems
370

traces of mean delay per window of 100 traces), while
the statistical test strategy used with our approach av-
erages about 38% (i.e., about 154 traces of mean de-
lay per window of about 400 traces).
5 CONCLUSION
We propose a concept drift approach in process min-
ing that use a single, simple, effective and expand-
able (i.e., that can handle different aspects’ items)
data structure – the transformed transition matrix. We
showed how easy is to create the transformed transi-
tion matrix, to store different features extracted from
the event log, the window comparison to extract fea-
tures that represent the changes in the process, and
how to use these features in the detection task. We
showed how the approach and the data structure per-
forms in the task of detecting abrupt changes in the
control-flow and in an offline scenario, with three dif-
ferent detecting strategies (time series strategy, statis-
tical test strategy, and threshold strategy). The three
strategies had good results in the tested experiments,
showing an encouraging potential of the approach.
Two issues are relevant to be considered: (i) as
the approach use the transformed transition matrix, all
features must be at the transition level (e.g., activity
and trace data must be adapted); and (ii) as the transi-
tion matrix features are at a granular level of detail, a
minimum window size dependency may be required
to ensure effectiveness.
As future work, we plan to run more experiments
to evaluate the impact of the parameters and test the
approach on other synthetic public event logs. We
also plan to expand the approach to consider the other
items of concept drift aspects, starting with localiza-
tion and characterization tasks, using the time process
perspective in an online scenario.
REFERENCES
Accorsi, R. and Stocker, T. (2012). Discovering workflow
changes with time-based trace clustering. In Data-
driven Proc. Discov. and Anal., pages 154–168.
Adams, J., van Zelst, S., Quack, L., Hausmann, K., van der
Aalst, W., and Rose, T. (2021). A framework for ex-
plainable concept drift detection in process mining. In
Bus. Process Manage., pages 400–416.
Appice, A. and Malerba, D. (2016). A co-training strategy
for multiple view clustering in process mining. IEEE
Trans. Serv. Comput., 9(6):832–845.
Barbon Junior, S., Tavares, G., Da Costa, V., Ceravolo, P.,
and Damiani, E. (2018). A framework for human-in-
the-loop monitoring of concept-drift detection in event
log stream. In Companion The Web Conf. 2018, page
319–326.
Bose, R., Van Der Aalst, W., Zliobaite, I., and Pechenizkiy,
M. (2014). Dealing with concept drifts in process min-
ing. IEEE Trans. on Neural Networks and Learning
Syst., 25(1):154–171.
Bose, R., Van Der Aalst, W.,
ˇ
Zliobaite, I., and Pechenizkiy,
M. (2011). Handling concept drift in process mining.
In Adv. Inf. Syst. Eng., pages 391–405.
Brockhoff, T., Uysal, M., and Van Der Aalst, W. (2020).
Time-aware concept drift detection using the earth
mover’s distance. In Int’l Conf. Process Mining, pages
33–40.
Carmona, J. and Gavald
`
a, R. (2012). Online techniques for
dealing with concept drift in process mining. In Adv.
in Intel. Data Anal. XI, pages 90–102.
Ceravolo, P., Tavares, G., Barbon Junior, S., and Damiani,
E. (2022). Evaluation goals for online process min-
ing: A concept drift perspective. IEEE Trans. Serv.
Comput., 15(4):2473–2489.
de Sousa, R. G., Peres, S. M., Fantinato, M., and Reijers,
H. A. (2021). Concept drift detection and localiza-
tion in process mining: An integrated and efficient ap-
proach enabled by trace clustering. In ACM Symp.
Appl. Computing, page 364–373.
Gemaque, R. N., Costa, A. F. J., Giusti, R., and dos Santos,
E. M. (2020). An overview of unsupervised drift de-
tection methods. WIREs Data Mining and Knowledge
Discovery, 10(6):e1381.
Hassani, M. (2019). Concept drift detection of event
streams using an adaptive window. In Eur. Conf.
Model. Simul., pages 230–239.
Hompes, B., Buijs, J., Van Der Aalst, W., Dixit, P., and Bu-
urman, J. (2015). Detecting change in processes us-
ing comparative trace clustering. In Data-driven Proc.
Discov. and Anal., pages 95–108.
Hompes, B., Buijs, J., Van Der Aalst, W., Dixit, P., and Bu-
urman, J. (2017). Detecting changes in process behav-
ior using comparative case clustering. In Data-driven
Proc. Discov. and Anal., pages 54–75.
Impedovo, A., Mignone, P., Loglisci, C., and Ceci, M.
(2020). Simultaneous process drift detection and char-
acterization with pattern-based change detectors. In
Discovery Science, pages 451–467.
Killick, R., Fearnhead, P., and Eckley, I. A. (2012). Optimal
detection of changepoints with a linear computational
cost. Journal of the American Statistical Association,
107(500):1590–1598.
Kurniati, A., McInerney, C., Zucker, K., Hall, G., Hogg,
D., and Johnson, O. (2019). A multi-level approach
for identifying process change in cancer pathways. In
Bus. Process Manage. Workshops, pages 595–607.
Kurniati, A., McInerney, C., Zucker, K., Hall, G., Hogg,
D., and Johnson, O. (2020). Using a multi-level pro-
cess comparison for process change analysis in can-
cer pathways. Int’l J. Environ. Res. Public Health,
17(19):1–16.
Lin, L., Wen, L., Lin, L., Pei, J., and Yang, H. (2022). Lcdd:
Detecting business process drifts based on local com-
Towards a Transition Matrix-Based Concept Drift Approach: Experiments on the Detection Task
371

pleteness. IEEE Trans. Serv. Comput., 15(4):2086–
2099.
Liu, N., Huang, J., and Cui, L. (2018). A framework
for online process concept drift detection from event
streams. In IEEE Int’l Conf. Serv. Comput., pages
105–112.
Lu, J., Liu, A., Dong, F., Gu, F., Gama, J., and Zhang, G.
(2019). Learning under concept drift: A review. IEEE
Trans. on Knowledge and Data Eng., 31(12):2346–
2363.
Lu, Y., Chen, Q., and Poon, S. (2021a). Detecting and un-
derstanding branching frequency changes in process
models. In Enterprise, Business-Proc. and Inf. Syst.
Modeling, pages 39–46.
Lu, Y., Chen, Q., and Poon, S. (2021b). A robust and
accurate approach to detect process drifts from event
streams. In Bus. Process Manage., pages 383–399.
Luengo, D. and Sep
´
ulveda, M. (2012). Applying clustering
in process mining to find different versions of a busi-
ness process that changes over time. In 7th Int’l Wks.
on Bus. Proc. Intel., pages 153–158.
Maaradji, A., Dumas, M., La Rosa, M., and Ostovar, A.
(2015). Fast and accurate business process drift detec-
tion. In Bus. Process Manage., pages 406–422.
Maaradji, A., Dumas, M., Rosa, M., and Ostovar, A. (2017).
Detecting sudden and gradual drifts in business pro-
cesses from execution traces. IEEE Trans. on Knowl.
and Data Engin., 29(10):2140–2154.
Manoj Kumar, M., Thomas, L., and Annappa, B. (2015).
Capturing the sudden concept drift in process mining.
In Int’l Works. on Algor. & Theories for the Anal. of
Event Data, pages 132–143.
Martjushev, J., Jagadeesh Chandra Bose, R., and van der
Aalst, W. (2015). Change point detection and deal-
ing with gradual and multi-order dynamics in process
mining. In Perspectives in Bus. Inform. Research,
pages 161–178.
McDonald, J. and of Delaware, U. (2009). Handbook of
Biological Statistics. Sparky House Publishing, 2 edi-
tion.
Ostovar, A., Leemans, S., and Rosa, M. (2020). Robust
drift characterization from event streams of business
processes. ACM Trans. Knowl. Discov. Data, 14(3).
Ostovar, A., Maaradji, A., La Rosa, M., and Ter Hofstede,
A. (2017). Characterizing drift from event streams of
business processes. In Adv. Inf. Syst. Eng., pages 210–
228.
Ostovar, A., Maaradji, A., La Rosa, M., ter Hofstede, A.,
and van Dongen, B. (2016). Detecting drift from event
streams of unpredictable business processes. In 35th
Int’l Conf. on Conceptual Modeling, pages 330–346.
Pauwels, S. and Calders, T. (2019). An anomaly detection
technique for business processes based on extended
dynamic bayesian networks. In ACM/SIGAPP Symp.
Appl. Computing, page 494–501.
Richter, F. and Seidl, T. (2017). Tesseract: Time-drifts in
event streams using series of evolving rolling averages
of completion times. In Bus. Process Manage., pages
289–305.
Sato, D. M. V., De Freitas, S. C., Barddal, J. P., and Scal-
abrin, E. E. (2021). A survey on concept drift in pro-
cess mining. ACM Comput. Surv., 54(9).
Seeliger, A., Nolle, T., and M
¨
uhlh
¨
auser, M. (2017). De-
tecting concept drift in processes using graph metrics
on process graphs. In Conf. on Subject-Oriented Bus.
Process Manage.
Song, M., G
¨
unther, C. W., and van der Aalst, W. (2009).
Trace clustering in process mining. In Int’l Wks. on
Bus. Proc. Intel., pages 109–120.
Stertz, F. and Rinderle-Ma, S. (2018). Process histories - de-
tecting and representing concept drifts based on event
streams. In Int’l Conf. on Coop. Inform. Sys., pages
318–335.
Tavares, G., Ceravolo, P., Da Costa, V., Damiani, E., and Ju-
nior, S. (2019). Overlapping analytic stages in online
process mining. In IEEE Int’l Conf. Serv. Comput.,
pages 167–175.
Truong, C., Oudre, L., and Vayatis, N. (2020). Selective re-
view of offline change point detection methods. Signal
Processing, 167.
van der Aalst, W. (2014). Process mining in the large: A
tutorial. In 3rd Eur. Summer Sch. on Bus. Intell., pages
33–76.
van der Aalst, W. (2016). Process Mining: Data Science in
Action. Springer Berlin, Heidelberg, 2 edition.
van der Aalst, W. and et al. (2012). Process mining man-
ifesto. In 7th Int’l Wks. on Bus. Proc. Intel., pages
169–194.
Weber, P., Bordbar, B., and Ti
ˇ
no, P. (2011). Real-time de-
tection of process change using process mining. In
Imp. Coll. Comput. Stud. Wks, pages 108–114.
Yeshchenko, A., Ciccio, C., Mendling, J., and Polyvyanyy,
A. (2019a). Comprehensive process drift analysis with
the visual drift detection tool. In 38th Int’l Conf. on
Conceptual Modeling, pages 108–112.
Yeshchenko, A., Di Ciccio, C., Mendling, J., and
Polyvyanyy, A. (2019b). Comprehensive process drift
detection with visual analytics. In 38th Int’l Conf. on
Conceptual Modeling, pages 119–135.
Yeshchenko, A., Di Ciccio, C., Mendling, J., and
Polyvyanyy, A. (2021). Visual drift detection for event
sequence data of business processes. IEEE Trans. Vi-
sual Comput. Graphics, 28(8):3050–3068.
Yeshchenko, A., Mendling, J., Di Ciccio, C., and
Polyvyanyy, A. (2020). VDD: A visual drift detection
system for process mining. In ICPM Doc. Consort.
and Tool Demo. Track, pages 31–34.
Zheng, C., Wen, L., and Wang, J. (2017). Detecting process
concept drifts from event logs. In Int’l Conf. on Coop.
Inform. Sys., pages 524–542.
ICEIS 2023 - 25th International Conference on Enterprise Information Systems
372
