
Student Teacher Interaction While Learning Computer Science: Early
Results from an Experiment on Undergraduates
Manuela-Andreea Petrescu
a
and Kuderna-Iulian Benta
b
Department of Computer Science, Faculty of Mathematics and Computer Science, Babes¸-Bolyai University,
Cluj-Napoca, Romania
Keywords:
Learning, Professional Development, Integration, Education, Experiment, Undergraduate.
Abstract:
The scope of this paper was to find out how the students in Computer Science perceive different teaching styles
and how the teaching style impacts the learning desire and interest in the course. To find out, we designed
and implemented an experiment in which the same groups of students (86 students) were exposed to different
teaching styles (presented by the same teacher at a difference of two weeks between lectures). We tried to
minimize external factors’ impact by carefully selecting the dates (close ones), having the courses in the same
classroom and on the same day of the week, at the same hour, and checking the number and the complexity
of the introduced items to be comparable. We asked for students’ feedback and we define a set of countable
body signs for their involvement in the course. The results were comparable by both metrics (body language)
and text analysis results, students prefer a more interactive course, with a relaxing atmosphere, and are keener
to learn in these conditions.
1 INTRODUCTION
We propose to validate the importance of interac-
tion, general atmosphere, and teacher’s passion in the
learning process in Computer Science courses. We
created an experiment where the delivered informa-
tion is comparable but the teaching style and interac-
tion are deliberately modified.
By analyzing the student’s perception - both on
visual level/observed behavior (they were sleepy,
yawns, laying on the benches) and from their col-
lected textual feedback. The feedback was analyzed
manually using thematic analysis.
We wanted to find out if there is a difference in
perceived understanding and interest from students
when we use interactive methods combined with el-
ements of nonverbal communication compared to a
classical teaching method (just presenting the infor-
mation). Also, to find out if the teaching method-
ology impacted students’ perception related to lec-
ture in terms of affectiveness (they feel enthusiastic,
good, interested or bored, discouraged) and in cogni-
tive terms (they understand better / worse). We cre-
ated a list of nonverbal elements (yawns, laying on
the desks, arms positions, and so on) that we analyzed
a
https://orcid.org/0000-0002-9537-1466
b
https://orcid.org/0000-0002-4245-599X
during the lectures and analyzed their frequency. At
the same time, we asked the students for anonymous
feedback.
Education is a key component of society, influenc-
ing a country’s future development; due to its impor-
tance, countries allocate a part of their expense budget
to the educational system. Except for money, other
factors influence the attractiveness of a specific do-
main. For Computer Science and Mathematics do-
main, for example, the interests of secondary schools
students depend on a set of factors: the student’s so-
cioeconomic status, performance, self-efficacy, mo-
tivation, engagement, and task value beliefs (Kahra-
man, 2022; Spieler et al., 2020). Universities noticed
that the number of students that graduate is smaller
compared to the enrolled students, some tried to de-
crease the drop-out rates by offering additional mate-
rials and offering some courses in an online or hybrid
format to minimize the tuition fees and to increase
accessibility. Online courses increase accessibility as
the students can learn whenever they have time, they
can learn at their own pace, and having access to re-
sources before the course allows them to ask more
and more complex questions (Baquerizo et al., 2020);
however neither going online solved all the problems.
Paper (Baquerizo et al., 2020) analyzes methods to
motivate students in an online environment, as (Pe-
Petrescu, M. and Bentasup, K.
Student Teacher Interaction While Learning Computer Science: Early Results from an Experiment on Undergraduates.
DOI: 10.5220/0011844400003470
In Proceedings of the 15th International Conference on Computer Supported Education (CSEDU 2023) - Volume 1, pages 209-216
ISBN: 978-989-758-641-5; ISSN: 2184-5026
Copyright
c
2023 by SCITEPRESS – Science and Technology Publications, Lda. Under CC license (CC BY-NC-ND 4.0)
209

trescu and Sterca, 2022) mentioned students’ diffi-
culty in finding a quiet place for learning.
2 LITERATURE REVIEW
A key to success for companies and countries is hu-
man capital, well prepared, capable people can raise
a company or a country. To have prepared and well-
qualified people, education, the methods to transmit
information, and information accessibility play a ma-
jor role. Due to this need, different methods were
analyzed and proposed in the literature with the de-
clared scope to increase teaching effectiveness, some
of the methods were strictly related to the computer
science domain (Liu et al., 2022; Salas, 2017; George,
2020). Teaching methods in computer science were
also subjects for other papers/books that analyzed the
impact of teaching styles, some mention teacher col-
laboration methods, technical professional develop-
ment (Wang et al., 2021), or offering guides for com-
puter science instructors in universities (Hazzan et al.,
2020).
In (Erascu and Mladenovici, 2022) a study took
place while applying Student-centered Learning in
Computer Science. One of the three research ques-
tions was trying to investigate if the student centered
approach is perceived as better compared to a control
group. Pre-tests and post-tests were used. The re-
sults show a positive impact of the student centered
approach on the active learning dimension. However,
our study is oriented more toward the subjective per-
ception of the didactic process. The perspective from
(Makhlouf. and Mine., 2021) is similar to ours in the
sense that the comments are clustered in a small num-
ber of classes with similar meaning to build up an au-
tomated feedback system that facilitates individual-
ized feedback given by the professor to students. By
contrast our work focus on understanding the impact
of nonverbal cues effect on the learning process.
The relationship between emotions and engage-
ment in learning in an e-learning controlled environ-
ment is piloted using three biosensors (El-Abbasy.
et al., 2018): a camera, a 14-channel EEG, and an
eye-tracker. The lab-like setup, the reduced number
of participants (15), and the small number of emo-
tions considered give us inspiration for what we could
use while measuring the learning engagement level in
real-time to improve the quality of teaching. Comple-
mentary to our approach in (Alshaikh. et al., 2021) an
automatic authoring tool based on the Socratic dia-
log is proposed to improve code comprehension. The
authors claim that it improves students’ programming
knowledge by 43% in terms of learning gain.
3 DESIGN OF THE
STUDY/EXPERIMENT
3.1 Experimental Setup
The experiment involved a Computer Science teacher
from a university and students from Computer Sci-
ence. The courses were lectured in English during the
laboratory, it was a first-year course called Computer
System Architecture and was structured in two parts:
a theoretical part where different teaching methods
were implemented that lasted for an hour, and the sec-
ond hour was preserved for exercises and examples
and a QA (Question and Answer) session. Because
we considered the students to understand the theoret-
ical part better, all the introduced notions had small
examples during the theoretical part and when possi-
ble, there were mentioned correlations with previous
knowledge/information the students should have ac-
quired. The courses were held in the same location
at the same hour to minimize the environmental im-
pact on the student’s perception. Both courses were
presented using a projector for a presentation, and in
the first one, the blackboard was also used to present
other examples. The weather or some specific events
could impact the student’s perception, but we choose
to have the course as close to one another as possible
(two weeks difference). We were fortunate that there
were no major weather differences during the period.
We selected a time of year that did not have specific
events (holidays, the first days of the semester, con-
certs in the city, and so on). We organized the first
course to be the interactive one and the second to be in
a classic ”lecturing” style, because we asked for feed-
back after each course, we wanted them to be able to
analyze the differences (”lecturing” style in our opin-
ion is more commonly used than the interactive style,
where the teacher must do additional efforts to imply
the students).
3.2 Participants
86 students from Computer Science participated in
the experiment, 75 of them were students aleatory
selected from the first year, and 11 students were in
the second year of study that did not pass the course
exam in the first year and had to retake the course.
They opted to come to a specific laboratory based
on a timetable and to have the lab with a preferred
teacher. There was no specific selection depending
on gender or other criteria, the participant set was
randomly selected. The participants were informed
about the experiment, and that their participation was
optional (that’s why the number of students that pro-
vided feedback and participated actively in the survey
CSEDU 2023 - 15th International Conference on Computer Supported Education
210

by providing answers is lower than the overall number
of students that took part in the lectures). The students
were grouped into five groups, each group having be-
tween 15 and 17 people. For each group was delivered
Lecture 1 and Lecture 2.
The participants were required to provide: 1.
Feedback after each lecture using an anonymous form
that contained questions related to how well they un-
derstood the concepts and the presented information,
2. Give their opinion about the delivery in terms of
interaction, voice volume, body language, the over-
all atmosphere, and if the delivery had an impact on
the interest in learning in that specific domain. We
decided to have the same participants set for both
lectures/setup so they could appreciate and compare
the teaching styles and the teaching style’s impact on
them because an event or a piece of information could
have a different impact depending on the involved per-
son’s characteristics and mood.
3.3 Lecture Comparison in Terms of
New Information
To have a valid experiment, and to be able to cor-
rectly compare the results of the teaching methods,
we selected two introductory courses: Conversions
and Complementary Code and ASM Arithmetic ex-
pressions that were similar in terms of presented in-
formation (content, difficulty, and the number of new
notions). We analyzed the presented information and
structured it into two categories: Build-up and New
Info. In each category, we added the topics that were
discussed and we assigned a difficulty level (DF) from
1 to 3, where 1 is easy, 2 is medium and 3 represents
a difficult topic. We summarized the points for each
topic to find out what was the overall course difficulty.
When we assigned the difficulty level we also took
into consideration if a topic was a completely new one
or if it had an increased complexity (build-up) infor-
mation for a subject that the students already should
know. We summarized the difficulty levels (DF) and
the results were close (12 to 13) for new information
and (1 to 3) for build-up information. We conclude
that the information presented had a comparable de-
gree of difficulty and a comparable number of items.
Below we visualized in Table 1 the topics presented
in each lecture, the build-up type is noted with ”b”.
4 DATA COLLECTION AND
ANALYSIS
The responses were collected anonymously in the
form of open answers, and the students were informed
Table 1: New & build-up topics comparison.
New info - L1 DF Type New info - L2 DF Type
Conversion to base 16
and viceversa
1 b ADC & SBB instruc-
tions
2 b
Conversion to base 8 and
viceversa
1 b IDIV & IMUL 2 b
Addition & Substraction
base 2
1 b CBW & CWD 2 b
Addition & Substraction
base 16
1 b CWDE & CDQ 2 b
Sign bit 1 new Declaring variables 1 new
Complementary code 2 new Declaring constants 1 new
Complement to 2 2 new Push / Pop flags & reg-
istries
2 new
Representation size 1 new Push / Pop flags & reg-
istries
2 new
Asm tools & Program
example
2 new Stack applications 1 new
related to the purpose of the questions and also about
how their responses will be used. The students were
asked to provide optional feedback on a quiz at the
end, but there was no time limit. The response quiz
remained open for two weeks. After this interval, we
considered that we will not get other valid responses.
However, most of the responses (93%) were sent on
the same day - we collected the timestamp by check-
ing the response poll at different intervals.
We opted for open questions as they offer a better
and more profound understanding. We used quantita-
tive methods and more specific questionnaire surveys
as they were defined in the empirical community stan-
dards (Ralph, Paul (ed.), 2021). These methods were
previously used in Computer Science related studies
(Tichy et al., 1995; Redmond et al., 2013; Petrescu
et al., 2022). For text interpreting, we used thematic
analysis (Braun et al., 2019) to interpret the text and
take into account the recommendations mentioned in
(Kiger and Varpio, 2020) for free text interpretation.
The method was previously used in Software Engi-
neering in other studies: (Cruzes and Dyba, 2011;
Gregory et al., 2015). The reflexive approach was ap-
plied as described by (Kiger and Varpio, 2020; Mo-
togna. et al., 2021), and it consisted of the following
steps:
A number of 86 students participated in the exper-
iment, and their feedback was monitored and checked
in two ways:
• By participating voluntarily and providing an-
swers for a quiz - we gathered 73 answers.
• By observing their body language at the end and
during the lectures and looking for quantifiable
signs of their interest such as the number of
yawns, the number of questions asked, and for
less quantifiable signs such as laying on the desks,
body position, eye movement, and so on.
We asked the following open questions related to
each course to get more information: Q1: Did you
understand the information presented in the lecture?,
Q2: How was the delivery of the course and the teach-
Student Teacher Interaction While Learning Computer Science: Early Results from an Experiment on Undergraduates
211

ing style? and Q3: What was the effect of the teaching
style related to learning interest? What did you like/
dislike about this course? Next, we will break down
and analyze each research question separately.
4.1 Q1:Did You Understand the
Information Presented in the
Lecture?
We tried to structure the information in a logical and
easy-to-understand way, where one presented topic is
tightly related to the previous one, thus creating an
easy-to-follow and clear presentation. The presented
information was doubled by exercises (9 answers in
total appreciated integrating exercises in the theoreti-
cal part): ”we got involved in the exercises too”. In
the answers provided for the course structure and con-
tent, we classified the keywords into two classes, one
related to content and structure and one related to the
content’s applicability Table 2.
Table 2: Keywords class.
Item Class Selected keywords
Structure Well structured, Easy to understand, Clear, On the point,
Good, Exercises
Applicability Useful, Valuable, Changed the perspective,
We analyzed the prevalence of the keywords in the
received answers, for each course, each student pro-
vided three answers related to structure and content,
delivery, and effect. Sometimes content related key-
words appeared in two out of three, or even in all
three answers, sometimes more keywords appeared
in one answer. We measured them to establish the
general impact of a feature and then we compared
the results for each lecture. We analyzed the an-
swers, each text could contain none, one or more key-
words (clearly, well structured, and so on) that were
related to a positive appreciation. When we sum-
marized all the keywords, they were more than the
number of the students, so the percentage compared
to the number of the students was 114.58%. Same
method was performed when analyzing the responses
for the second lecture and we obtained 74.07%. The
positive appreciation related to content and structure
was higher in the first course compared to the sec-
ond course (114.58% vs 74.07%). We took into con-
sideration two factors: in the first course the students
were more motivated to provide longer answers, thus
increasing the prevalence of specific keywords (num-
ber of words/answer/course), and having 74.07% of
answers appreciating positively the structure and the
content in the second course, we considered that both
courses scored high in terms of content and structure,
i.e. ”everything was explained clearly and if I had any
questions they were answered”,vs. ”The information
was structured well, but the delivery is not as helpful
compared to more active and interactive one”.
However, the keyword reflecting the overall appli-
cability was much higher in the first course, we be-
lieve the difference lies in the information taught: in
the first lecture the students found out why we have
specific data types, information generally useful ”The
content was interesting and it changed the way I view
computers and programming”. In the second lecture,
they found only instructions related to Assembly Pro-
gramming Language, and considered that the topics
presented in lecture 2 do not have any applicability.
Figure 1: Applicability and Structure Keywords Prevalence.
Based on their answers, we concluded that:
A. The information was structured clearly and easily.
B. The students appreciated the applicability of the
presented information in the first course, thus rein-
forcing the fact that students are more interested in
practical aspects (when they realize the theoretical
part’s applicability).
4.2 Q2: How Was the Delivery of the
Course and the Teaching Style?
For the second question, we identified two major
classes: one that refers to the delivery itself contain-
ing keywords such as pace, interactivity, and the vol-
ume of the voice, and one that refers to the teacher’s
involvement: passionate, calm, open-minded. We
counted the prevalence of the first class in the answers
for the first lecture (35 mentions), the relatively sim-
ilar prevalence was obtained for the second lecture,
for the same class, but the appreciation had a nega-
tive connotation (31 mentions): no interaction, blunt,
boring, bad delivery. In both cases there were key
items with neutral connotation: delivered straight, or
”Okay”. The Table 3 reflects the resulting keywords
for the second question.
CSEDU 2023 - 15th International Conference on Computer Supported Education
212

Table 3: Delivery Keywords Prevalence.
Item Class Selected keywords (number of appearance)
Content Delivery
Lecture 1
Interactive / dynamic (9), Well delivered (9), Right
pace (6), Presentation ok /good (4), Open discus-
sion (2), Check understanding (2), Answers (2),
PPT and white board (1).
Content Delivery
Lecture 2
No interaction/interactivity (19), Pace too fast (5),
Blunt/Boring (4), Ok (4), Bad delivery (1), Mono-
tone (1), Delivered straight (1)
Teacher’s attitude
Lecture 1
Relaxed Atmosphere (9), Friendly (5), Active (4),
Calm (3), Cherry attitude (1), Nice (1), Helpful (2),
Funny (2), , Involved (2), Open-minded (1)
Teacher’s attitude
Lecture 2
Cold and distant way (2), No emphasis (1)
The answers from the first lecture provided in-
formation not only about the delivery but also their
perception related to a supportive environment: ”the
information was delivered relatively good, you made
sure we were not behind”. We also got short answers
related more to the lecture difficulty: ”Pretty basic
stuff, she made it feel interesting though”. In the
second lecture, there were still examples presented,
but the delivery changed: sitting down, fewer body
movements and gestures, less eye contact, and so on.
Some students managed to figure out some of the
teacher’s delivery methods that influenced the presen-
tation: ”The information was hard to follow. There
was no emphasis put on the more important informa-
tion”, others stated that ”I managed to understand the
information in its entirety. The content in itself was
logical and the required explanation or clarification
of the written theory was provided by the professor”.
The second class keywords that were identified
can be traced more to the lecturer’s personality than
to the teaching style: active, friendly, calm, helpful,
and even funny: ”The atmosphere was relaxed and
the course was taught in a fun way”
It was interesting that all these key items appeared
in the answers from the first course, and none ap-
peared in the answers related to the second course.
There were no key items reflecting personality char-
acteristics. However, key items were referring to the
overall presentation ”It was bland, boring, but I man-
aged to understand”.
For this section, we can conclude that:
A. The presentation mode influenced the perceived
difficulty level of the presented information. The stu-
dents found it more difficult to concentrate and not
lose focus during the course when the course was not
presented in an interactive way (even if there were
exercises and examples and the teacher answered the
questions).
B. Students reacted positively to the lecture’s person-
ality, appreciating a more ”open discussion” lecture
than a classical one. In the classical ”just words”
style (as one of the students mentioned”, the students
were bored ” it felt like a YouTube tutorial, tutorials
are useful but not enjoyable”.
4.3 Q3: What Was the Effect of the
Teaching Style Related to Learning
Interest? What Did You Like/
Dislike About this Course?
We expected that teaching style to have an impact on
the overall interest. We analyzed the teaching style
effect on students by two methods:
• We analyzed their body language during and at
the end of the course to look for signs.
• We asked for their feedback in the form of open
questions.
In the interactive lecture, when they were actively
asked to answer questions and constantly provoked
related to their knowledge or to make logical deduc-
tions, the students were active, we counted a small
number of yawns only at the beginning of the courses
that took place from 8 am. In the other course, fa-
tigue, sleepiness, and uninterested signs of body lan-
guage appeared approximately half an hour after the
course started, and much faster (after 10-15 minutes)
in the courses that took place at 8 am. Next, in Ta-
ble 4 can be seen a comparison between the observed
body language signs, two lectures took place in the 8
am - 10 am interval, two lectures took place in the 10
am-12 am interval, and one lecture took place at 12
am - 2 pm interval for each topic. So in total, we an-
alyzed 10h lectures, by observing and counting how
many times a specific behavior appeared.
Table 4: Body language signs observed during the lectures.
Body Signs
That Ap-
peared (per
lecture)
L1 (8.00-
10.00)
L1 (10.00-
12.00)
L2 (8.00-
10.00)
L2 (10.00-
12.00)
Laying on
the back,
related posi-
tions
Only in the
first 10-15
min, 22%
from stu-
dents
No signs After first
10-15 min,
at 68% from
students
After first
30 min, at
64% from
students
Yawns Only in the
first 15 min
(9% of stu-
dents)
No yawns Appeared at
30% of stu-
dents, more
than once
Appeared at
25% of stu-
dents, more
than once
Unfocused
eye look
Only in
the first
10-15min,
at 13% of
students
No signs no-
ticed
Appeared to
90% from
students
After 30
min, at 85%
of students
We also performed a text analysis by manually
processing the students’ responses to the open ques-
tions, and the results were congruent with the body
Student Teacher Interaction While Learning Computer Science: Early Results from an Experiment on Undergraduates
213
language that was noticed during the lectures. Most
of the students appreciated the interactive lecture, and
some of them mentioned elements of interactivity: ”I
enjoyed the delivery and the fact that the class was in-
teractive. The presentation gave everything a bit more
structure”. Some answers reflected more the effect,
even mentioning causes that influenced the learning
environment: ”I feel really good at this lab because
the atmosphere is really friendly and open-minded. I
really enjoy it.”.
However, no charm and no teaching method can
overcome the call of nature, in the course that took
place during the lunch period, 20% of them men-
tioned they were hungry: ”I want to learn more
and I’m also hungry..”, we even had a response that
mentioned: ”Really dizzy, hungover from last night
party”. Curiously, there were no such mentions for
the second course (which was held during the same
hours). We assumed based on the shortness of an-
swers that they just decided to provide less informa-
tion.
As for the second part of the experiment, the stu-
dents mentioned that they were bored and missed the
interest, we had short, neutral answers: ”Presented in
a linear way”, ”It was okay”, or little longer answers:
”Monotone, kind of boring, not interactive”. Because
they participated in both courses (same teacher, dif-
ferent teaching styles), they performed a comparison
of the teaching styles, thus offering reliable informa-
tion related to the effect of the teaching style. They
realized the difference and emit conclusions based on
their experience: ”I lost my concentration level in the
middle of the course and I missed the interaction with
the teacher” and even recognized doing completely
something else: ”I disliked the teaching style, at some
points I even realized I completely zoned out and just
worked on other stuff on my laptop, completely ignor-
ing the teacher.” Item classes are detailed in the next
table.
Table 5: Classes of items.
Needs extra
work
”need more time, have to reread, need to learn
more, information was difficult, less clear”
Easy ”easy to understand, easy, understand all, not
overwhelming”
Environment ”less stressed, relaxed atmosphere, monotonous,
boring, attention not drawn ”
Student’s
perception
”entertained, liked, enjoy, surprised, no fear, no
boring” or ”did not like, felt discouraging, not pay
attention”
Student’s
reaction
”waiting for next courses, interested”, ”impact
learning desire”, ”worried about course difficulty”
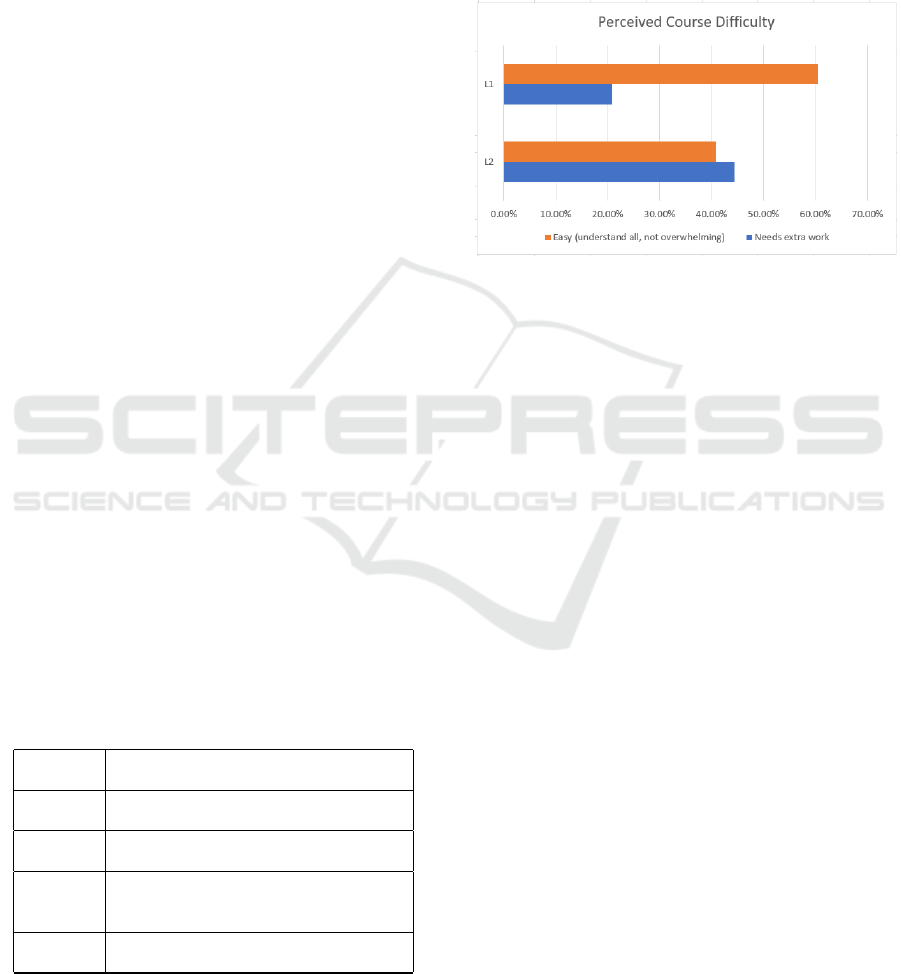
To see how much the teaching style impacted how
the students perceived the difficulty (even if the top-
ics had a similar level of difficulty), we checked how
many students reported the information to be easy for
the first course compared to the second, 60.42% of the
answers considered the information delivered in the
first course to be ”easy” compared to 40.74% of the
answers for the second course. The numbers corre-
late with the number of answers that mentioned: ”ex-
tra work” is needed: 20.83% for the first course com-
pared to 44.44% for the second course: Fig 2.
Figure 2: Perceived Course Difficulty.
Regarding the environment and the course atmo-
sphere, positive characterizations were received for
the first lecture ”relaxed atmosphere, less stressed”,
which appeared in 18.75% of the answers for the first
course. Negative characterizations were received for
the second course ”monotonous, boring” (14.81% of
the total number of answers).41.67% of the answers
for the first course mentioned the students ”liked, en-
joyed, entertained” as 25.93% of the answers from
the second course mentioned ”did not like, felt dis-
couraging”, Fig 3. Moreover, 18.75% of the an-
swers in the first course mentioned that they are ”in-
trigued to learn more” even if they are worried about
the course complexity (6.25% of the answers). In
the second course, 37.04% of answers mentioned that
the teaching style impacted their learning desire: ”in
time I think it would impact my learning desire.”,”The
switch in teaching style felt discouraging compared to
previous labs”, ”It impacted the learning desire quite
hard, making me not paying attention, and lose fo-
cus”.
Based on their answers, we concluded that:
A. The teaching style impacted their attention and as
a consequence, their desire to learn.
B. The teacher’s ability to relate and to create a re-
laxing calm environment is mentioned by 18.75% of
them, so this factor is important for a large majority.
C. There might be a problem with the overall student-
teacher relationship in the high-school cycle as sev-
eral students appreciated the fact that ”the questions
were answered”, ”we could ask without FEAR”, and
”open talk discussion”, all these suggest a more pro-
found problem.
CSEDU 2023 - 15th International Conference on Computer Supported Education
214
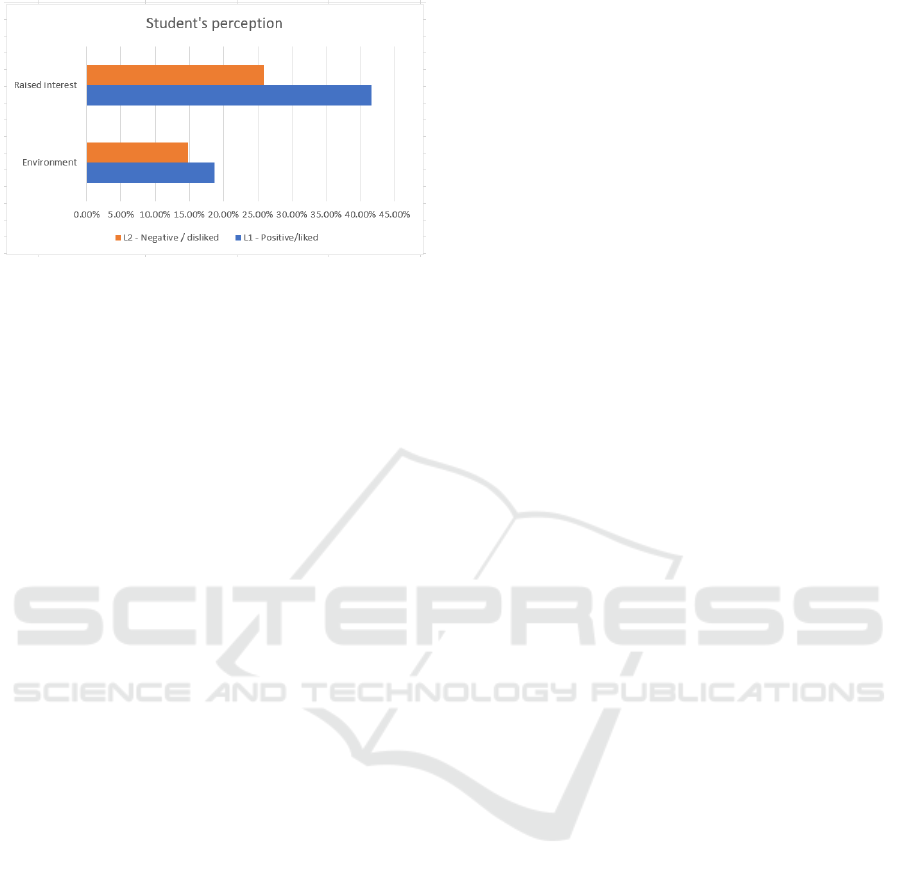
Figure 3: Student’s Perception.
D. No teaching style and no abilities can come against
nature’s call (hungry, sleepiness, and so on).
5 THREATS TO VALIDITY
According to ACM (Association for Computing Ma-
chinery) standards for software engineering research
(Ralph, Paul (ed.), 2021), we were aware that we
need to address possible threats to validity that could
impact the obtained results and we decided to ana-
lyze the following: research ethics, target population
and participant selection, drop-out measures, envi-
ronmental threats, methods to decrease the subjective
form of data processing, hypotheses are missing.
Research ethics: At the beginning of the experi-
ment (at each course) the students were informed that
they will take part in an experiment that consists in
teaching two courses in two different styles, and that
their participation in the survey is optional and anony-
mous. We also informed them about the scope of the
study and how the collected data will be used.
Target population and participant selection: The
groups are formed in alphabetical order based on the
student’s surname, there were 5 aleatory groups se-
lected for the experiment (from a total of 14 groups
of students enrolled in Computer Science - English
line), and all of them were required to participate in
the study. Thus, we assured that the selection was
aleatory.
Drop-out measures: As being optional, a number
of students decided not to participate, and they did
not provide answers; we did not want to use any con-
straint methods, and we could not influence the drop-
out rates.
Environmental threats or inappropriate design for
the conditions under which the experiment took place:
human subjects can be influenced in many ways,
that’s why we wanted to control as many external fac-
tors as possible: we used the same classrooms, the
same times of day, and close dates. We used the same
materials (video projector), and we took into consid-
eration course difficulty (to same a similar grade of
difficulty in terms of new information and complex-
ity). All these factors were taken into consideration so
their perception/opinion was influenced only by dif-
ferent teaching styles.
Data processing: the process used for data pro-
cessing was in concordance with defined processes
and was also used in other computer science papers.
We defined two distinct methods to validate the re-
sults, by observing behavior in a countable manner
(counting the number of yawns) and by having a text
analysis of the received responses.
Hypotheses are missing: We assumed that teach-
ing style and teacher-students relation impacts the
learning desire even in a Computer Science course.
6 CONCLUSIONS AND FUTURE
WORK
We wanted to find out how the students perceive dif-
ferent teaching styles and how the teaching style im-
pacts the learning desire and interest in the course. To
be able to have valid data, we used the same envi-
ronment (classes, course hours, close dates), and the
same students participated and were exposed to both
teaching styles, thus being able to evaluate and com-
pare them. We paid attention to the introduced con-
cepts, they were comparable in terms of number and
complexity. We tried to take into consideration all the
aspects that could influence the outcome and could
become a threat to the validity of the results. We ana-
lyzed the effects and the results of the teaching styles
in two methods - the first one: asking for students’
feedback after each course and the second one: defin-
ing a set of countable behavioral signs (yawns, lay-
ing on the bench). Both methods returned the same
result: students were more attracted to the interac-
tive teaching style and did not show behavioral signs
of boredom. Teacher behavior manager to create a
”calm and relaxing atmosphere” in the first course. In
the second course, when the teaching style was de-
liberately changed, to a non-interactive one, the signs
of boredom could be measured and the students re-
ported a lack of interest, daydreaming, and even doing
a completely different thing. A more rigorous com-
parison by using different natural language process-
ing techniques could be used to show the correlation
between the two performed analyses. We plan to de-
fine a metric to measure more accurately the student’s
interest related to the teaching style and also to repli-
cate the experiment for a whole semester so we can
evaluate the results using exam outcomes. A multi-
Student Teacher Interaction While Learning Computer Science: Early Results from an Experiment on Undergraduates
215

modal affective state monitoring could be designed on
the class level to pervasively measure students’ emo-
tions and mood while learning using wearable devices
(Benta et al., 2015).
Funding. The publication of this article was sup-
ported by the 2022 Development Fund of the Babes¸-
Bolyai University.
REFERENCES
Alshaikh., Z., Tamang., L., and Rus., V. (2021). Ex-
periments with auto-generated socratic dialogue for
source code understanding. In Proceedings of the 13th
International Conference on Computer Supported Ed-
ucation - Volume 2: CSEDU,, pages 35–44. INSTICC,
SciTePress.
Baquerizo, G., M
´
arquez, F., and Tobar, F. (2020). Motiva-
tion in online teaching. 16:316–321.
Benta, K.-I., Cremene, M., and Vaida, M.-F. (2015). A
multimodal affective monitoring tool for mobile learn-
ing. In 2015 14th RoEduNet International Conference
- Networking in Education and Research (RoEduNet
NER), pages 34–38.
Braun, V., Clarke, V., Hayfield, N., and Terry, G. (2019).
Thematic Analysis, pages 843–860. Springer Singa-
pore.
Cruzes, D. S. and Dyba, T. (2011). Recommended steps for
thematic synthesis in software engineering. In 2011
International Symposium on Empirical Software En-
gineering and Measurement, pages 275–284.
El-Abbasy., K., Angelopoulou., A., and Towell., T. (2018).
Measuring the engagement of the learner in a con-
trolled environment using three different biosensors.
In Proceedings of the 10th International Confer-
ence on Computer Supported Education - Volume 1:
CSEDU,, pages 278–284. INSTICC, SciTePress.
Erascu, M. and Mladenovici, V. (2022). Transferring learn-
ing into the workplace: Evaluating a student-centered
learning approach through computer science students’
lens. In Cukurova, M., Rummel, N., Gillet, D.,
McLaren, B. M., and Uhomoibhi, J., editors, Proceed-
ings of the 14th International Conference on Com-
puter Supported Education, CSEDU 2022, Online
Streaming, April 22-24, 2022, Volume 2, pages 442–
449. SCITEPRESS.
George, M. L. (2020). Effective teaching and examination
strategies for undergraduate learning during covid-19
school restrictions. Journal of Educational Technol-
ogy Systems, 49(1):23–48.
Gregory, P., Barroca, L., Taylor, K., Salah, D., and Sharp, H.
(2015). Agile challenges in practice: A thematic anal-
ysis. In Lassenius, C., Dingsøyr, T., and Paasivaara,
M., editors, Agile Processes in Software Engineering
and Extreme Programming, pages 64–80. Springer.
Hazzan, O., Lapidot, T., and Ragonis, N. (2020). Guide to
teaching computer science. Springer.
Kahraman, N. (2022). Middle school boys’ and girls’ career
aspirations in science and mathematics. BO
˘
GAZ
˙
IC¸
˙
I
University Journal of Education, 39:1–30.
Kiger, M. E. and Varpio, L. (2020). Thematic analysis
of qualitative data: Amee guide no. 131. Medical
Teacher, 42(8):846–854.
Liu, M., Gorgievski, M. J., Qi, J., and Paas, F. (2022).
Increasing teaching effectiveness in entrepreneurship
education: Course characteristics and student needs
differences. Learning and Individual Differences,
96:102147.
Makhlouf., J. and Mine., T. (2021). Mining students’ com-
ments to build an automated feedback system. In
Proceedings of the 13th International Conference on
Computer Supported Education - Volume 1: CSEDU,,
pages 15–25. INSTICC, SciTePress.
Motogna., S., Suciu., D., and Molnar., A. (2021). Inves-
tigating student insight in software engineering team
projects. In Proceedings of the 16th International
Conference on Evaluation of Novel Approaches to
Software Engineering - ENASE,, pages 362–371. IN-
STICC, SciTePress.
Petrescu, M. and Sterca, A. (2022). Agile methodology in
online learning and how it can improve communica-
tion. a case study. pages 542–549.
Petrescu, M. A., Borza, D. L., and Suciu, D. M. (2022).
Findings from teaching entrepreneurship to under-
graduate multidisciplinary students: case study. In
Proceedings of the 4th International Workshop on Ed-
ucation through Advanced Software Engineering and
Artificial Intelligence, pages 25–32.
Ralph, Paul (ed.) (2021). ACM Sigsoft Empirical Standards
for Software Engineering Research, version 0.2.0.
Redmond, K., Evans, S., and Sahami, M. (2013). A large-
scale quantitative study of women in computer science
at stanford university. In Proceeding of the 44th ACM
technical symposium on Computer science education,
pages 439–444.
Salas, R. P. (2017). Teaching entrepreneurship in computer
science: Lessons learned. In 2017 IEEE Frontiers in
Education Conference (FIE), pages 1-7. IEEE.
Spieler, B., Oates-Indruchova, L., and Slany, W. (2020). Fe-
male students in computer science education: Under-
standing stereotypes, negative impacts, and positive
motivation. Journal of Women and Minorities in Sci-
ence and Engineering, 26:473–510.
Tichy, W. F., Lukowicz, P., Prechelt, L., and Heinz, E. A.
(1995). Experimental evaluation in computer science:
A quantitative study. Journal of Systems and Software,
28(1):9–18.
Wang, S., Bajwa, N., Tong, R., and Kelly, H. (2021). Tran-
sitioning to Online Teaching, pages 177–188.
CSEDU 2023 - 15th International Conference on Computer Supported Education
216
