
Software Engineering Comments Sentiment Analysis Using LSTM with
Various Padding Sizes
Sanidhya Vijayvargiya
1
, Lov Kumar
2
, Lalita Bhanu Murthy
1
, Sanjay Misra
3
, Aneesh Krishna
4
and Srinivas Padmanabhuni
5
1
BITS-Pilani Hyderabad, India
2
NIT kurukshetra, India
3
Østfold University College, Halden, Norway
4
Curtin University, Australia
5
Testaing.Com, India
A.Krishna@curtin.edu.au
Keywords:
Sentiment Analysis, Deep Learning, Data Imbalance Methods, Feature Selection, Classification Techniques,
Word Embedding.
Abstract:
Sentiment analysis for software engineering(SA4SE) is a research domain with huge potential, with appli-
cations ranging from monitoring the emotional state of developers throughout a project to deciphering user
feedback. There exist two main approaches to sentiment analysis for this purpose: a lexicon-based approach
and a machine learning-based approach. Extensive research has been conducted on the former; hence this
work explores the efficacy of the ML-based approach through an LSTM model for classifying the sentiment
of the text. Three different data sets, StackOverflow, JIRA, and AppReviews, have been used to ensure con-
sistent performance across multiple applications of sentiment analysis. This work aims to analyze how LSTM
models perform sentiment prediction across various kinds of textual content produced in the software engi-
neering industry to improve the predictive ability of the existing state-of-the-art models.
1 INTRODUCTION
Technically, sentiment analysis (SA) is defined as the
natural language processing (NLP) and opinion min-
ing technique used in text analysis to understand if the
given text portrays a positive, neutral, or adverse opin-
ion. Off-the-shelf sentiment analysis tools struggle to
perform efficiently and consistently because certain
words in the text are technical and highly domain-
specific. Sentiment prediction tools also occasionally
fail to address the context-sensitive variations in the
meanings of words, leading to worse performance.
Another contributing factor is that the text often con-
tains copy-pasted content, like code, which, when
subject to sentiment analysis, can lead to misclassi-
fication of the overall sentiment of the text. Nega-
tions are challenging to deal with, proper nouns are
misidentified, and the inability to handle irony and
sarcasm are other issues that make sentiment analy-
sis with high accuracy formidable.
In this research, we attempt to address the issues
mentioned earlier by developing highly reliable senti-
ment analysis models that can be employed in the in-
dustry. The research questions (RQs) used to achieve
the goals are listed below.
• RQ1: What is the optimal padding for the sen-
tences in the text for which the RNN models yield
the best performance?
• RQ2: What structure of LSTM models achieves
the best results for sentiment analysis predictions?
• RQ3: How do the models’ performance trained on
class-balanced data using the different oversam-
pling techniques compare with the versions of the
models trained on the original data?
In this work, we investigate the sentiment predic-
tion potential of various Long Short-Term Memory
(LSTM) models. We provide an in-depth analysis
of how different lengths of sentence padding affect
performance to guarantee that each sentence has the
same length as necessary for LSTM model inputs.
Variations in the structure of the LSTM model are
396
Vijayvargiya, S., Kumar, L., Murthy, L., Misra, S., Krishna, A. and Padmanabhuni, S.
Software Engineering Comments Sentiment Analysis Using LSTM with Various Padding Sizes.
DOI: 10.5220/0011845100003464
In Proceedings of the 18th International Conference on Evaluation of Novel Approaches to Software Engineering (ENASE 2023), pages 396-403
ISBN: 978-989-758-647-7; ISSN: 2184-4895
Copyright
c
2023 by SCITEPRESS – Science and Technology Publications, Lda. Under CC license (CC BY-NC-ND 4.0)

used to determine the best model for sentiment anal-
ysis as well as to improve the performance bench-
marks. Previous works primarily focus on feeding
numerical vectors from pre-trained word embeddings
into the LSTM models. This work modifies the
LSTM architecture to learn the numerical represen-
tations directly in the embedding layer. Unlike earlier
research, in this study, we offer a full statistical analy-
sis to back up the conclusions using statistical testing.
The impact of class-balancing strategies on datasets to
develop more accurate models is looked into, as well
as which class-balancing methodology is best suited
to software engineering. We have used Friedman test
to confirm the observations drawn from the results of
the different models trained. The objective is to prove
which LSTM model is best suited to sentiment anal-
ysis of software engineering artifacts for research or
use in industry.
Sections 2-5 of this work are organized as follows:
A literature survey of several approaches to sentiment
analysis for our desired applications is presented in
Section 2. Section 3 describes the dataset, experimen-
tal setup, and study design, while section 4 makes a
comparative analysis on the research outcome. The
section compares the LSTM models with the RNN
structures as well as class-balancing strategies. Fi-
nally, Section 5 summarizes the research findings and
provides recommendations for further scope in this
area.
2 RELATED WORK
2.1 Sentiment Analysis Techniques
Shen et al.(Shen et al., 2019) analyzed the various fac-
tors of the dataset and study design that contribute
to the insufficient accuracy of sentiment prediction.
The authors noted a jump in accuracy from 0.758 to
0.934 on the binary classification of emotions of com-
ments from the StackOverflow dataset when the mod-
els were trained on a domain-specific dataset as com-
pared to a non-tech dataset. According to the study,
another contributing factor to sub-par results is the
imbalance in the dataset used for training, and almost
all previous evaluation works have suffered from this
flaw.
The performances of four existing sentiment anal-
ysis tools are evaluated in the work done by Novielli
et al. (Novielli et al., 2020). It was reported that
retraining these four sentiment analysis tools did not
produce laudable results when the sources from which
the training and testing samples were retrieved varied.
Hence, a lexicon-based technique is proposed as an
alternative to retraining existing tools. Further, it was
also concluded that upon training supervised tools
with a small balanced training data set (of around one
thousand documents), the models outperformed the
lexicon-based tools. This was however true only if
the training data had a high inter-rater agreement.
When the training and test sets come from mul-
tiple data sources, they discovered that retraining
domain-specific sentiment analysis tools is not a
sound approach. When retraining is not possible ow-
ing to the lack of a gold standard, they offer lexicon-
based techniques, which they advocate anytime re-
training is not feasible due to the lack of a gold stan-
dard. Further research suggested that when super-
vised tools are retrained with a small training dataset
of roughly 1,000 documents, they perform better than
lexicon-based tools, provided the training dataset is
balanced and high inter-rater agreement is detected.
2.2 Lexicon-Based Methods V/S
Machine Learning-Based
Jurado et al. analyzed the sentiment in commits of de-
velopers on GitHub using lexicon-based methods by
first classifying whether the text was objective or sub-
jective and then classifying the text as positive or neg-
ative sentiment (Jurado and Rodriguez, 2015). The
authors used four different lexicons, ANEW, Open-
Finder(OF), SentiStrength(SS), and WN-Affect(WA).
NLTK was used for pre-processing, and SnowBall for
the stemming process. For each issue, the number of
words under the corresponding emotion (anger, dis-
gust, fear, joy, sadness, and surprise) identified by WA
were obtained, while the other lexicons provided a po-
larity analysis of the issue as negative or positive. It
was worth noting that the positive and negative analy-
ses for the polarity obtained with the appropriate lex-
icons had a positive association. This fact introduces
undesired uncertainty and has an impact on the polar-
ity’s possible interpretations. The authors found that
polarity analysis with the specified lexicons was un-
suitable for their corpus but that it was effective for
emotional analysis.
Calefato et al. (Calefato et al., 2018) developed
the model Senti4SD, which was trained and tested on
over 4000 posts manually tagged with emotion polar-
ity from Stack Overflow.
Batra et al. (Batra et al., 2021) attempted to
use transformer-based pre-trained models to achieve
higher performance compared to that of the exist-
ing tools such as SentiCR, SentiStrength-SE, etc.
The research proposed three distinct ways for analyz-
ing BERT-based models: the first method fine-tunes
the already existing pre-trained BERT-based models,
Software Engineering Comments Sentiment Analysis Using LSTM with Various Padding Sizes
397

the second approach uses an ensemble model using
BERT variations, and the third approach employs a
compressed model, also referred to as Distil BERT.
The results showed that the models used by the au-
thors were successful in outperforming the existing
tools by 6-12% on F1 score for all three datasets. Data
augmentation was performed using lexical substitu-
tion and back translation. The experimental results re-
vealed that the methodologies utilized outperformed
the existing tools, with f1-scores of 0.84 and 0.88
for the Jira, and the Stack Overflow datasets, respec-
tively. In the GitHub dataset, the f1-score increased
to 0.93 and 0.91 for positive and negative classes, re-
spectively, with an overall f1-score of 0.92.
2.3 Word Embeddings for Sentiment
Analysis
Qiu et al.(Qiu et al., 2020) classified the pre-trained
models into two groups. The first one attempts to
learn non-contextual word embeddings, as is the case
with GLOVE, W2V, etc. As these embeddings are
non-contextual, they fail to model polysemous words.
The second generation has two families, one being
LSTM-based, and the other being Transformer-based.
Biswas et al.(Biswas et al., 2019) used an LSTM-
based model for classification of the sentiment but
used vectors obtained from pre-trained word embed-
dings such as W2V with Skip-gram. In this work,
we obtain the embeddings using the Embedding layer
in the LSTM model, which learns the embeddings
jointly with the LSTM model. We do not use any pre-
trained embeddings.
3 STUDY DESIGN
3.1 Handling Class Imbalance
As highlighted in Dataset section, class imbalance
in the training dataset is a problem responsible for
lower accuracies in previous research. We em-
ploy different variations of SMOTE to address this
issue. The performance of the models built be-
fore and after accounting for class imbalance are
compared. The various class balancing techniques
used are Synthetic Minority Oversampling Tech-
nique (SMOTE), Support Vectors Synthetic Minority
Oversampling Technique(SVM-SMOTE), and Bor-
derline Synthetic Minority Oversampling Technique
(Borderline-SMOTE). We have also compared the re-
sults of these techniques with original data
3.2 LSTM Model
The sentiment of the text is predicted using three dif-
ferent LSTM models which have structures of the lay-
ers used. In the input, some texts are shorter, while
others are longer. For inputting text to the LSTM
model, all inputs need to be of the same length. This
necessitates the use of padding. For each LSTM
model, four different variations of text are inputted
through the Input layer to initialize the Keras tensor.
The variations in the input are due to the original text
being subjected to different padding of 10, 20, 30, and
40 length. Both the padding and truncating occur at
the end of the input.
Following the input layer in the LSTM model
is the Embedding layer which is crucial to learning
the domain-specific word embeddings along with the
training of the sentiment prediction model. The dense
vector returned by the Embedding layer uses 100 fea-
tures to represent a word. This is then fed to the
LSTM layer. The architecture of an LSTM differs
from that of a traditional feedforward network be-
cause it includes a feedback loop. It also incorporates
a memory cell, which stores past data for a longer pe-
riod of time in order to make an accurate prediction.
Traditional RNNs, which cannot forecast using such a
long series of data and suffer from the problem of van-
ishing gradient, have been improved by LSTM with
its memory cells.
The resulting data is fed into a Dense layer named
FC1 as seen in Figure 1, which has a varying dimen-
sionality of output space for each of the three LSTM
models. This is followed by a Relu-based activation
layer and a drop-out layer (working at a drop-out rate
of 0.5) to curb overfitting. Finally, there is a Dense
layer with an output space of dimensionality of two,
followed by a sigmoid activation layer which gives
the sentiment predictions.
3.3 Dataset
• The Jira dataset consists of 4,000 sentences and
2,000 issues comments from four open-source
(OS) communities: CodeHaus, JBoss, Apache,
and Spring. The contents of this dataset are cate-
gorized into six categories, namely, fear, surprise,
joy, anger, sadness, and love. We re-categorized
anger, sadness as negative, and joy, love as pos-
itive training examples. Surprise, being an am-
biguous emotion was discarded, and along with
fear, both emotions were rarely expressed.
• The StackOverflow dataset has over four thou-
sand posts consisting of questions and answers,
as well as the corresponding comments extracted
ENASE 2023 - 18th International Conference on Evaluation of Novel Approaches to Software Engineering
398

(a) LSTM-1 (b) LSTM-2 (c) LSTM-3
Figure 1: LSTM Different Models.
from StackOverflow. The different classes in the
dataset are positive, negative, and neutral, and are
all reasonably balanced. Both StackOverflow and
Jira are considered the gold standard due to the
well-defined guidelines followed during the label-
ing process.
• AppReviews is a dataset that contains around
three hundred and fifty reviews chosen by Lin et
al.(Lin et al., 2018) from 3,000 provided in (Vil-
larroel et al., 2016), which are manually labeled.
Four categories were considered here: sugges-
tions, requests, bugs, and others.
4 EXPERIMENTAL RESULTS
AND ANALYSIS
In total, 144[3 original datasets * 4(3 class-balanced
+ 1 imbalanced datasets) * 4 different paddings * 3
LSTM models] distinct sentiment prediction models
were built. The performance of these models was
compared using metrics such as accuracy, precision,
recall, and Area under the ROC curve(AUC). For each
performance parameter, statistics such as maximum,
Q3, mean, Q1, and minimum were statistically exam-
ined using box plots for visual representation. Fur-
thermore, the Friedman test was used to support any
conclusions reached. Table 1 shows the predictive
ability of the trained models, which are assessed us-
ing accuracy, precision, recall scores, as well as AUC
values. The StackOverflow dataset has poorer per-
formance metrics than the other two, indicating that
sentiment analysis is a more difficult assignment on
StackOverflow dataset. This is backed up by the fact
that there was a difference of opinion in 18.6% of
the classifications, even when done manually by peo-
ple. To support the findings and draw conclusions,
we have used box-plots for visual comparison of each
performance metric and statistical analysis through
the Friedman test for each ML technique used. The
Friedman test either accepts the Null Hypothesis or
rejects it and accepts the alternative hypothesis. The
significance threshold for the Friedman test is 0.05 for
all the comparisons made.
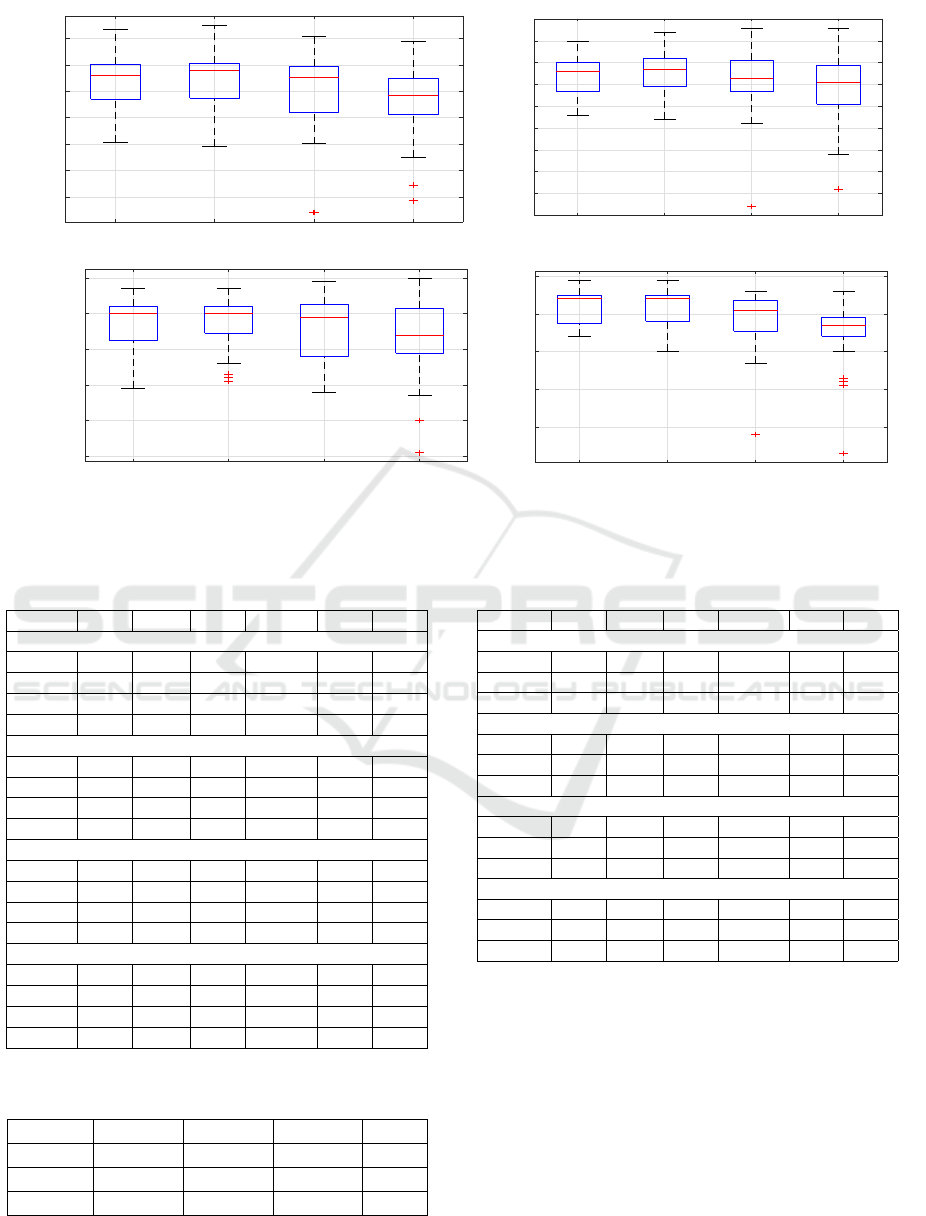
4.1 RQ1: What Is the Optimal Padding
for the Best Performance of the
LSTM Models?
Padding can significantly affect the accuracy of
LSTM models. A padding length of 10 was found to
be optimal across the three datasets, with a padding
length of 20 providing competitive performance as
seen in the box-plots in Figure 2, and their descrip-
tive statistics are mentioned in Table 3. Meanwhile,
the paddings of lengths 30 showed a higher variance
in performance.
As the visual differences in box-plots of paddings
of lengths 10 and 20 are indiscernible, we use the
Friedman test to support the claim that padding of
length 10 is the best, as seen in Table 2. The Fried-
man test is conducted on the AUC values with a null
hypothesis stating, “the different padding lengths do
not cause a significant difference in the performance
of the sentiment analysis models.” Lower the mean
rank from Table 2, better the performance. Thus, we
can conclude that padding of length 10 is ideal with a
mean rank of 1.76.
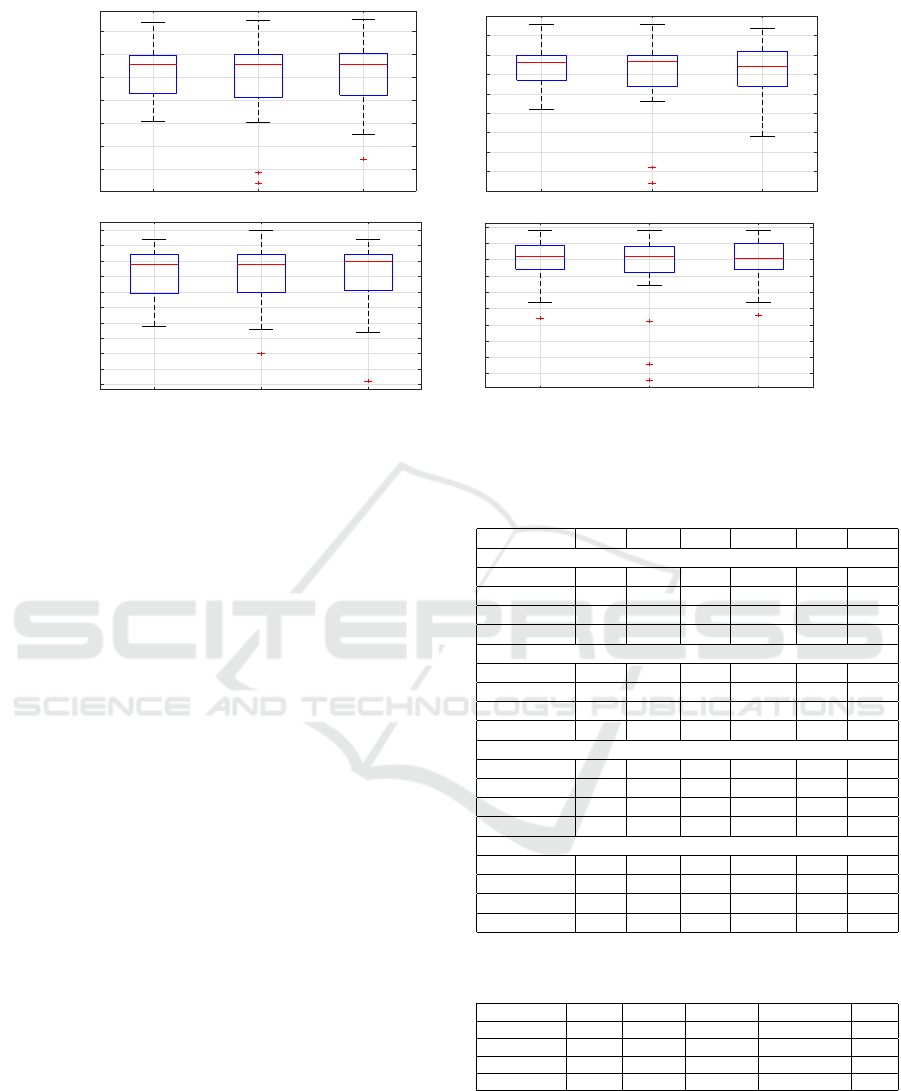
4.2 RQ2: What Structure of LSTM
Models Achieves the Best Results
for Sentiment Analysis Predictions?
The box-plots of the different structures of LSTM
models, shown in Fig 3, show that there is not much
Software Engineering Comments Sentiment Analysis Using LSTM with Various Padding Sizes
399

Table 1: Performance Parameters.
Accuracy Precision Recall AUC
LSTM-1 LSTM-2 LSTM-3 LSTM-1 LSTM-2 LSTM-3 LSTM-1 LSTM-2 LSTM-3 LSTM-1 LSTM-2 LSTM-3
All Metrics (OD): JIRA
PAD-10 96.87 96.65 95.79 0.95 0.95 0.94 0.95 0.95 0.93 0.99 0.98 0.99
PAD-20 96.87 97.30 97.52 0.97 0.96 0.97 0.93 0.95 0.95 0.97 0.99 0.99
PAD-30 92.98 89.31 95.46 0.98 0.78 0.97 0.79 0.92 0.88 0.90 0.92 0.96
All Metrics (OD): AppReviews
PAD-10 87.68 90.03 86.51 0.89 0.90 0.88 0.92 0.94 0.90 0.93 0.95 0.94
PAD-20 87.98 89.74 89.44 0.93 0.91 0.91 0.87 0.92 0.92 0.93 0.94 0.93
PAD-30 87.68 87.68 90.62 0.89 0.89 0.91 0.92 0.91 0.94 0.93 0.91 0.95
All Metrics (OD): StackOverflow
PAD-10 92.07 90.73 91.60 0.94 0.95 0.94 0.97 0.95 0.96 0.88 0.86 0.85
PAD-20 91.20 93.00 91.87 0.95 0.95 0.95 0.95 0.97 0.96 0.88 0.91 0.89
PAD-30 92.13 92.33 91.00 0.94 0.93 0.93 0.97 0.99 0.97 0.77 0.83 0.77
SMOTE: JIRA
PAD-10 90.25 90.17 90.17 0.90 0.89 0.89 0.91 0.91 0.92 0.96 0.96 0.96
PAD-20 91.19 89.86 90.64 0.93 0.90 0.90 0.89 0.90 0.91 0.96 0.96 0.95
PAD-30 89.31 62.03 88.92 0.94 0.57 0.86 0.84 0.98 0.93 0.94 0.58 0.93
SMOTE: AppReviews
PAD-10 87.91 89.81 89.57 0.87 0.89 0.87 0.90 0.91 0.92 0.95 0.95 0.95
PAD-20 90.28 90.52 88.63 0.89 0.91 0.87 0.92 0.91 0.91 0.95 0.96 0.95
PAD-30 87.68 89.81 89.10 0.89 0.87 0.87 0.86 0.94 0.92 0.93 0.93 0.91
SMOTE: StackOverflow
PAD-10 78.67 78.97 80.11 0.80 0.79 0.81 0.77 0.78 0.78 0.85 0.86 0.87
PAD-20 77.00 77.69 74.66 0.79 0.80 0.77 0.73 0.73 0.71 0.82 0.85 0.80
PAD-30 76.17 75.08 75.95 0.76 0.79 0.77 0.76 0.68 0.75 0.84 0.82 0.84
BSMOTE: JIRA
PAD-10 90.64 90.02 90.49 0.90 0.90 0.91 0.91 0.90 0.90 0.96 0.95 0.96
PAD-20 88.99 88.84 88.68 0.89 0.89 0.88 0.89 0.88 0.90 0.94 0.94 0.95
PAD-30 80.27 87.74 85.53 0.84 0.90 0.84 0.75 0.85 0.87 0.87 0.90 0.91
BSMOTE: AppReviews
PAD-10 88.39 87.68 87.20 0.91 0.87 0.87 0.85 0.88 0.88 0.94 0.94 0.93
PAD-20 88.39 90.28 87.68 0.89 0.88 0.86 0.88 0.93 0.90 0.94 0.93 0.94
PAD-30 87.68 89.34 90.28 0.85 0.89 0.93 0.91 0.90 0.87 0.92 0.95 0.95
BSMOTE: StackOverflow
PAD-10 81.58 80.71 79.92 0.83 0.82 0.82 0.80 0.79 0.77 0.89 0.88 0.87
PAD-20 80.41 79.99 80.18 0.83 0.81 0.82 0.76 0.78 0.78 0.87 0.86 0.88
PAD-30 80.98 80.33 78.06 0.84 0.82 0.84 0.77 0.78 0.69 0.86 0.87 0.85
SVMSMOTE: JIRA
PAD-10 88.99 88.52 87.74 0.88 0.88 0.85 0.91 0.89 0.91 0.95 0.95 0.95
PAD-20 88.99 89.39 87.74 0.87 0.89 0.85 0.92 0.90 0.92 0.94 0.95 0.93
PAD-30 87.58 89.70 82.15 0.86 0.88 0.77 0.90 0.92 0.93 0.95 0.94 0.84
SVMSMOTE: AppReviews
PAD-10 85.55 86.73 87.91 0.84 0.86 0.88 0.87 0.88 0.87 0.93 0.94 0.94
PAD-20 89.34 86.97 88.15 0.88 0.86 0.87 0.91 0.89 0.89 0.96 0.94 0.95
PAD-30 88.39 87.68 91.94 0.85 0.90 0.94 0.93 0.85 0.90 0.93 0.94 0.95
SVMSMOTE: StackOverflow
PAD-10 75.42 78.52 78.44 0.79 0.78 0.78 0.69 0.80 0.80 0.84 0.87 0.87
PAD-20 80.60 79.31 80.48 0.80 0.84 0.80 0.82 0.72 0.82 0.87 0.88 0.87
PAD-30 81.16 79.69 81.81 0.83 0.83 0.84 0.78 0.75 0.78 0.88 0.86 0.88
Table 2: AUC: Statistical and Friedman test results of
Padding size.
PAD-10 PAD-20 PAD-30 PAD-40 Rank
PAD-10 1.00 0.81 0.01 0.00 1.76
PAD-20 0.81 1.00 0.01 0.00 1.99
PAD-30 0.01 0.01 1.00 0.01 2.76
PAD-40 0.00 0.00 0.01 1.00 3.49
difference in the performance of the three, and they all
offer high levels of accuracy. The descriptive statis-
tics in Table 5, show that LSTM-3 seems to be the
worst model of the three due to its high variability.
For LSTM-2, the minimum AUC value is an outlier
at 0.53, with the maximum being 0.99 and the mean
AUC value being 0.89. The best visual indicator of
the fact that LSTM-2 marginally outperformed the
rest is the low variability.
The statistical analysis through the means of
Friedman test, conducted on the AUC values, sup-
ports this claim, with the null hypothesis being that
“the different structures of the LSTM models do not
create a significant difference in the sentiment predic-
tion performance.” The results of the Friedman test
can be seen in Table 4. LSTM-2, with a mean rank of
1.94, marginally outperforms the rest. LSTM-1 and
ENASE 2023 - 18th International Conference on Evaluation of Novel Approaches to Software Engineering
400
PAD-10
PAD-20
PAD-30
PAD-40
65
70
75
80
85
90
95
Accuracy
PAD-10
PAD-20
PAD-30
PAD-40
0.55
0.6
0.65
0.7
0.75
0.8
0.85
0.9
0.95
1
Precision
PAD-10
PAD-20
PAD-30
PAD-40
0.5
0.6
0.7
0.8
0.9
1
Recall
PAD-10
PAD-20
PAD-30
PAD-40
0.6
0.7
0.8
0.9
1
AUC
Figure 2: Performance Parameters Boxplots of Padding size.
Table 3: Descriptive Statistics: Precision, Recall, Accuracy,
and AUC: Different Padding Length.
Q1 Mean Min Median Max Q3
Accuracy
PAD-10 83.57 87.17 75.42 88.15 96.87 90.21
PAD-20 83.79 87.49 74.66 88.92 97.52 90.4
PAD-30 81.07 85.65 62.03 87.68 95.46 89.76
PAD-40 80.64 83.38 64.23 84.28 94.49 87.56
Precision
PAD-10 0.84 0.87 0.78 0.88 0.95 0.9
PAD-20 0.85 0.88 0.77 0.89 0.97 0.91
PAD-30 0.84 0.86 0.57 0.87 0.98 0.91
PAD-40 0.81 0.85 0.61 0.86 0.98 0.9
Recall
PAD-10 0.83 0.88 0.69 0.9 0.97 0.92
PAD-20 0.85 0.88 0.71 0.9 0.97 0.92
PAD-30 0.78 0.86 0.68 0.89 0.99 0.93
PAD-40 0.79 0.83 0.51 0.84 1 0.92
AUC
PAD-10 0.88 0.92 0.84 0.94 0.99 0.95
PAD-20 0.88 0.92 0.8 0.94 0.99 0.95
PAD-30 0.86 0.89 0.58 0.91 0.96 0.94
PAD-40 0.84 0.85 0.53 0.87 0.96 0.89
Table 4: AUC: Statistical and Friedman test results of
LSTM Techniques.
LSTM-1 LSTM-2 LSTM-3 Rank
LSTM-1 1.00 0.79 0.98 2.01
LSTM-2 0.79 1.00 0.85 1.94
LSTM-3 0.98 0.85 1.00 2.05
Table 5: Descriptive Statistics: Precision, Recall, Accuracy,
and AUC: LSTM Models.
Q1 Mean Min Median Max Q3
Accuracy
LSTM-1 81.37 86.23 75.42 87.68 96.87 89.8
LSTM-2 80.52 85.58 62.03 87.71 97.3 89.94
LSTM-3 81.12 85.96 67.21 87.74 97.52 90.23
Precision
LSTM-1 0.84 0.87 0.76 0.88 0.98 0.9
LSTM-2 0.82 0.86 0.57 0.89 0.98 0.9
LSTM-3 0.82 0.86 0.69 0.87 0.97 0.91
Recall
LSTM-1 0.8 0.86 0.69 0.89 0.97 0.92
LSTM-2 0.8 0.86 0.6 0.89 1 0.92
LSTM-3 0.81 0.86 0.51 0.9 0.97 0.92
AUC
LSTM-1 0.87 0.9 0.72 0.91 0.99 0.95
LSTM-2 0.86 0.89 0.53 0.91 0.99 0.94
LSTM-3 0.87 0.9 0.73 0.91 0.99 0.95
LSTM-3 had mean ranks equal to 2.01 and 2.05, re-
spectively. Thus, the model with the dimensionality
of output space of the FC1 layer as 128 performs bet-
ter than the other two.
Software Engineering Comments Sentiment Analysis Using LSTM with Various Padding Sizes
401
LSTM1
LSTM2
LSTM3
65
70
75
80
85
90
95
Accuracy
LSTM1
LSTM2
LSTM3
0.55
0.6
0.65
0.7
0.75
0.8
0.85
0.9
0.95
1
Precision
LSTM1
LSTM2
LSTM3
0.5
0.55
0.6
0.65
0.7
0.75
0.8
0.85
0.9
0.95
1
Recall
LSTM1
LSTM2
LSTM3
0.55
0.6
0.65
0.7
0.75
0.8
0.85
0.9
0.95
1
AUC
Figure 3: Performance Parameters Boxplots of LSTM Techniques.
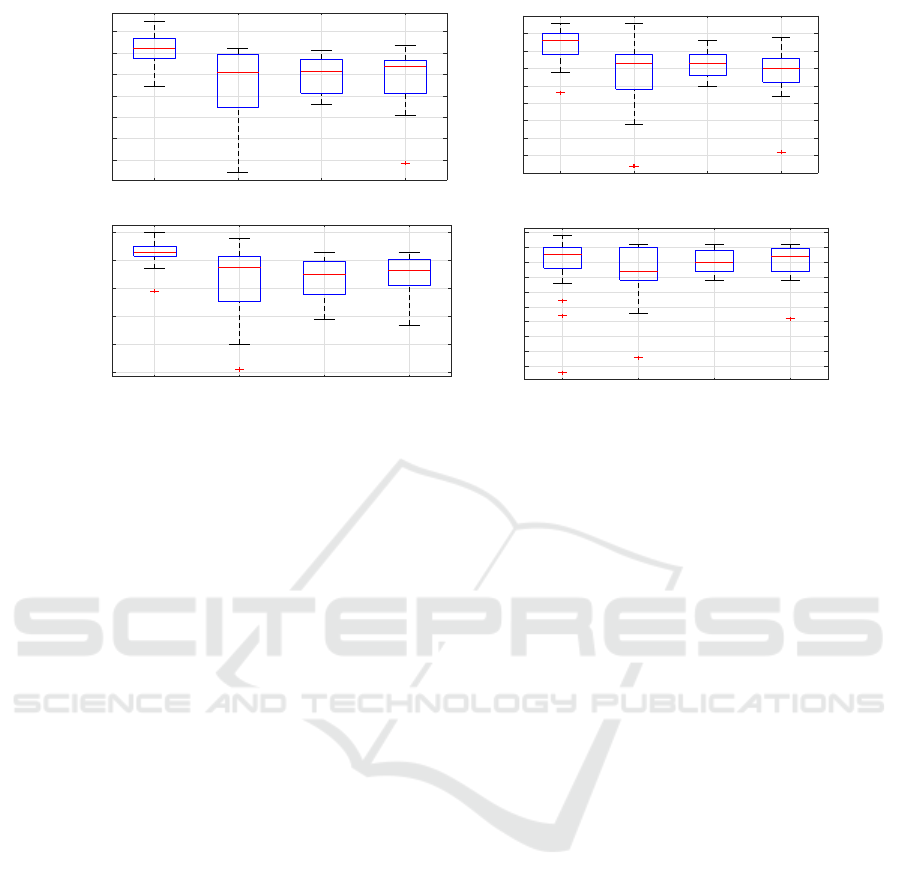
4.3 RQ3: Does Class-Balancing Play a
Significant Role in Improving the
Performance of the Models? If so,
Which Oversampling Technique Is
the Best for SA-E Purposes?
The effect of class balancing can be seen through the
box-plot in Figure 4. The descriptive statistics in term
of Precision, Recall, Accuracy, and AUC, as men-
tioned in Table 6, shows that Class-balancing has re-
gressed the performance of the models with the orig-
inal dataset resulting in the highest accuracy. The
models trained on the original dataset achieve a max-
imum AUC value of 0.99, with a mean of 0.9 AUC
and a minimum of 0.53 AUC being an outlier.
The Friedman test has a null hypothesis that “there
is not a significant difference between the perfor-
mance of sentiment analysis models subjected to
different class-balancing techniques.” The degree of
freedom for this test is three. The mean ranks, as seen
in Table 7, show that while the original dataset, with a
mean rank of 2.24 performs best, the difference in per-
formance is marginal between the balanced and im-
balanced datasets. SVM-SMOTE results in the best
performance out of the various oversampling tech-
niques, with a mean rank of 2.47. Thus, the over-
sampling techniques only regress the performance of
the models, and the best performance is seen using the
original dataset with imbalanced classes.
Table 6: Descriptive Statistics: Precision, Recall, Accuracy,
and AUC: SMOTE.
Q1 Mean Min Median Max Q3
Accuracy
ORGD 88.72 91.25 82.27 91.1 97.52 93.37
SMOTE 77.35 83.07 62.03 85.55 91.19 89.81
BSMOTE 80.62 85.02 78.06 85.66 90.64 88.54
SVMSMOTE 80.68 84.35 64.23 86.85 91.94 88.27
Precision
ORGD 0.89 0.92 0.78 0.93 0.98 0.95
SMOTE 0.79 0.84 0.57 0.87 0.98 0.89
BSMOTE 0.83 0.86 0.8 0.87 0.93 0.89
SVMSMOTE 0.81 0.84 0.61 0.85 0.94 0.88
Recall
ORGD 0.92 0.93 0.79 0.93 1 0.95
SMOTE 0.76 0.83 0.51 0.88 0.98 0.92
BSMOTE 0.78 0.83 0.69 0.85 0.93 0.9
SVMSMOTE 0.81 0.85 0.67 0.87 0.93 0.91
AUC
ORGD 0.88 0.9 0.53 0.93 0.99 0.95
SMOTE 0.84 0.88 0.58 0.87 0.96 0.95
BSMOTE 0.87 0.9 0.84 0.9 0.96 0.94
SVMSMOTE 0.87 0.9 0.71 0.92 0.96 0.95
Table 7: AUC: Statistical and Friedman test results of
LSTM Techniques.
ORGD SMOTE BSMOTE SVMSMOTE Rank
ORGD 1.00 0.18 0.31 0.59 2.24
SMOTE 0.18 1.00 0.29 0.29 2.78
BSMOTE 0.31 0.29 1.00 0.62 2.51
SVMSMOTE 0.59 0.29 0.62 1.00 2.47
5 CONCLUSION
In this study, we explored SA-E using an LSTM-
based approach while testing various structural
changes in the LSTM model itself. This approach to
ENASE 2023 - 18th International Conference on Evaluation of Novel Approaches to Software Engineering
402
ORGD
SMOTE
BSMOTE
SVMSMOTE
65
70
75
80
85
90
95
Accuracy
ORGD
SMOTE
BSMOTE
SVMSMOTE
0.55
0.6
0.65
0.7
0.75
0.8
0.85
0.9
0.95
1
Precision
ORGD
SMOTE
BSMOTE
SVMSMOTE
0.5
0.6
0.7
0.8
0.9
1
Recall
ORGD
SMOTE
BSMOTE
SVMSMOTE
0.55
0.6
0.65
0.7
0.75
0.8
0.85
0.9
0.95
1
AUC
Figure 4: Performance Parameters Boxplots of Data Sampling Techniques.
SA-E has not been researched enough and thus ne-
cessitated this work. Future work can be focused on
finding new applications of SA4SE, and more exten-
sive datasets can be used. The key conclusions of this
work are:
• The padding length of 10 was ideal for getting the
best performance from the LSTM model. LSTM-
2 had the best structure out of the three LSTM
models and can be used for future work.
• Out of the various used oversampling techniques,
SVM-SMOTE gave the best results.
• In case of LSTM-based approach, the imbalanced
dataset yielded the best results, and performance
was regressed upon balancing classes.
ACKNOWLEDGEMENTS
This research is funded by TestAIng Solutions Pvt.
Ltd.
REFERENCES
Batra, H., Punn, N. S., Sonbhadra, S. K., and Agarwal, S.
(2021). Bert-based sentiment analysis: A software
engineering perspective. In Strauss, C., Kotsis, G.,
Tjoa, A. M., and Khalil, I., editors, Database and
Expert Systems Applications, pages 138–148, Cham.
Springer International Publishing.
Biswas, E., Vijay-Shanker, K., and Pollock, L. (2019). Ex-
ploring word embedding techniques to improve senti-
ment analysis of software engineering texts. In 2019
IEEE/ACM 16th International Conference on Mining
Software Repositories (MSR), pages 68–78.
Calefato, F., Lanubile, F., Maiorano, F., and Novielli,
N. (2018). Sentiment polarity detection for soft-
ware development. Empirical Software Engineering,
23(3):1352–1382.
Jurado, F. and Rodriguez, P. (2015). Sentiment analysis in
monitoring software development processes: An ex-
ploratory case study on github’s project issues. Jour-
nal of Systems and Software, 104:82–89.
Lin, B., Zampetti, F., Bavota, G., Di Penta, M., Lanza, M.,
and Oliveto, R. (2018). Sentiment analysis for soft-
ware engineering: How far can we go? In Proceed-
ings of the 40th international conference on software
engineering, pages 94–104.
Novielli, N., Calefato, F., Dongiovanni, D., Girardi, D., and
Lanubile, F. (2020). Can We Use SE-Specific Sen-
timent Analysis Tools in a Cross-Platform Setting?,
page 158–168. Association for Computing Machin-
ery, New York, NY, USA.
Qiu, X., Sun, T., Xu, Y., Shao, Y., Dai, N., and Huang,
X. (2020). Pre-trained models for natural language
processing: A survey. Science China Technological
Sciences, 63(10):1872–1897.
Shen, J., Baysal, O., and Shafiq, M. O. (2019). Evaluating
the performance of machine learning sentiment analy-
sis algorithms in software engineering. In 2019 IEEE
Intl Conf on Dependable, Autonomic and Secure
Computing, Intl Conf on Pervasive Intelligence and
Computing, Intl Conf on Cloud and Big Data Com-
puting, Intl Conf on Cyber Science and Technology
Congress (DASC/PiCom/CBDCom/CyberSciTech),
pages 1023–1030.
Villarroel, L., Bavota, G., Russo, B., Oliveto, R., and
Di Penta, M. (2016). Release planning of mobile apps
based on user reviews. In 2016 IEEE/ACM 38th Inter-
national Conference on Software Engineering (ICSE),
pages 14–24. IEEE.
Software Engineering Comments Sentiment Analysis Using LSTM with Various Padding Sizes
403
