
When Should We Report the Traffic Jams of Today? A Case Study on a
Swiss Highway Using Graph Neural Networks and Expert Knowledge
Jhonny Pincay
1,2 a
, Ana O
˜
na
3,4 b
, and Damian Nomura
1
1
Viasuisse AG, Zentralstrasse 115, Biel, Switzerland
2
Pontificia Universidad Cat
´
olica del Ecuador, Avenida 12 de Octubre 1076 y Roca, Quito, Ecuador
3
Swiss Paraplegic Research, Guido A. Z
¨
ach, Nottwil, Switzerland
4
Department of Health Sciences and Medicine, University of Lucerne, Lucerne, Switzerland
Keywords:
Speed Prediction, Graph Neural Networks, Transportation, Smart Logistics, PyTorch Geometric.
Abstract:
This case study manuscript details the conception and implementation of an artifact that uses floating car
data to forecast average speeds on a segment of a Swiss national road. To consider the spatial and temporal
dependencies when performing the predictions, the studied segment was modeled as a graph and as a time
series problem. Subsequently, to obtain a prediction model, the data collected over a month and augmented
to simulate the behavior during summer were used as the input to train a Graph Neural Network. After the
evaluation of the results it was concluded that despite the considerable differences between the forecasted
values and the reality, it was possible to perform such an implementation with limited data and resources.
Moreover, a handful of traffic reporters still considered the results appropriate, and suitable.
1 INTRODUCTION
The definition of traffic congestion has different
shades. It can be explained in terms of demand capac-
ity, travel time delay, and cost (Aftabuzzaman, 2007).
With demand capacity it is understood that travel de-
mand exceeds the capacity of a road; from the per-
spective of travel time delay, traffic congestion means
that the time needed to reach a destination is higher
than the incurred under free-flow travel conditions;
lastly, from the cost-related perspective, it is implied
that the actual need of resources to go from one place
to another is incremented. Regardless of the defini-
tion that one adopts, one thing they have in common is
their consequences: a considerable increase in travel
time and required resources.
Nowadays, traffic analysis and forecasting are a
very relevant topic since it impacts not only citizens
commuting or going on holiday but also the logistic
planning of services. For companies, estimating the
effects of traffic congestion on their supply chain has
become critical to keep their operational costs low and
to ensure the ever-growing demand for just-in-time
a
https://orcid.org/0000-0003-2045-8820
b
https://orcid.org/0000-0002-7428-4574
delivery Pincay et al. (2020). Such facts have driven
a growing interest in the field of traffic modeling not
only from researchers but also from practitioners.
Furthermore, the availability of more data as well
as the development of methods to process larger
amounts of information have eased the development
of systems able to provide travel time information to
commuters and carriers. Usual data sources used for
traffic analysis include sensors (e.g., traffic counters
and loop detectors), on-site collected data, and float-
ing car data (FCD) recorded from global positioning
systems (GPS) devices (Mori et al., 2015; Zhou et al.,
2012).
The usage of FCD for traffic and travel time mod-
eling has been steadily increasing since it is a large
and affordable source of information. The methods
used to analyze and process FCD found in the liter-
ature include machine learning, fuzzy-based, proba-
bilistic, and deep learning-based methods. Despite
the satisfactory results that they offer, they require
vast amounts of data and the availability of enough
computational resources (Pincay et al., 2020; Zhu
et al., 2020).
This manuscript presents the method and out-
comes of a case study whose goal is to obtain a daily
prediction of speed on a road segment of one of the
150
Pincay, J., Oña, A. and Nomura, D.
When Should We Report the Traffic Jams of Today? A Case Study on a Swiss Highway Using Graph Neural Networks and Expert Knowledge.
DOI: 10.5220/0011846900003473
In Proceedings of the 9th International Conference on Geographical Information Systems Theory, Applications and Management (GISTAM 2023), pages 150-158
ISBN: 978-989-758-649-1; ISSN: 2184-500X
Copyright
c
2023 by SCITEPRESS – Science and Technology Publications, Lda. Under CC license (CC BY-NC-ND 4.0)

main highways of Switzerland. To that end, an artifact
following the principles of design science research
in conjunction with a transdisciplinary approach was
conceptualized. For the implementation of the arti-
fact, FCD provided by the Here Developer platform
1
was processed and methods based on a Graph Neural
Network (GNNs) were applied. Furthermore, traffic
experts were included in all the stages of the develop-
ment of the project.
This article is structured as follows: Section 2 in-
troduces the concepts and related works on which this
initiative is grounded. Then, the methods followed in
the design of the artifact are described in Section 3.
Section 4 presents the results of the implementation
of the project. Lastly, Section 5 closes the curtains of
this research effort with a summary and concluding
remarks.
2 THEORETICAL BACKGROUND
This section introduces the theories and concepts used
for the foundation of this research effort. Related
work is also examined.
2.1 Traffic and Speed Prediction
According to Lin et al. (2005), the main components
of a road traffic environment are humans, vehicles,
and facilities (e.g., signaling, roads and streets). In
this context, the facilities constitute the supply, and
humans and vehicles are the traffic demand.
In regards to road traffic, it can be classified into
two states: congested/jammed and uncongested/free
flow (Treiber and Kesting, 2013). There are several
traffic characteristics or variables that enable identi-
fying the traffic in any of these two states. These
variables are known as traffic state variables, being
the most relevant the flow, vehicle density, and speed
(Pincay et al., 2020).
Traffic and speed forecasting has been studied
mainly through knowledge-driven and data-driven
approaches. Knowledge-driven methods implement
queueing theory and perform simulations about the
user behavior in traffic; data-driven initiatives focus
on the study of time series to enable the implementa-
tion of Auto-Regressive Integrated Moving Average
(ARIMA) models for instance (Li et al., 2017).
Although ARIMA models remain popular they
work only under stationary situations, which in traf-
fic, is not always true. Thus, most recent efforts are
directed towards designing and implementing neural
1
https://developer.here.com/
network and deep learning-based methods, as a way
of considering temporal and spatial structures in the
definition of more reliable and accurate traffic predic-
tion models.
2.2 Artificial Neural Networks and
Deep Learning
Artificial Neural Networks (ANN) or simply neural
networks were conceived as a way of taking to the
computational world how the human brain works: nu-
merous neurons are interconnected and together they
process information (Wang, 2003). They had proven
to be useful and efficient to solve tasks where per-
forming inferences from previous data are required.
Current applications of ANNs include image segmen-
tation, pattern recognition, face recognition, and pre-
diction tasks, among others (Abiodun et al., 2018).
A special type of ANN is the deep neural network.
The main difference with traditional ANNs is that
deep neural networks are composed of a large num-
ber of layers. Current research is directed towards
extending deep learning methods with approaches
based on graph data aiming to consider the interac-
tion between agents in the definition of prediction
models. Such networks are known as Graph Neural
Networks (GNNs) and their study is called geometric
deep learning (Wu et al., 2020). There is a plethora
of architecture definitions of GNNs; authors Wu et al.
(2020) proposed a taxonomy to classify them: Recur-
rent Graph Neural Networks (RecGNNs), Convolu-
tional Graph Neural Networks (ConvGNNs), Graph
Autoencoders (GAEs), and Spatial-Temporal Graph
Neural Networks (STGNNs).
Circulation on roads can be represented as a
graph. For instance, locations along the way consti-
tute the nodes and the weight of the edges correspond
to the distance between places. The assumption that
the circulation in a certain location at a certain time
influences its neighboring places can also be made.
Under this definition, the problem of forecasting the
average speed over time based on GNNs is possi-
ble. The specific type of neural network that enables
such reasoning is named Temporal Graph Convolu-
tional Network (T-GCN). They capture both spatial
and temporal dependencies among time series. This
characteristic makes this type of ANN suitable for a
broad range of spatiotemporal forecasting tasks (Bai
et al., 2021).
2.3 Related Works
Previous publications dealing with the task of predict-
ing vehicle speeds on the roads through GNNs are
When Should We Report the Traffic Jams of Today? A Case Study on a Swiss Highway Using Graph Neural Networks and Expert
Knowledge
151
presented in this section.
Guo et al. (2019) proposed an attention-based
spatial-temporal GNN to capture the dynamic spatio
and temporal properties of traffic data simultaneously.
According to the reported results, the method showed
a superior accuracy than others used for traffic-related
problems such as the ARIMA and Long short-term
memory (LSTM). However, their solution was yet to
be proved in larger-scale experiments.
Researchers Yu et al. (2017) proposed a deep
learning framework implemented through the training
of Spatio-Temporal Graph Convolutional Networks
(STGCN). After conducting simulations on two real-
life datasets they found that formulating the problem
of traffic and average speed forecasting as a graph
and convolutional structures enabled faster training
with fewer parameters than other state-of-the-art ap-
proaches. Nevertheless, their framework needed fur-
ther optimizations in its network structure to enable
its application in large-scale industries.
Another initiative is by Li et al. (2017). They at-
tempted to incorporate the spatial and temporal de-
pendencies in traffic flow using Diffusion Convo-
lutional Recurrent Neural Network (DCRNN). The
studied segments were modeled as a graph, where the
nodes corresponded to the speed measuring stations
and the weight of the edges was the distance between
the nodes. The diffusional nature architecture of the
neural network enabled us to consider the effect of
traffic over space and time to improve the results of
the predicted speeds.
Lastly, Bai et al. (2021) proposed to use an Atten-
tion Temporal Graph Convolutional Network (A3T-
GCN) as a means to model the short-time trend in
time series by using Gated Recurrent Units (GRU)
and a graph convolutional network to consider the
spatial dependencies according to the topology of the
road network. An attention mechanism was intro-
duced to fine-tune the importance of different time
points to improve prediction accuracy. The experi-
mental results in real-world datasets demonstrated the
effectiveness and robustness of the proposed method.
In contrast to the precedent work, this research
effort presents the results of a transdisciplinary case
study of speed predictions for traffic using floating
car data collected over a month from one segment
of one of the most important highways of Switzer-
land, augmented through statistical methods to sim-
ulate the behavior during summer, and used to train
a GNN network implemented in Python. The goal
is to demonstrate how adequate results can be ob-
tained with limited computational resources, with rel-
atively low amounts of data, and by incorporating ex-
pert knowledge in the design of the solution.
3 METHODOLOGY AND USE
CASE
The development of this case study were guided by
the principles of the design science research for infor-
mation systems methodology with a transdisciplinary
approach (i.e., incorporating practical experiences
into the solution process (Hadorn et al., 2008)). This
research methodology was selected because its ap-
plication entails the development of an artifact while
extending existing knowledge (Hevner and Chatter-
jee, 2010) and since this project was realized in a
conjoined effort between academia and an industrial
practitioner namely Viasuisse AG
2
.
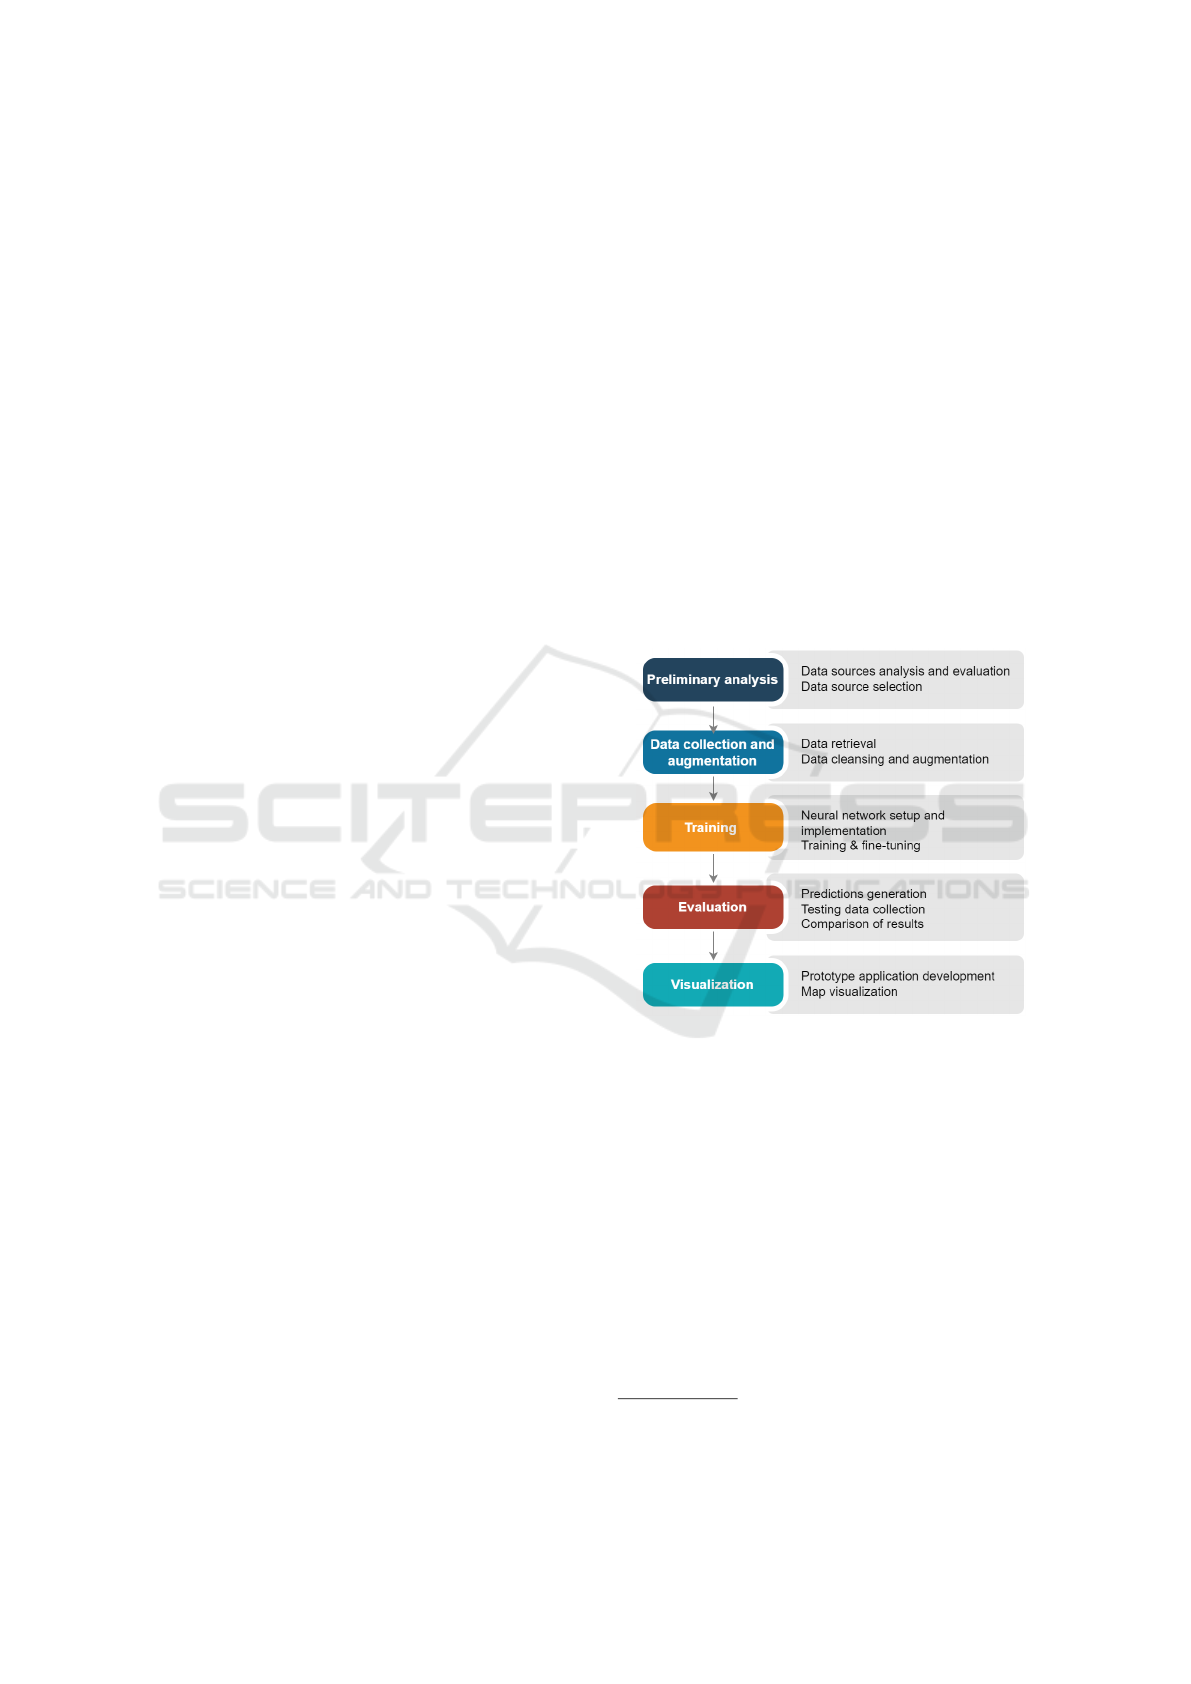
Five main phases encompassed the execution of
this study: i) preliminary analysis, ii) data collection
and augmentation; iii) training; iv) evaluation; and,
v) visualization. Figure 1 depicts these phases and
intermediate steps.
Figure 1: Methodology followed in the research project.
3.1 Preliminary Analysis
Selecting a suitable data source for the prediction
tasks is crucial. Before starting the development of
this project, different data sources that record infor-
mation about traffic flow in Switzerland were evalu-
ated:
• Real-Time Data from Road Traffic Counters: The
open data platform for the mobility of Switzer-
land
3
offers real-time data from traffic sensors de-
ployed through the main roads and highways of
the country. The recorded data corresponds to the
2
https://viasuisse.ch/
3
https://opentransportdata.swiss/en/
GISTAM 2023 - 9th International Conference on Geographical Information Systems Theory, Applications and Management
152

average speed of vehicles that passed near the lo-
cation of the sensor in the previous minute.
Aiming to evaluate the quality of the retrieved
data, points of interest from the entire network
were selected based on the location of traffic cam-
eras. Access to those cameras was granted by our
partner. After performing several observations of
what was happening and reality and the data that
was being retrieved, the researchers came to the
conclusion that although this source offers data
with fine granularity and is well documented, the
results were not reliable enough to define a train-
ing set that meets the goals of this case study.
• Traffic Message Channel-Based Records: Traffic
messages delivered through the Traffic Message
Channel (TMC) technology (Gao and Wen, 2007)
and processed by our partner company were also
studied. Such messages record a variety of inci-
dents that may cause traffic anomalies (e.g., traf-
fic congestion, accidents, and road works) and
they are reported by traffic monitoring responsi-
ble (e.g., road police and municipalities).
This data source however recorded the duration
of traffic anomalies and not the speed of the cir-
culating vehicles, and thus, it was not suitable to
reach the objectives of this work. Nevertheless,
the TMC technology encodes points of interest
over the highways in the form of a location code
list expressed in the standard ISO 14819-3 (Arco
et al., 2017). For instance, the A1 highway is com-
posed of 151 locations (as per version 7 of the
Swiss location code table) and each of them has
a unique identifier (e.g., the location Niederbipp
is identified by the location code 10256). The ex-
istence of such location codes helped in the def-
inition of points of interest and to understand the
traffic flow over the Swiss highways.
• Floating Car Data from Here WeGo: Here
WeGo
4
is a navigation service operated by HERE
Technologies that offers among others traffic and
location services. Through an API for develop-
ers, HERE offers traffic flow data aggregated by
location; this data contains information about the
average speed and the tendency of traffic jams.
Moreover, some tests were conducted to estimate
the quality of this data source. The tests consisted
of traversing a segment of interest and comparing
what was happening while in a car and what the
data being retrieved was showing. It was deter-
mined then that the average speed provided by the
API was close to reality. Considering this fact and
4
https://wego.here.com/
also that the speed can be aggregated by TMC lo-
cation codes, the authors decided to use this data
source to build our speed prediction artifact.
3.2 Data Collection and Augmentation
With the selection of the data source, it was possible
to proceed with the data collection.
Firstly, a segment of interest was defined. To that
effect, discussions with traffic reporters (part of our
partner company) were held. The goal of defining a
segment of interest in this way is to later use the ex-
pertise of the reporters to corroborate the results of the
speed predictions. The selected segment was part of
the A1 highway, which traditionally is the one with
the highest amount of traffic hours every year; the
segment had a length of 50Km and encompassed 24
locations from Verzweigung H
¨
arkingen (TMC Loca-
tion code 10041) until W
¨
urenlos (TMC Location code
11211).
A script written in the programming language
Python was deployed on a server to retrieve the traffic
flow data. The data was retrieved every 5 minutes dur-
ing May of 2022 and for 30 days. The extracted data
contained among other fields the timestamp, TMC lo-
cation code, location name, and average speed.
Furthermore, since one month of data was not
enough, the collected data was augmented to simu-
late a database of readings for the whole summer. To
that end, the average of the speeds grouped by times-
tamp, location, and direction was computed and used
to simulate the values for June, July, and August. The
values were selected from a uniform distribution on
the interval from a minimum value of 93% and a max-
imum 103% of the observed average speed.
3.3 Training
Once the data was available, the training stage took
place. The goal of the training is to predict the future
traffic average speed considering previously observed
traffic flow from N correlated observed locations on
the selected highway segment. In a similar manner,
as proposed by Li et al. (2017), the monitored loca-
tions can be represented as a weighted directed graph
G = (V , E, W )) where V corresponds to the set of
nodes (the observed locations), E denotes the set of
edges, and W ∈ R
N×N
corresponds to a weighted ad-
jacency matrix denoting the proximity of the nodes.
Furthermore, the training stage consisted of two
main steps: Neural network setup & Implementation,
and Training & fine-tuning of parameters. Details are
presented below:
When Should We Report the Traffic Jams of Today? A Case Study on a Swiss Highway Using Graph Neural Networks and Expert
Knowledge
153

Figure 2: Architecture of the A3T-GCN Network. Adapted from Bai et al. (2021).
3.3.1 Neural Network Setup and
Implementation
When modeling the traffic flow with GNNs, the prob-
lem takes the shape of a diffusion process over a di-
rected graph. This abstraction enables the capturing
of the stochastic nature of traffic dynamics (Li et al.,
2017; Cowan and Jonard, 2004). Thus, the locations
of the road segment are modeled into a graph network,
where the traffic state on the different locations is de-
picted as the node attributes (i.e., the average speed at
a certain time and day).
The A3T-GCN architecture proposed by Bai et al.
(2021) was adapted to define the structure of the
model to perform the speed forecasting task. The rea-
son behind this choice was the good results they pre-
sented in their study and related literature and since
our dataset had a similar structure. The characteris-
tics of the A3T-CGN model are described as follows:
• The A3T-GCN is based on the T-GCN but uses
attention.
• For the spatial aggregation a GCN structure is
used. For the temporal aggregation a GRU.
• Historical time series are inputted to the T-GCN
model, then n hidden states h are obtained. These
hidden states cover spatiotemporal characteristics.
• The hidden states are fed into the attention model
to determine a context vector that covers the traffic
variation information: a
t−n
, ..., a
t−1
, a
t
.
• Final results are computed using a fully connected
layer.
Figure 2 illustrates the architecture of the A3T-
GCN model applied.
3.3.2 Training and Fine-Tuning
The original dataset was split into 80% for the train-
ing process and 20% for testing purposes. The hyper-
parameters to define included the learning rate (lr),
epochs, and the number of hidden units.
The Python implemented neural network was
trained using the Adam optimizer with learning rate
annealing. The hyper-parameters were chosen using
the Tree-structured Parzen Estimator (TPE) on the test
set (Bergstra et al., 2011).
The data sample for the training consisted of 24
nodes; each node containing 2 features (speed and
time). Each bucket of data contained 12 timesteps
(12 × 5 min = 60 min). The edges attributes were
defined on the distances between the locations and a
threshold. This threshold was defined with the value
of 4000 (k = 4000), meaning that the effects of low
speeds on a location will have an effect up to the loca-
tions in the following 4000 meters. This distance was
defined after holding meetings and discussions with
traffic experts. Lastly, the neural network was trained
in 30 epochs.
3.4 Evaluation
The evaluation was conducted using 20% of the avail-
able data. The loss and Mean Squared Error (MSE)
were used to define how accurate the trained model
was. Moreover, the prediction for a whole day was
obtained and the predicted average speed of several
locations was compared to what really happened, this
helped us to have a closer-to-reality appreciation of
the results.
The results were then shared with the traffic ex-
perts and contrasted with their day-to-day insights.
3.5 Visualization
The results of the daily predictions were shown
through a web heatmap. Moreover, some insights
about the daily predictions are also depicted.
4 RESULTS
This section presents the artifact’s implementation re-
sults built upon the methods explained in Section 3.
A script written in Python was used to perform
the data collection and another one was written in R
GISTAM 2023 - 9th International Conference on Geographical Information Systems Theory, Applications and Management
154
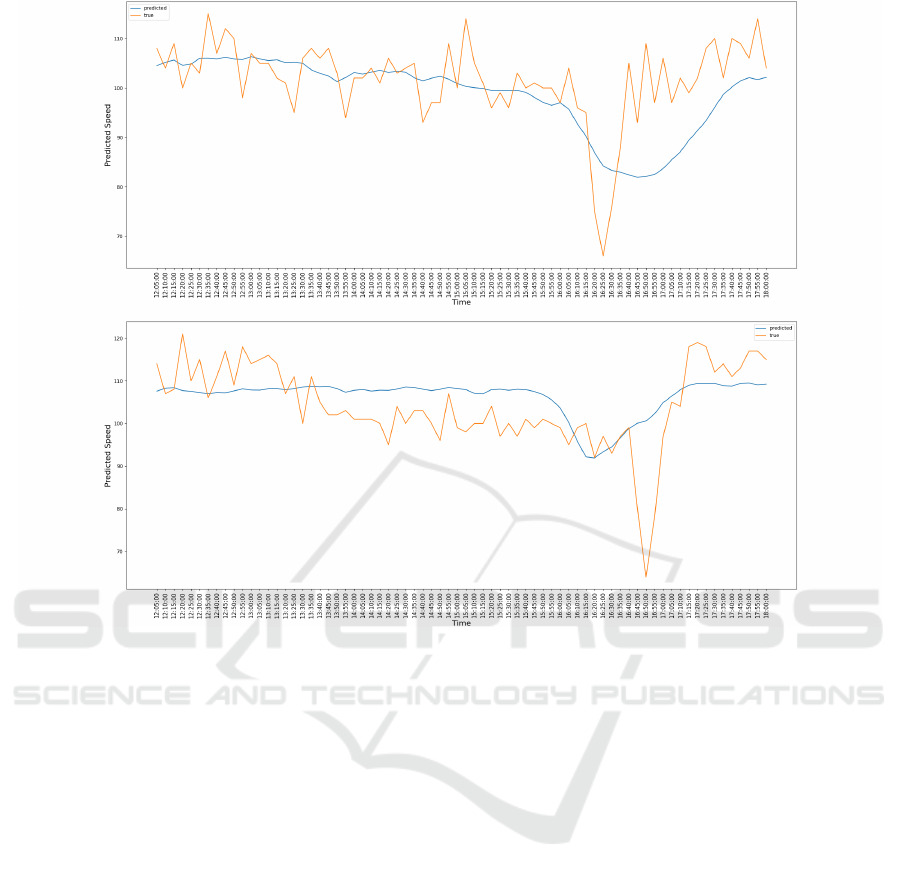
Figure 3: Predicted and real speeds for the locations of K
¨
olliken S
¨
ud (top) and Verzweigung H
¨
arkingen (bottom) for the 1st.
of September 2022 between 10H00 and 18H00.
to augment and simulate the data. The neural net-
work model was implemented with the deep learning
framework PyTorch Geometric Temporal. Intro-
duced by Rozemberczki et al. (2021), this framework
was implemented with the existing libraries of the
PyTorch ecosystem, temporal snapshot generators for
batching, and streamlined neural network layer defi-
nitions. The library Folium was used to create the
heatmap presenting the results.
4.0.1 Dataset Conformation
The data source used to conform the dataset was the
FCD obtained from HERE; moreover, the data were
collected during May 2022 and augmented to simu-
late readings for the whole summer of 2022 (until Au-
gust 2022). Furthermore, only the average speeds in
the direction west to east were taken into considera-
tion.
The final dataset used for the training and the test-
ing was composed of approximately 211 800 records,
which registered the timestamp, TMC location name,
code, and average speed at the moment of the read-
ing. To construct the sensor graph, the distance be-
tween the 24 studied locations was computed and
used to build an adjacency matrix applying a thresh-
olded Gaussian kernel (Shuman et al., 2013).
4.1 Training and Validation
The training was conducted on a Windows computer
with 32 GB of RAM memory and with an Intel (R)
Core i7 processor.
A learning rate lr = 0.001 and 30 training epochs
were set for the training process. During the first
training epoch, an MSE of 1.0497 was obtained; after
all the training epochs were executed, the MSE was
0.327 and 0.2947 on the testing set.
The speed forecast for the 1st. of September
2022 between 10H00 and 18H00 was later obtained.
These values were used to compare with the actual
records of the day. Two locations were selected to
that end: K
¨
olliken S
¨
ud und Verzweigung H
¨
arkingen.
These locations were selected after consulting with
the traffic professionals; the location K
¨
olliken S
¨
ud is a
rather straight sub-segment whereas the Verzweigung
H
¨
arkingen is rather a complex road junction where
multiple roads meet.
When Should We Report the Traffic Jams of Today? A Case Study on a Swiss Highway Using Graph Neural Networks and Expert
Knowledge
155
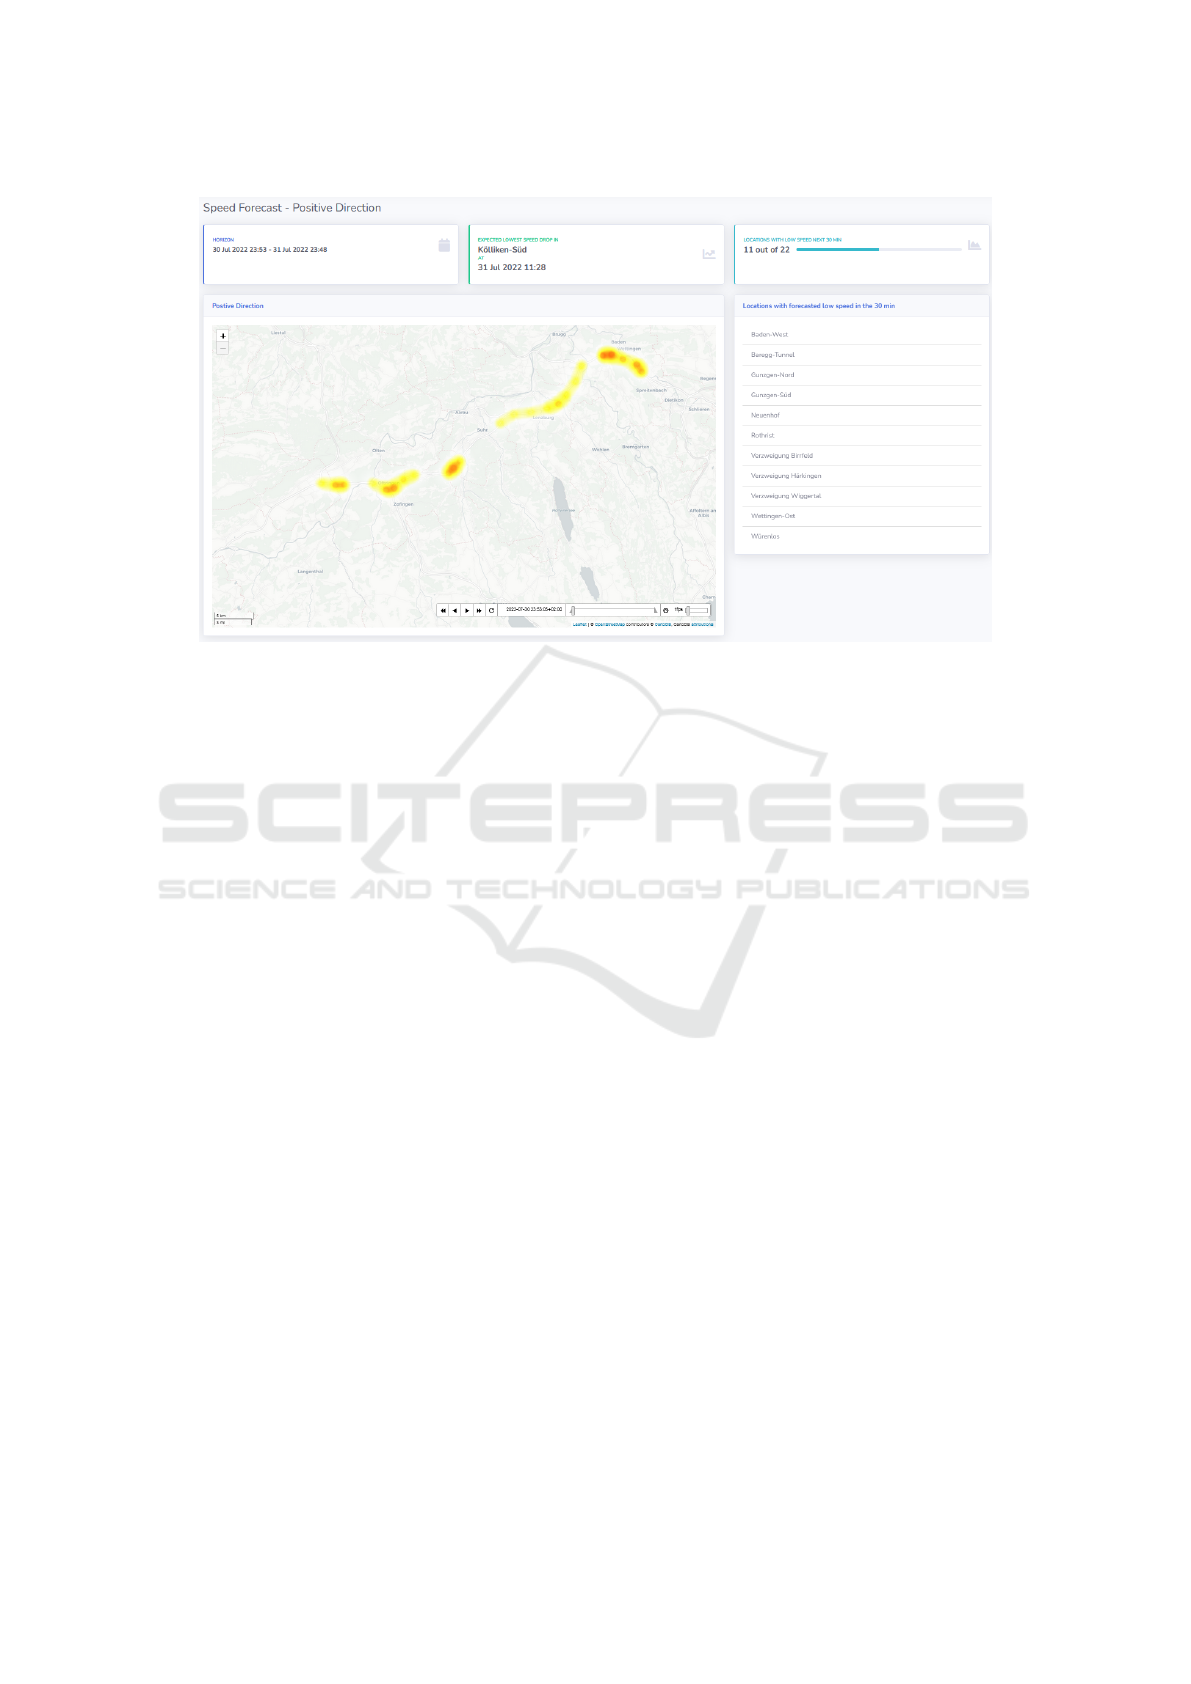
Figure 4: Example of the visualization results for the traffic prediction on the studied segment; besides a heatmap depicting
the low speeds, some stats are also provided.
These results are depicted in Figure 3; for
K
¨
olliken S
¨
ud (see Fig. 3 top), the predictions follow
very well the tendency of the real values, which can
be interpreted as encouraging results. On the other
hand, in the outcome for the Verzweigung H
¨
arkingen
(see Fig. 3 bottom), the differences are more evident.
To get an expert opinion about the obtained pre-
dictions, discussions with traffic experts working at
our partner company were held. From their point of
view, the results are promising and they reflect what
they observe on a regular Thursday. Moreover, for
their daily activities, when they have to report traffic
incidents they always have to verify on-road cameras
and decide whether an incident is going to be solved
soon or if it is going to last for a longer period. “Hav-
ing such daily predictions will help us to make our job
more effectively” manifested one of the participants
in the discussion; “Even if the predicted speeds differ
from the real values, having an indicator of an ap-
proximate time when a sudden reduction could hap-
pen is also useful” manifested another.
In light of these results, one can say that despite
the 0.2947% MSE on the validation set seeming high
at first glance, the predicted speed values can still be
practical when assisting traffic reporters to report in-
cidents in a faster and more agile manner.
4.1.1 Visualization
A dashboard-like web interface was implemented to
present the results of the speed predictions. The in-
terface had two main parts: a heatmap and some
indicators. The heatmap had the goal of depicting
the locations with the lower speeds during the day
whereas the indicators were designed to provide a bet-
ter overview of the locations where the low speeds
were predicted and the times when this was happen-
ing. Figure 4 presents an example of the described.
Moreover, the prototype was intended to help traffic
reporters in their duties and not drivers on the road.
Therefore, a richer interface was preferred instead of
a simplified one.
5 SUMMARY AND
CONCLUSIONS
Nowadays, convenience is the currency to buy users’
attention and thus decides whether a service remains
relevant or not. As Kano Noriaki stated, over time de-
lightful innovation becomes another basic need. As a
result, the expectations of users grow accordingly to
the technical standards set by the industry. Providers
of traffic information itself are facing demands for
more and more precise data to route from A to B.
It has not been long ago that general information
about major traffic jams on national highways broad-
casted in 30-minute intervals over radio channels was
enough.
This transdisciplinary research/applied project
presents the results of a case study that attempts
to demonstrate how speed predictions on highways
can be obtained without a large amount of data and
GISTAM 2023 - 9th International Conference on Geographical Information Systems Theory, Applications and Management
156

with limited resources but by exploiting deep learning
methods and including experts’ knowledge in the de-
velopment. This project was completed in five stages:
i) preliminary analysis; ii) data collection and aug-
mentation; iii) training; iv) evaluation; and iv) visu-
alization of results. The preliminary analysis allowed
us to identify the most reliable data source to predict
speed on the roads; a collection and cleansing process
was conducted and an augmentation of the data took
place afterward. The overall dataset was conformed
of average speed readings every 5 minutes from May
to August of 2022 of a segment on the A1 motorway
in Switzerland. A training process of a neural network
architecture based on GNNs took place then followed
by an evaluation process based on different metrics
and experts’ opinions. Lastly, the speed predictions
were depicted on a heatmap through a web interface.
The methodology applied and the usage of GNN
models proved to be suitable for the task of forecast-
ing speeds. Although there is still plenty of room
for improvement, it was shown that with a relatively
small amount of data and limited computer resources,
it is still possible to obtain predictions. As expressed
by the traffic experts that analyzed the results pro-
vided, even when these are not as accurate as one
could wish they are still useful to ease the task of
traffic reporting. Aspects such as a gradual or sud-
den change of speed might be an indicator that a
traffic perturbation will occur. Regardless of the re-
lated work, this research project is characterized by its
practical nature, transdisciplinarity, and the real data
used for the implementation. The methods presented
could guide similar studies in which the involvement
of people is key to solving a rather complex problem.
The pressure of meeting expectations multiply in
the logistics branch by the factor of ever-growing
pressure on the prices and thus on the cost a product
is allowed to cause. The supply chain of commodi-
ties has been optimized to a very high extent. Goods
nowadays usually do not rest for a very long time at
a storage facility since storing creates cost. Capac-
ities of trucks and containers are being maxed out
in order to waste as little as possible. At the same
time, the goods need to be delivered just in time, in
order to not cause delays, which are again cost rele-
vant. The demands from users directly, as from in-
dustrial stakeholders, i.e. logistic suppliers, exceed
the capabilities pure and accessible data can provide.
In a hypothetical situation: Even if all the data avail-
able would be accessible for one solution that could
perform the analysis in order to provide such infor-
mation, it would consume way too much energy and
storage space. Ecological ethics would heavily be vi-
olated by predictions for mainly fuel-based vehicles.
From a sustainable business perspective, we are
urged to perform with the same efficiency as the logis-
tic suppliers with their trucks and containers, in terms
of using data. We must find ways to make the most
sense out of data in order not to overproduce sense-
lessly but still provide precise outcomes. The results
of this study might still not have used the most eco-
logically sustainable of methods but it is a first step
taken in the right direction. At the same time, it is
a clear indicator, if not proof, that transdisciplinary
research allows for finding viable solutions more effi-
ciently. We must be aware that business and science
are not two separate silos, but act as chain links. Sci-
ence has no value to humans if it is not made acces-
sible to the greater public. This happens by forming
products. At the very same time, business needs real
innovation in order to prosper. This study shows that
joint forces of both areas are the future of business as
of science.
Future work will focus on gathering more data to
capture seasonality and to improve the models with
the further tuning of parameters and training cycles.
other aspects to be addressed are the inclusion of un-
expected events (e.g., accidents and the presence of
objects or animals on the road) to adjust the predic-
tions. Lastly, the visualization dashboard must be also
improved and enriched with maybe the inclusion of
linguistic summaries (Pincay et al., 2021) as a means
of addressing the uncertainty and imprecision of the
predicted values.
ACKNOWLEDGEMENTS
The authors would like to thank the director of Via-
suisse AG Marc Br
¨
onnimann for supporting this re-
search project as well as Marco De Carli, Michael
Krein, Barbara Roelli, Karin Sch
¨
ar, and Chico Koch
for contributing with their traffic expertise in the def-
inition of aspects of the methodology and evaluation
of the results.
This project has received funding from the Euro-
pean Union’s Horizon 2020 research and innovation
program under the Marie Sklodowska-Curie grant
agreement No 801076, through the SSPH+ Global
Ph.D. Fellowship Program in Public Health Sciences
(GlobalP3HS) of the Swiss School of Public Health.
REFERENCES
Abiodun, O. I., Jantan, A., Omolara, A. E., Dada, K. V.,
Mohamed, N. A., and Arshad, H. (2018). State-of-the-
When Should We Report the Traffic Jams of Today? A Case Study on a Swiss Highway Using Graph Neural Networks and Expert
Knowledge
157

art in artificial neural network applications: A survey.
Heliyon, 4(11):e00938.
Aftabuzzaman, M. (2007). Measuring traffic congestion-
a critical review. In 30th Australasian Transport Re-
search Forum.
Arco, E., Ajmar, A., Arneodo, F., and Boccardo, P. (2017).
An operational framework to integrate traffic message
channel (tmc)in emergency mapping services (ems).
European Journal of Remote Sensing, 50(1):478–495.
Bai, J., Zhu, J., Song, Y., Zhao, L., Hou, Z., Du, R., and Li,
H. (2021). A3t-gcn: Attention temporal graph convo-
lutional network for traffic forecasting. ISPRS Inter-
national Journal of Geo-Information, 10(7):485.
Bergstra, J., Bardenet, R., Bengio, Y., and K
´
egl, B. (2011).
Algorithms for hyper-parameter optimization. Ad-
vances in neural information processing systems, 24.
Cowan, R. and Jonard, N. (2004). Network structure and
the diffusion of knowledge. Journal of economic Dy-
namics and Control, 28(8):1557–1575.
Gao, Y. and Wen, H.-m. (2007). Technique and standard-
ization research of radio data system-traffic message
channel (rds-tmc). Journal of Transportation Systems
Engineering and Information Technology, 3.
Guo, S., Lin, Y., Feng, N., Song, C., and Wan, H. (2019).
Attention based spatial-temporal graph convolutional
networks for traffic flow forecasting. In Proceedings
of the AAAI conference on artificial intelligence, vol-
ume 33, pages 922–929.
Hadorn, G. H., Biber-Klemm, S., Grossenbacher-Mansuy,
W., Hoffmann-Riem, H., Joye, D., Pohl, C., Wies-
mann, U., and Zemp, E. (2008). The emergence of
transdisciplinarity as a form of research. In Handbook
of transdisciplinary research, pages 19–39. Springer.
Hevner, A. and Chatterjee, S. (2010). Design research in
information systems: theory and practice, volume 22.
Springer Science & Business Media.
Li, Y., Yu, R., Shahabi, C., and Liu, Y. (2017). Diffusion
convolutional recurrent neural network: Data-driven
traffic forecasting. arXiv preprint arXiv:1707.01926.
Lin, H.-E., Zito, R., Taylor, M., et al. (2005). A review
of travel-time prediction in transport and logistics. In
Proceedings of the Eastern Asia Society for trans-
portation studies, volume 5, pages 1433–1448.
Mori, U., Mendiburu, A.,
´
Alvarez, M., and Lozano, J. A.
(2015). A review of travel time estimation and fore-
casting for advanced traveller information systems.
Transportmetrica A: Transport Science, 11(2):119–
157.
Pincay, J., Mensah, A. O., Portmann, E., and Ter
´
an, L.
(2020). Forecasting travel times with space partition-
ing methods. In Grueau, C., Laurini, R., and Ragia,
L., editors, Proceedings of the 6th International Con-
ference on Geographical Information Systems The-
ory, Applications and Management, GISTAM 2020,
Prague, Czech Republic, May 7-9, 2020, pages 151–
159. SCITEPRESS.
Pincay, J., Portmann, E., and Ter
´
an, L. (2021). Mining
linguistic summaries in traffic. In B
¨
ack, T., Wag-
ner, C., Garibaldi, J. M., Lam, H. K., Cottrell, M.,
Merelo, J. J., and Warwick, K., editors, Proceedings
of the 13th International Joint Conference on Compu-
tational Intelligence, IJCCI 2021, Online Streaming,
October 25-27, 2021, pages 169–176. SCITEPRESS.
Rozemberczki, B., Scherer, P., He, Y., Panagopoulos, G.,
Riedel, A., Astefanoaei, M., Kiss, O., Beres, F.,
L
´
opez, G., Collignon, N., et al. (2021). Pytorch ge-
ometric temporal: Spatiotemporal signal processing
with neural machine learning models. In Proceedings
of the 30th ACM International Conference on Infor-
mation & Knowledge Management, pages 4564–4573.
Shuman, D. I., Narang, S. K., Frossard, P., Ortega, A., and
Vandergheynst, P. (2013). The emerging field of signal
processing on graphs: Extending high-dimensional
data analysis to networks and other irregular domains.
IEEE signal processing magazine, 30(3):83–98.
Treiber, M. and Kesting, A. (2013). Trajectory and floating-
car data. In Traffic Flow Dynamics, pages 7–12.
Springer.
Wang, S.-C. (2003). Artificial Neural Network, pages 81–
100. Springer US, Boston, MA.
Wu, Z., Pan, S., Chen, F., Long, G., Zhang, C., and Philip,
S. Y. (2020). A comprehensive survey on graph neural
networks. IEEE transactions on neural networks and
learning systems, 32(1):4–24.
Yu, B., Yin, H., and Zhu, Z. (2017). Spatio-temporal
graph convolutional networks: A deep learning
framework for traffic forecasting. arXiv preprint
arXiv:1709.04875.
Zhou, P., Zheng, Y., and Li, M. (2012). How long to wait?:
predicting bus arrival time with mobile phone based
participatory sensing.
Zhu, H., Xie, Y., He, W., Sun, C., Zhu, K., Zhou, G.,
and Ma, N. (2020). A novel traffic flow forecasting
method based on rnn-gcn and brb. Journal of Ad-
vanced Transportation, 2020.
GISTAM 2023 - 9th International Conference on Geographical Information Systems Theory, Applications and Management
158
