
TMBQ-LT: A Student-Facing Learning Tool to Support Time
Management Skills
Ana-Gabriela N
´
u
˜
nez
1 a
, Vanessa Echeverria
2,3 b
, Miguel Zu
˜
niga-Prieto
1 c
, Benito Auria
2
and Tinne De Laet
4 d
1
Department of Computer Science, Universidad de Cuenca, Cuenca, Ecuador
2
Escuela Superior Polit
´
ecnica del Litoral, ESPOL,
Centro de Tecnolog
´
ıas de Informaci
´
on, Guayaquil, Ecuador
3
Monash University, Clayton, VIC, Australia
4
Faculty of Engineering Science Engineering and Science Education Center, KU Leuven, Leuven, Belgium
Keywords:
Time Management, Student-Facing Dashboard, Learning Analytics Dashboard.
Abstract:
To be successful in Higher Education, students must acquire good self-regulation and learning skills. Past
studies have reported that undergraduate students are overconfident in recognizing their self-regulatory strate-
gies. This overconfidence can be detrimental during the first years of their undergraduate program if they are
not properly nurtured. The lack of students’ motivation, self-regulation and time management strategies can
lead to higher rates of drop-out. In this sense, student-facing learning tools can provide timely feedback to
support awareness, strengthen this self-regulation and time management skills, and thus be instrumental for
students in attaining their learning goals. In this paper, we present the TMBQ-LT, a student-facing tool that
consists of 1) a set of questions derived from the Time Management Behavior Questionnaire (TMBQ), 2) a vi-
sualization showing student’s time management (TM) predispositions and 3) tailored recommendations based
on students’ self-reported TM skills. This paper illustrates a case study on the deployment of the TMBQ - LT
by students from three HE institutions and provides recommendations for future implementations and adop-
tion of the tool.
1 INTRODUCTION
To succeed in Higher Education, students must ac-
quire good self-regulation and learning skills. Past
studies have reported that undergraduate students
are overconfident in recognizing their self-regulatory
strategies (Zimmerman, 2008) when they have not ac-
quired a specific skill (Kruger and Dunning, 1999).
This overconfidence in their self-regulation strategies
can be detrimental during the first years of their un-
dergraduate program if they are not properly nurtured.
Current research points out that student’s lack of mo-
tivation, commitment, and self-regulation skills may
increase the risk of drop-out and dissatisfaction with
the learning experience (Heikkil
¨
a and Lonka, 2006),
a
https://orcid.org/0000-0002-4996-0390
b
https://orcid.org/0000-0002-2022-9588
c
https://orcid.org/0000-0001-9369-1813
d
https://orcid.org/0000-0003-0624-3305
which has been exacerbated by the COVID-19 (Ham-
dan et al., 2021).
Self-Regulated Learning (SRL) refers to the cog-
nitive, metacognitive, and motivational factors that
students use to attain and accomplish their goals dur-
ing the learning processes (Zimmerman, 2000). Re-
search has found that SRL strategies, such as goal set-
ting, strategic planning, and time management, are as-
sociated with students’ performance and attainment
of goals (c.f., (Kizilcec et al., 2017)). Therefore,
HE institutions should provide counseling strategies
to foster students’ SRL skills, aiming at improving
their academic performance and learning experience
(Heikkil
¨
a and Lonka, 2006). In this work, we are in-
terested in fostering time management skills, an SRL
sub-construct.
Nurturing students’ time management skills is
time-consuming for different HE stakeholders (i.e.,
teachers, advisors, and counselors). As students pos-
sess different learning competencies, it is hard to
Núñez, A., Echeverria, V., Zuñiga-Prieto, M., Auria, B. and De Laet, T.
TMBQ-LT: A Student-Facing Learning Tool to Support Time Management Skills.
DOI: 10.5220/0011847500003470
In Proceedings of the 15th International Conference on Computer Supported Education (CSEDU 2023) - Volume 1, pages 217-224
ISBN: 978-989-758-641-5; ISSN: 2184-5026
Copyright
c
2023 by SCITEPRESS – Science and Technology Publications, Lda. Under CC license (CC BY-NC-ND 4.0)
217

develop a one-size-fits-all strategy (Ga
ˇ
sevi
´
c et al.,
2016). Learning Analytics (LA) tools may provide a
solution to address the challenge of delivering timely
and tailored feedback at scale (Pardo et al., 2019),
aiming at raising students’ awareness about their reg-
ulation strategies and triggering reflection about their
learning and performance.
According to Winne and Perry (2000), SRL can
be distinguished at component-oriented and process-
oriented levels. The component-oriented level is
defined as students’ attributes or predispositions for
learning, regardless of the learning environment in
which they occur. In contrast, The process-oriented
level is focused on the coordination, control and reg-
ulation of strategies during the learning process. In a
recent literature review (N
´
u
˜
nez et al., 2022), the au-
thors reported that SRL tools often support time man-
agement strategies at the process-oriented level, for
instance, by displaying the time spent when students
interact with a learning platform (e.g.(P
´
erez-
´
Alvarez
et al., 2017)) or by supporting the scheduling and
organization of activities (e.g., (Alario-Hoyos et al.,
2015)). However, to our knowledge, SRL tools that
support time management at a component-oriented
level are limited. This work aims to contribute to
these under-explored tools to support time manage-
ment skills. To this end, we designed and deployed
the TMBQ-LT, a student-facing learning analytics
tool to allow students to 1) assess their time man-
agement skills by filling the Time Management Be-
havior Questionnaire (TMBQ); 2) visualize their time
management predispositions; 3) get tailored feedback
based on their levels of time management predisposi-
tions.
2 RELATED WORK
In Learning Analytics (LA) and Educational Tech-
nology (EdTech) research, there have been many
initiatives to support the development of such time
management skills. For instance, most of the re-
search have used log data from digital learning en-
vironments, such as Learning Management Systems
(LMS). In the literature review by Perez-Alvarez et
al. (P
´
erez-
´
Alvarez et al., 2018), the authors reported
a list of EdTech tools that support SRL in online
environments, such as MOOCs. The most promi-
nent tools were the data coming from online student
activity in the LMS (e.g., days and number of lo-
gins to the LMS, the number of views on weekly
course videos and e-books, the frequency of partici-
pation in the forum environment (Karaoglan Yilmaz
and Yilmaz, 2020)), and assessment data (assessment
scores on weekly assignments or quizzes or knowl-
edge levels obtained from such assessments (Garc
´
ıa-
Sol
´
orzano et al., 2018)). Another source of data
was self-reported data through the LMS (e.g., self-
set goals and surveys to measure students’ percep-
tions or overall experience or beliefs) (Aguilar et al.,
2021; Inan-Karagul and Seker, 2021; Karaoglan Yil-
maz and Yilmaz, 2020). In addition, self-reported sur-
vey data from students has only been studied to un-
derstand their beliefs and current motivations about
SRL when moving from high school to a higher ed-
ucation institution (Garc
´
ıa-Ros and P
´
erez-Gonz
´
alez,
2012). Nonetheless, the results from questionnaires
are often used for research purposes, for example, to
understand the impact of time behavior skills on aca-
demic performance (e.g., (Adams and Blair, 2019)),
meaning that students often do not receive their re-
sults as feedback for improvement.
Another strand of literature indicates that feed-
back on SRL is most often presented through LA
dashboards, due to its potential benefits for students
success or learning outcomes (Viberg et al., 2020;
Matcha et al., 2019). Viberg and colleagues (Viberg
et al., 2020) presented a review of empirical research
on LA and self-regulation for online learning envi-
ronment, highlighting the potential of digital traces to
measure SRL strategies. For instance, PeerLA (Kon-
ert et al., 2016) allows students to keep track of their
knowledge level (self-report data) and compare this
information with automatically extracted measures
collected from Moodle through visualisations. In an-
other work, authors presented LASSI (Broos et al.,
2017), a dashboard that presents feedback to first-
year university students about their personal skills
(concentration, failure anxiety, motivation, use of test
strategies, and time management). Students also re-
ceive recommendations on how a particular skill can
be improved. LASSI has been widely applied in Eu-
ropean Universities, and empirical evaluation demon-
strated its positive impact on scalability, usefulness
and usability. Inspired by this latter research, we ap-
plied a similar approach in a Latin American context.
Nevertheless, we are interested in a deeper analysis of
time management dimensions instead of analyzing it
as a unique skill.
3 TMBQ-LT: AN LA TOOL TO
SUPPORT TIME
MANAGEMENT
The TMBQ-LT tool has been developed as a web ap-
plication. The tool provides Higher-Education stu-
CSEDU 2023 - 15th International Conference on Computer Supported Education
218
dents with tailored feedback on time management
strategies according to their current time management
skills levels.
3.1 Assessment of Student’s Time
Management Skills
To assess students’ time management skills or pre-
dispositions levels, we use the Time Management
Behavior Questionnaire (TMBQ) self-report ques-
tionnaire, which has been previously validated with
college students (Garc
´
ıa-Ros and P
´
erez-Gonz
´
alez,
2012). The TMBQ consists of 34 statements dis-
tributed in four dimensions: establishing objectives
and priorities (D1), use of time management tools
(D2), preferences for organization (D3), and percep-
tion of control over time (D4). Thus, TMBQ-LT pro-
vides tailored recommendations for each dimension.
The statements can be answered using a five-point
Likert scale (1: never, 5: always). To assess students’
time management skills, we assign the score given by
a student in the Likert scale, meaning that each state-
ment could have a minimum score of 1 if the student
selects ”never” and a maximum score of 5 if the stu-
dent selects ”always.” After, we calculate a total score
by summing up all scores from the 34 statements and
a score per dimension by summing up the scores from
the statements per dimension. To facilitate the inter-
pretation of results, these scores are scaled to 100.
Thus, we will have five scores per student: the total
and D1 to D4 scores, ranging from 0-100.
Following a similar approach as in well-known
academic tests (e.g., TOEFL iBT, GRE), we assigned
a skill level per dimension. Each dimension has five
levels, so when a score falls within a range level, it
will assign that level to the specific dimension. Table
1 summarizes the dimensions and their corresponding
labels and value ranges.
Table 1: Scores boundaries for skill levels.
low medium medium-high high
D1 [10,30) [30,35) [35,40) [40,50]
D2 [11,25) [25,32) [32,39) [39,55]
D3 [8,14) 14 [15,17) [17,25]
D4 [12,24) [24,28) [28,31) [31,40]
To account for the variability and context of our
population, these ranges were calculated using a sam-
ple (N=1083) of students that completed the TMBQ.
We processed the dataset from the TMBQ to calcu-
late quartiles and their boundaries per dimension. The
participants obtained a score between the lowest and
highest boundary in each dimension, e.g. regarding
D1: If students obtained scores between [10,30), it
means that those students have low skills in estab-
lishing objectives and priorities. On the other hand,
if students got scores between [40,50), it means that
they have high skills in D1.
3.2 Visualization Components and
Tailored Feedback
The feedback tool is composed of A) the total score,
B) a polar area diagram to display four quadrants -
one per dimension - with its corresponding score (see
Figure 1, and C) a set of recommendations based on
their levels of personal skills (for example, see Figure
2).
As depicted in Figure 1, each quadrant is color-
coded to support the interpretation of the score. The
color represents one of the four levels in which a
student can be allocated: high (green), medium-high
(light green), medium (yellow) and low (orange). The
diagram also portrays a red line, representing the av-
erage score from students with a similar profile (i.e.,
age), allowing students to compare their score to other
learners and improve their motivation, as suggested in
(Wise, 2014).
Below each dimension’s name, a student can click
the link “See recommendation”, which opens a win-
dow showing advice tailored to the score and level
obtained (Figure 2). These recommendations were
co-constructed with two advisors from Institution 1.
Each advisor was invited to participate in a semi-
structured interview to examine the recommendations
experts would give students to improve time manage-
ment skills. In the interview, led by one researcher,
the advisor was asked to propose three tips that stu-
dents can easily follow and three digital tools to help
them manage their time. After these interviews, the
researcher crafted a final list of tips and tools, which
the two advisors further verified and agreed upon.
4 EXPLORATORY STUDY
The main goal of this exploratory study was to in-
troduce the TMBQ-LT to students from different HE
institutions and explore their perceptions of the tool’s
usage and potential impact. Therefore, we aim to:
1. Explore the current situation of students’ time
management strategies.
2. Understand students’ perceptions of the score sat-
isfaction, usefulness, and information clarity.
Figure 3 depicts the deployment of our study tak-
ing a learning analytics process (Clow, 2012). Our
study is mainly focused on students enrolled in HE
TMBQ-LT: A Student-Facing Learning Tool to Support Time Management Skills
219

Figure 1: Overall score and LA visualization depicting scores per each dimension. The red line represents the average score
of students with a similar profile (i.e., age).
institutions. We collected self-reports from these stu-
dents using the TMBQ. We used statistical analysis,
as explained in section 3.1, to generate visualizations
and recommendations tailored to students’ time man-
agement skill levels. Finally, we aim to provide rec-
ommendations and support the reflection of their cur-
rent skills.
The following sections describe the methods and
analysis to address the two goals of this exploratory
study.
4.1 Participants, Tasks and Data
Collection
Three HE institutions participated in this study; in
partnership with their academic and counselling ser-
vices, we invited students to participate in the webinar
”Techniques to Manage Time” (executed four times)
and in a workshop, hereafter referred to as dissem-
ination sessions. We used different HE institutions’
official social media channels (i.e., Facebook, Twit-
ter, Instagram), and email to invite students. Dissem-
ination sessions were programmed online via zoom
between June and July 2022. During the execution of
the dissemination sessions, an expert presented sev-
eral strategies to learn and improve time management
and invited students to use the TMBQ-LT tool. Stu-
dents filled out the TMBQ questionnaire including de-
mographic questions (i.e., age, gender), obtaining the
tailored feedback and recommendations generated by
the tool. In order to measure the usefulness and stu-
dents’ satisfaction with the tool, students filled out
a questionnaire. This questionnaire includes three
five-point Likert-scale questions (Q1-score satisfac-
tion: ”How do you feel about your scores?”; Q2-
usefulness:”Are the recommendations and scores use-
ful?”; Q3-clarity: ”The visualization and recommen-
dations are clear and concise?”) and one open-ended
question (”Tell us more about your perception of the
tool and suggestion for improvement”).
CSEDU 2023 - 15th International Conference on Computer Supported Education
220

Figure 2: An example of the recommendations given to stu-
dents. This is an example for a student who clicked on the
recommendations for D2 and got a medium skill level.
Figure 3: Our study taking a learning analytics process.
4.2 Results
A total of 1083 students completed the TMBQ. Table
2 shows the distribution of students who completed
the TMBQ according to their gender. Table 3 summa-
rizes the age of students per institution.
First, to explore the current situation of students’
time management strategies, we analyzed the results
from the TMBQ questionnaire per institution and per
dimension. Figure 4 depicts the results per institution.
From these results, we can observe that, for D1 (estab-
lishing objectives and priorities), most students have
Table 2: Distribution of students per institution.
I1 I2 I3 Total
Female 224 125 42 391
Male 344 231 113 688
Prefer not to say 1 2 1 4
Total 569 358 156 1083
Table 3: Students’ age descriptive statistics per institution.
I1 I2 I3
min age 17 17 17
max age 42 51 30
average 19.64 21.40 20.67
std dev 2.34 3.81 2.51
a medium-high level for this dimension, independent
of the institution. As for D2 (use of time manage-
ment tools), most students exhibited a medium (I2) or
medium-high level (I1 and I3). In D3 (preferences of
organization), most students reported a medium level
(I1, I2 and I3). Finally, for D4 (perception of control
over time), students exhibited a medium-high level.
Second, to understand students’ perception of the
usefulness of the feedback tool, we calculated de-
scriptive statistics for the three Likert-scale questions,
as shown in Table 4. 662 out of 1083 students eval-
uated their perceptions of the tool. From Table 4,
we can observe positive results reported by students
about the usefulness (Q2) and clarity (Q3) of the tool.
Nevertheless, students were not completely satisfied
with their scores (I1 - M:3.39, SD: 0.69; I2 - M:3.88,
SD: 0.77; I2 - M:3.40, SD: 0.75).
Table 4: Students’ perceptions about (Q1) score satisfac-
tion, (Q2) usefulness and (Q3) clarity.
I1
M(SD)
I2
M(SD)
I3
M(SD)
Q1 3.69 (0.69) 3.88 (0.77) 3.40 (0.75)
Q2 4.17 (0.69) 4.18 (0.85) 3.89 (0.85)
Q3 4.24 (0.73) 4.32 (0.78) 3.92 (0.82)
Additionally, we conducted a thematic analysis
(Clarke et al., 2015) of the qualitative data from open-
ended questions. Two researchers analyzed the quotes
and got a consensus after interpretation discussions.
A total of 164 quotes extracted from students’ re-
sponses were thematically coded into 1) Positive, 2)
Negative, 3) suggestions for improvement, and 4) re-
flective comments.
Regarding positive comments, 47% of students
gave positive comments about the feedback presented
in the tool. They think that the tools recommended
help meet their goals. One student mentioned that:
”the tools suggested will help us to improve our time
management strategies” (S32, I2) and another student
shared that: ”the information will help us to know
the way to meet our goals” (S34, I2). Students also
think that the tool is consistent, and the visualization
helps them reflect on their weaknesses and ways to
improve their organization. For instance, P54 (I2)
mentioned that ”The questionnaire is consistent with
the visualization so that we can self-assess our daily
TMBQ-LT: A Student-Facing Learning Tool to Support Time Management Skills
221
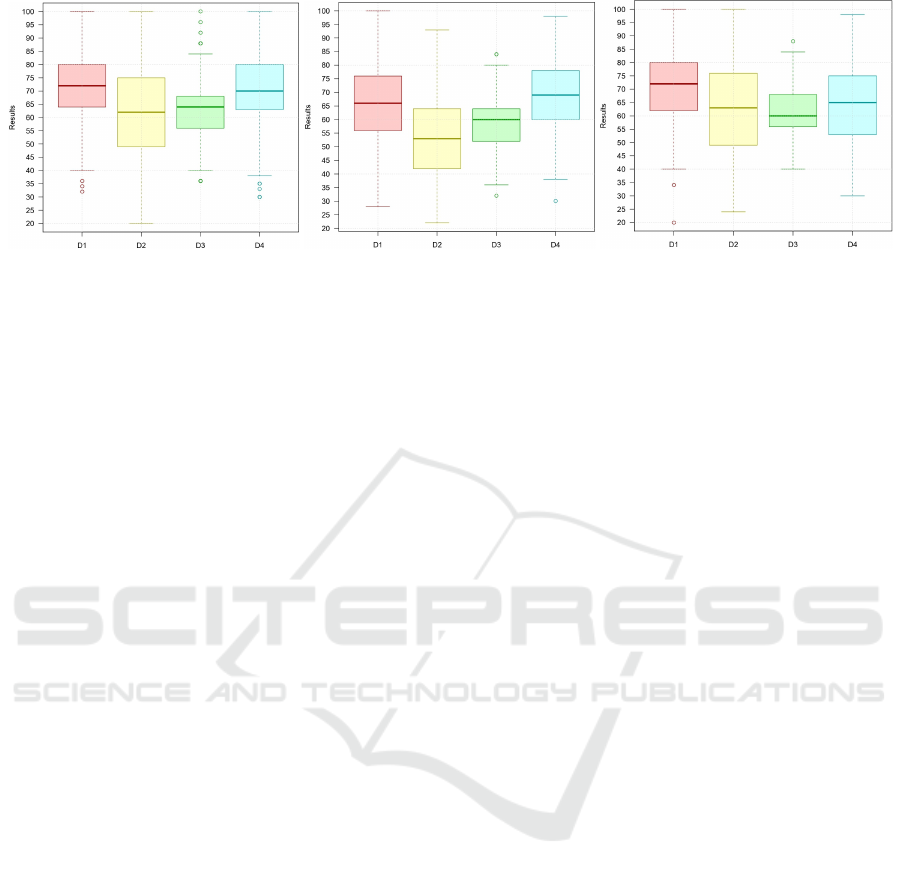
(a) I1. (b) I2. (c) I3.
Figure 4: TMBQ results per institution.
performance”. Supporting this idea, P116 (I1) ex-
pressed that ”the tool is a perfect way to know the
weak points when organizing my day.” And, P46 (I2)
reflected on the usefulness and future use as follows:
”The diagram presented in at the end [visualization]
was handy, because it allows me to see my general
performance, what I should improve, and what tools
I can use to help me organize my time and academic
activities. If I retake this questionnaire, I will be able
to reflect on my past and be more organized”. In addi-
tion to the positive comments about the tool, students
also liked these dissemination sessions and feedback
initiatives. One student mentioned that ”the univer-
sity should provide students ways to improve our time
management to achieve our goals” (S44, I2) and an-
other expressed that ”I hope they [university] con-
tinue to carry out more dissemination sessions with
this topic” (S42, I2)
Regarding negative comments, 4% of students
gave negative comments about the tool. Some stu-
dents requested to make the information clearer and
more concise. For example, one student expressed
that ”a more specific explanation could be added”
(P86, I1). Improvements in multi-platform mobile
devices were also raised. As one student expressed:
”The mobile version had some complications and is-
sues, such as the legibility of the information. There-
fore, different devices should be considered in a fur-
ther version” (P33, I2).
Regarding suggestions for improvement, 20% of
students provided suggestions concerning the dissem-
ination session content, the information gathered from
the questionnaire, and the information presented in
the recommendations. Students suggested that more
real-world examples should be included in the dis-
semination sessions (P5, P23-I1; P115-I3).
Concerning the questionnaire, students mentioned
that the questionnaire should include questions that
reflect real-life examples to capture their reality cre-
atively (P12-I1; P115-I3). For example, one student
expressed that ”there should be a section to ask if
you dedicate more time to social activities compared
to other activities” (P105, I1); similar to what was
indicated by P124 (I1): ”There should be questions
about the relationship between your time for study
and the time you dedicate to your friends and fam-
ily.” In addition, one student suggested that the self-
report should include questions about the use of dig-
ital tools, as the current TMBQ only focuses on gen-
eral tools such as agendas: ”I think you could add a
question to ask if you use a digital tool for time man-
agement. Personally, I don’t use agendas, but I prefer
to use an app installed in my phone to manage my
time and habits” (P81, I1). P149 (I1) commented,
”You should consider that not all students are used to
carrying out an agenda.” Another student suggested
adding questions about willingness, motivation, and
engagement (P25, I3). In contrast, another student
suggested adding ”open-ended questions” to explain
their situation (P74, I1).
Concerning the feedback information (i.e., the
visualization and recommendations), students sug-
gested that it would be beneficial for them to add
other topics to the recommendations: ”I would add
more recommendations to improve my time manage-
ment skills” (P115-I3, P142-I1.) For example, stu-
dents would like to receive a study plan for short and
long-term goals: ”I would like to receive a study plan
for my short and long-term goals” (P95, I1). Another
student suggested including learning strategies: ”You
could also add learning strategies and not only fo-
cus your recommendations on tools like Pomodoro”
(P125, I1). One student recommended adding more
details and context about their flaws (P30, I1).
Regarding the recommendations of digital tools,
students mentioned that other tools should be con-
sidered for this matter. One student expressed that,
while ”Pomodoro” can work well for some students,
he would prefer other tools that do not interrupt while
working: ”I don’t like Pomodoro because it limits
CSEDU 2023 - 15th International Conference on Computer Supported Education
222

your time and sometimes the alarm goes on when you
have increased your motivation to work” (P40, I2).
Other tools could be included as part of the list of rec-
ommendations, such as ”Forrest,” which allows keep-
ing your study times using gamification elements.
Other students mentioned that the recommendations
should also factor in external aspects that could affect
their time management strategies: ”The tool should
also focus on external factors that could affect their
organization. It is not only a matter of assuming that
a student is lacking commitment for an organization”
(P68, I1). Finally, concerning reflective comments,
3% of students reflected on their results, even though
this was not asked. Students were mostly surprised by
these results. One student mentioned, ”I was some-
what surprised, I know that I don’t use 100% of my
energy at work, but I didn’t know it was low” (P17,
I3). Another student expressed: ”To be honest, I
didn’t know I have to improve a lot” (P133, I1). An-
other student reflected on the misalignment between
his self-reflection and results displayed in the tool:
”I have very important goals and objectives for my-
self and to improve this society. Maybe I gave lower
scores to questions regarding this topic. Hence, I got
lower results” (P78, I1).
5 DISCUSSION
This work aimed to address two goals. The first
goal was to explore the current situation of student
time management strategies in a Latin American con-
text. Using the TMBQ embedded in the tool, we ex-
tracted the survey results from first-year students en-
rolled in three local HE institutions. While the re-
sults reflect students’ positive perception of their time
management skills, some reported a medium to high-
medium skill level in using time management tools
(D2). The TMBQ-LA tool gave students recommen-
dations about digital tools that they could use to im-
prove this skill. Although these results suggested that
students’ time management strategies are acceptable,
it is worth mentioning that this subjective data should
also be supported by more objective data, such as dig-
ital traces from learning environments. In this way,
the tool could give better insights, as it is well known
that young students exhibit errors when systemati-
cally self-reporting data. Hence it could hinder the va-
lidity of results (Colladon and Grippa, 2018). In addi-
tion, while we reported the TMBQ survey results, our
intention was not to explore the differences between
students enrolled in different institutions. Instead, we
aimed to test the current status of our students and
how we can best support them.
The second goal was to explore students’ percep-
tions of the tool in terms of score satisfaction, use-
fulness, and clarity. Our results suggest that, overall,
students perceived the tool as helpful, and the infor-
mation presented was clear and concise. This was re-
flected in students’ positive comments about the tool.
On the contrary, students reported a neutral position
regarding their satisfaction with their results and feed-
back. Two main points could explain this. First, as
mentioned above, students’ self-report data is prone
to unconscious errors, which may cause a disconnec-
tion between their beliefs and the actual score they re-
ported. Second, students’ comments pointed out that
the questionnaire should factor in external situations,
such as social, economic and life-related factors. In
our local context, students often face uncertainty in
several social planes, which may cause disruptions in
their learning and performance. Another social fac-
tor that affects current young students is procrastina-
tion. Students suggested that more information about
learning strategies or study plans would be beneficial
to (at least try to) overcome these diverse challenges.
Students also valued this initiative, as it is not a com-
mon practice for students to receive this type of feed-
back or recommendations. In our country, LA solu-
tions are scarce. Hence this work is one of the first
initiatives to build the infrastructure needed to imple-
ment a LA solution at scale.
6 CONCLUSION
This work presented the TMBQ-LT, a LA feedback
tool to measure the time management predisposition
of students and provide tailored feedback based on
their skill levels. This tool is one of the first be-
ing deployed in our local context. Results revealed
a student’s positive attitude towards the tool’s useful-
ness and the clarity of the information. Future work
should address more longitudinal studies to measure
the tool’s impact. It should also include follow-up in-
terventions to support more reflective practices.
ACKNOWLEDGEMENTS
This work was supported by LATHEE (Learning
Analytics Tailored to Higher Education in Ecuador)
project (EC2020SIN321A101), which is co-financed
by VLIR-UOS.
TMBQ-LT: A Student-Facing Learning Tool to Support Time Management Skills
223

REFERENCES
Adams, R. V. and Blair, E. (2019). Impact of
time management behaviors on undergraduate en-
gineering students’ performance. Sage Open,
9(1):2158244018824506.
Aguilar, S. J., Karabenick, S. A., Teasley, S. D., and Baek,
C. (2021). Associations between learning analytics
dashboard exposure and motivation and self-regulated
learning. Computers & Education, 162:104085.
Alario-Hoyos, C., Est
´
evez Ayres, I. M., San Agustin, M. P.,
Leony Arreaga, D. A., and Delgado Kloos, C. (2015).
Mylearningmentor: A mobile app to support learners
participating in moocs.
Broos, T., Peeters, L., Verbert, K., Soom, C. V., Langie, G.,
and Laet, T. D. (2017). Dashboard for actionable feed-
back on learning skills: Scalability and usefulness. In
International Conference on Learning and Collabora-
tion Technologies, pages 229–241. Springer.
Clarke, V., Braun, V., and Hayfield, N. (2015). Thematic
analysis. Qualitative psychology: A practical guide to
research methods, 222(2015):248.
Clow, D. (2012). The learning analytics cycle: closing the
loop effectively. In Proceedings of the 2nd interna-
tional conference on learning analytics and knowl-
edge, pages 134–138.
Colladon, A. F. and Grippa, F. (2018). The importance
of being honest: Correlating self-report accuracy and
network centrality with academic performance. The
Journal of Psychology, 152(5):304–324.
Garc
´
ıa-Ros, R. and P
´
erez-Gonz
´
alez, F. (2012). Spanish ver-
sion of the time management behavior questionnaire
for university students. The Spanish Journal of Psy-
chology, 15(3):1485–1494.
Garc
´
ıa-Sol
´
orzano, D., Santamar
´
ıa, E., Moran, J. A., Cobo,
G., and Monzo, C. (2018). Personal informatics sys-
tems for supporting self-regulation in online learning
environments. Computer Applications in Engineering
Education, 26(5):1445–1456.
Ga
ˇ
sevi
´
c, D., Dawson, S., Rogers, T., and Gasevic, D.
(2016). Learning analytics should not promote one
size fits all: The effects of instructional conditions in
predicting academic success. The Internet and Higher
Education, 28:68–84.
Hamdan, K. M., Al-Bashaireh, A. M., Zahran, Z., Al-
Daghestani, A., Samira, A.-H., and Shaheen, A. M.
(2021). University students’ interaction, internet self-
efficacy, self-regulation and satisfaction with online
education during pandemic crises of covid-19 (sars-
cov-2). International Journal of Educational Manage-
ment.
Heikkil
¨
a, A. and Lonka, K. (2006). Studying in higher
education: students’ approaches to learning, self-
regulation, and cognitive strategies. Studies in higher
education, 31(1):99–117.
Inan-Karagul, B. and Seker, M. (2021). Improving lan-
guage learners’ use of self-regulated writing strate-
gies through screencast feedback. SAGE Open,
11(4):21582440211064895.
Karaoglan Yilmaz, F. G. and Yilmaz, R. (2020). Stu-
dent opinions about personalized recommendation
and feedback based on learning analytics. Technology,
knowledge and learning, 25(4):753–768.
Kizilcec, R. F., P
´
erez-Sanagust
´
ın, M., and Maldonado,
J. J. (2017). Self-regulated learning strategies predict
learner behavior and goal attainment in massive open
online courses. Computers & education, 104:18–33.
Konert, J., Bohr, C., Bellh
¨
auser, H., and Rensing, C. (2016).
PeerLA - Assistant for Individual Learning Goals and
Self-Regulation Competency Improvement in Online
Learning Scenarios. In 2016 IEEE 16th Int. Conf. Adv.
Learn. Technol., pages 52–56.
Kruger, J. and Dunning, D. (1999). Unskilled and unaware
of it: how difficulties in recognizing one’s own incom-
petence lead to inflated self-assessments. Journal of
personality and social psychology, 77(6):1121.
Matcha, W., Ga
ˇ
sevi
´
c, D., Pardo, A., et al. (2019). A sys-
tematic review of empirical studies on learning ana-
lytics dashboards: A self-regulated learning perspec-
tive. IEEE Transactions on Learning Technologies,
13(2):226–245.
N
´
u
˜
nez, A.-G., Silva, I., Solano-Quinde, L., M., Z.-P.,
Echeverria, V., and De Laet, T. (2022). Learn-
ing analytics to support the provision of feedback in
higher education: a systematic literature review. Latin
American Conference on Learning Technologies (LA-
CLO2022).
Pardo, A., Jovanovic, J., Dawson, S., Ga
ˇ
sevi
´
c, D., and Mir-
riahi, N. (2019). Using learning analytics to scale the
provision of personalised feedback. British Journal of
Educational Technology, 50(1):128–138.
P
´
erez-
´
Alvarez, R., Maldonado-Mahauad, J., and P
´
erez-
Sanagust
´
ın, M. (2018). Tools to support self-regulated
learning in online environments: Literature review. In
European conference on technology enhanced learn-
ing, pages 16–30. Springer.
P
´
erez-
´
Alvarez, R., Maldonado-Mahauad, J. J., Sapunar-
Opazo, D., and P
´
erez-Sanagust
´
ın, M. (2017). Note-
myprogress: A tool to support learners’ self-regulated
learning strategies in mooc environments. In Euro-
pean conference on technology enhanced learning,
pages 460–466. Springer.
Viberg, O., Khalil, M., and Baars, M. (2020). Self-regulated
learning and learning analytics in online learning en-
vironments: A review of empirical research. In
Proceedings of the tenth international conference on
learning analytics & knowledge, pages 524–533.
Wise, A. F. (2014). Designing pedagogical interventions to
support student use of learning analytics. In Proceed-
ings of the fourth international conference on learning
analytics and knowledge, pages 203–211.
Zimmerman, B. J. (2000). Attaining self-regulation: A
social cognitive perspective. In Handbook of self-
regulation, pages 13–39. Elsevier.
Zimmerman, B. J. (2008). Investigating self-regulation and
motivation: Historical background, methodological
developments, and future prospects. American Edu-
cational Research Journal, 45(1):166–183.
CSEDU 2023 - 15th International Conference on Computer Supported Education
224
