
Semantic Representation of Key Performance Indicators Categories for
Prioritization
Tarique Khan, Alex Mircoli, Domenico Potena and Claudia Diamantini
Department of Information Engineering, Universit
`
a Politecnica delle Marche, Italy
Keywords:
Business Process Management, Integrated Indicator Framework, Key Performance Indicators, Ontology, Set
Theory.
Abstract:
Key Performance Indicators (KPIs) are crucial tools that are remarkably used to evaluate business perfor-
mance. Recently, the management of KPIs has fascinated the focus of both academic and business profession-
als, and that lead to the development of research on various methods dealing with issues such as modeling,
maintenance, and expressiveness of KPIs. As a need for organizations and processes to adapt to continuously
changing demands, the KPIs used to measure their effectiveness evolve too. In order to make KPI management
easier, this research aims to define the best sequence of KPIs evaluation based on semantic relations. After
an extensive analysis of the literature on KPIs ontologies, it proposes the idea of KPIs prioritization on the
basis of relations among different categories of kpis established by a KPIs ontology. Our approach can be used
independently from the particular KPI’s management strategy being employed.
1 INTRODUCTION
Due to the modern data society, businesses and in-
stitutions can now access a great deal of informa-
tion in many different forms. The appropriate use of
the available data can result in changes to an organi-
zation’s processes, systems, and procedures because
continuous business improvement is needed. Dif-
ferent factors, such as adjustments to the company’s
business strategy, the fixing of identified problems,
changes to the law, or technical advancements, might
bring about changes (Cognini et al., 2018). Compa-
nies realized that they needed to be agile, flexible, and
focused on their business strategy in order to succeed
in a dynamic environment with competitors, shorter
product lifecycles, and intense price pressures when
third-party countries are bringing costs down (Fer-
reira et al., 2017; Cortes et al., 2016; Sahno et al.,
2015; Haponava and Al-Jibouri, 2012).
In recent years, businesses have suffered from fail-
ing to retain customers and a lack of funding. The
company’s performance must be high to accomplish
those goals, and goods or services must be produced
or delivered at the right places, at the proper time,
in the appropriate amount, and for the suitable clien-
tele, (Konsta and Plomaritou, 2012; Azapagic, 2003).
The use of key performance indicators (KPIs), a con-
temporary technique, helps to sustain high levels of
manufacturing performance (Tsai and Cheng, 2012).
Following and monitoring the proper metrics in real-
time, organizations are able to identify and compre-
hend constraints, assess worker and machine effi-
ciency, set higher targets, and accomplish them by
moving forward. The ability to measure performance
enables one to identify performance concerns, deter-
mine how well one is progressing toward one’s ob-
jectives, and provide precise instructions for resolv-
ing issues (Horv
´
athov
´
a et al., 2015). provide a novel
semantic framework for describing performance in-
dicators that helps create and maintain a concise and
reliable lexicon(Diamantini et al., 2016).
To identify the areas that need to be addressed, it
is essential to evaluate how well business operations
are performing. In every business sector, Key Perfor-
mance Indicators (KPIs) have been widely used and
defined inside information systems. It makes sense
that there would be substantial and in-depth research
on this subject given how important KPIs are. De-
spite this, there is no established framework for the
definition and application of KPIs. In (Dom
´
ınguez
et al., 2019) the author discussed this problem and
suggested a solution.
In this study we provide a semantic approach to
the problem of KPI advancement management. Key
Performance Indicator (KPI) advancement manage-
ment is a crucial aspect of business success, as it helps
142
Khan, T., Mircoli, A., Potena, D. and Diamantini, C.
Semantic Representation of Key Performance Indicators Categories for Prioritization.
DOI: 10.5220/0011848700003467
In Proceedings of the 25th International Conference on Enterprise Information Systems (ICEIS 2023) - Volume 2, pages 142-151
ISBN: 978-989-758-648-4; ISSN: 2184-4992
Copyright
c
2023 by SCITEPRESS – Science and Technology Publications, Lda. Under CC license (CC BY-NC-ND 4.0)

organizations to track and measure the metrics that are
most critical to their performance. By regularly mon-
itoring these KPIs, businesses can gain valuable in-
sights into their operations and make data-driven de-
cisions to drive improvement. The first step in KPI ad-
vancement management is to identify the right KPIs
for the organization. This will vary depending on the
specific business and its goals, but could include met-
rics such as customer satisfaction, employee engage-
ment, and financial performance. Once the KPIs have
been identified, it is important to establish goals and
targets for each one, to provide a clear understand-
ing of what success looks like. Next, organizations
need to implement a system for tracking and measur-
ing their KPIs on a regular basis. KPI advancement
management specifically suggests adopting the idea
of a KPI prioritization as the best KPIs evaluation or-
der to consider for a given class of KPIs. The prior-
itization order is then derived by semantic relations
among different categories of KPIs as modeled in an
ontology. The primary goal of the long-term research
project is to provide a universal framework for man-
aging KPIs advancement.
The rest of the paper is organized al follows: Sec-
tion 2 is devoted to a throughout analysis of related
work about ontologies of KPIs; in Section 3 the pro-
posed methodology is discussed. Finally, Section 4
draws some conclusions and future work.
2 LITERATURE STUDY
2.1 Towards a Framework for KPI
Evolution
Towards a Framework for KPI Evolution (Domınguez
et al., 2020), provides the emphasis on the con-
cepts of a conceptual framework, including a pattern-
driven KPI evolution specification and a KPI evo-
lution meta-model composed of two interconnected
views. Firstly, the structural view of the meta-model
provides the basis to design meta-information for the
KPI’s evolution, and secondly, the execution view
concerns the applications built on the given struc-
tural views. Moreover, the approach presented in a
study (Domınguez et al., 2020) is broad enough to
be used independently of the particular KPIs man-
agement strategy being adopted. Several areas re-
quiring additional research must be addressed to de-
velop this general framework. The integration of the
proposal within other KPIs management approaches
must also be investigated to ascertain how proposed
approach are properly incorporated into these ap-
proaches. Some of the KPI strategies are briefly dis-
cussed below, and Table 1 provides some ontology-
based techniques.
2.2 A Lightweight Version of National
Performance Indicator Ontology
(NPIonto)
Oarabile Sebubi et al. (Sebubi et al., 2019) pro-
posed a model that was created to meet the domain
needs for Botswana’s development agenda, which
calls for a consolidated indicator framework with dis-
tinct connection mappings and data definitions, as
well as data disaggregation and consideration of PIs’
multi-dimensional features. The model was con-
ceptualized using the official development agenda
documents as a foundation and developed using the
Knowledge Model Development (KMD) methodol-
ogy. Dom
´
ınguez et al. (Dom
´
ınguez et al., 2019) pri-
marily concentrate on this KPIs management element
aims to deliver outstanding advantages like improv-
ing KPIs management knowledge or assisting users
in selecting the best solution for their needs.
2.3 Implementation of Key
Performance Indicators Selection
Model as Part of the Enterprise
Analysis Model
Kaganski et al. (Kaganski et al., 2017) proposed the
findings of adopting the KPI selection model as part
of the Enterprise Analysis Model (EAM). The model
was put to the test by a private firm. The collection of
KPIs that management should use was created. The
suggested approach allows for time and resource sav-
ings during evaluation and metric selection.
2.4 Towards a KPI-Based Ontology for
Condition Monitoring of
Automation Systems
Pasic et al. (Pasic et al., 2019) presented a conceptual
paradigm and condition monitoring ontology for au-
tomation systems. This ontology combines ISO stan-
dards for key performance indicators and condition
monitoring (KPIs). Based on the proposed ontology
in an industrial project, the author created a condition
monitoring knowledge-based system for a centrifu-
gal separator and reported the criteria to evaluate this
work. This project aims to use semantic web query
languages to link various knowledge-based systems
engineering (MBSE) tools.
Semantic Representation of Key Performance Indicators Categories for Prioritization
143

Table 1: Common Ontologies from the Literature.
Approach Domain
Ontology Lan-
guage Used
SUPER and SemBiz
(Hoang et al., 2010)
Ontologies stack WSMO
Jenz’s BPM (Raba-
hAzzam and Zhou,
2012)
Core business ontology; industry-specific ontology;
organization-specific ontology
OWL
M3po Project (Thapar
and Sharma, 2022)
M3po ontology WSMO
Genesis (Shanthi Bala
and Aghila, 2019)
Business OWL OWL
CNO (Rajsiri et al.,
2008)
Collaborative network ontology; Collaborative process on-
tology
OWL/SWRL
FlowMake (An-
daloussi et al., 2020)
Graph-based Ontology OWL
YAWL (Van Der Aalst
and Ter Hofstede,
2005)
Specification of workflow and data perspective of business
processes
WFMS
E-C-A Based (Ndadji
et al., 2020)
Rule based process modeling to provide an integration
layer between process modeling languages
SDL
ADEPT (Dadam and
Reichert, 2009)
Rule-based ontology; designing and implementing multi-
agent systems for workflows
SDL
2.5 Generalized KPI Models
A generalized KPI model proposed to improve busi-
ness performance looked into the connection be-
tween institutional ownership and Malaysian pub-
licly traded firms’ financial performance (Ahmad and
Jusoh, 2014). The Six Sigma method is a data-
driven approach to process improvement that focuses
on reducing defects and improving quality (Albliwi
et al., 2015). Some other generalized rules-based ap-
proaches developed such as the McKinsey 7S frame-
work tools used for analyzing and improving the ef-
fectiveness of organizations (Trompenaars and Co-
ebergh, 2014).
2.6 Toward an Ontology-Based Model
of Key Performance Indicators for
Business Process Improvement
Ammar et al. (Amor and Ghannouchi, 2017) pro-
posed a novel ontology to establish semantic linkages
between all terms based on an actual business pro-
cess. The author relied on the data mining technique
to extract the most crucial information from data mea-
surements. The application of the suggested contribu-
tion is demonstrated, and a case study in the field of
healthcare is used to validate it. This study reveals
that understanding KPIs from patient experience in
the ED and interactions with other indicators are sig-
nificant qualities for improving blood pressure.
2.7 Towards Measuring Key
Performance Indicators of Semantic
Business Processes
Wetzstein et al. (2008) present a key performance
indicator-based approach to semantic business pro-
cess performance management. The advantage of this
method over previous work is that business analysts
may completely specify KPIs during the process mod-
eling phase since the necessary data, such as business
objects and changes in their state, are available as se-
mantic annotations of activities.
Table I shows the most common ontologies used
in the literature for business organizations and their
respective tasks. It can be observed that graph-based
ontologies are mostly formed using OWL or similar
tools. Also, OWL is a tool that can be used in various
types of ontologies while many of the tools are
domain specific. For instance, Service Description
Language (SDL) can only be used in rule-based
ontologies and web service modeling language
(WSMO) can be applied in ontologies related to
business structures.
ICEIS 2023 - 25th International Conference on Enterprise Information Systems
144

3 METHODOLOGY
As businesses develop and grow, the management of
quality and performance becomes crucial. To achieve
success in businesses and enterprises, the considera-
tion of factors that affect business has great impor-
tance in Business Process Management (BMP). That
can be analyzed through dashboards, reports (Par-
menter, 2015) supporting decision-makers in identi-
fying opportunities for re-engineering the desired pro-
cess and improvements. There are many processes
involved in BPM to understand and measure the busi-
ness indicators. In our proposed methodology for
simplification and generalization, we comprise the
whole BPM into three important parts (i.e., manage-
ment, methodological approach, and technology). As
concluded from the literature, there is a lot of research
available for BPM to calculate the Key Performance
Indicators (KPIs) in qualitative, quantitative, and se-
mantic ways. But, proposal lack the ability to iden-
tify KPIs serialization based on priority in a semantic
way. KPIs pertaining to a business process can be in-
terrelated to each other, either directly or indirectly.
For example, the sell price is directly related to the
product cost. Consequently, this research aims to find
the best sequence of KPIs evaluation based on seman-
tic relations. The methodology has been graphically
viewed in Figure 1.
3.1 Business Process Management
(BPM)
Businesses are managed by high-level staff (man-
agers) for the smooth flow of services and success.
However, business process management involves sev-
eral important steps and resources such as the cre-
ation, implementation, monitoring, and analysis of
operational business processes, including people, or-
ganizations, software, documents, and other sources
of information (Park et al., 2012). To simplify BPM in
a generalized way, the BMP is summarized into three
categories: management, methodological approach,
and technology.
Management: A company’s management team
often defines processes, categorizes metrics, monitors
performance and goals, and works to improve pro-
cesses in order to meet market demands and provide
valuable goods and services. Hereafter, the manage-
ment team has extensive involvement in the conclu-
sion of indicators.
Methodological Approaches (for BMP): Busi-
ness process improvement is a continuous cycle that
is a part of the BPM methodology. Using phases,
actions, and procedures, aids businesses in improv-
ing their business operations. For example dynamic
BPM, agile BMP, and social BMP. To design, select,
monitor, and alter the business indicator depend on
which methodological approach is adopted for busi-
ness.
Technology (used for BMP): BPM technology
is mostly software systems that can trace and record
business processes to enhance analytics and business
communication. This technology helps automate ac-
tivities and track business projects and performance.
In order to improve performance, quality, and effi-
ciency, BPM technology essentially aids businesses
in having a clear grasp of numerous processes within
the organization. It helps in identifying the important
business indicators.
3.2 Indicators (for Business)
To successfully evaluate a business for its perfor-
mance, it is necessary to consider, analyze, and man-
age the factors/indicators that affect the quality, effi-
ciency, and growth of the business. There are numer-
ous indicators for BPM to be considered. Most of the
indicators are generic and can be selected by any busi-
ness accordingly, while others are specific and vary
from business to business. Specific indicators are de-
signed and selected by each business as per their re-
quirements. In this study, indicators are divided into
categories such as short-term indicators, long-term,
quantitative, qualitative indicators see Table 2.
This research paper considers the generic indica-
tors that are most common in every business activ-
ity to streamline the research model in a general per-
spective for the generalization and extraction of KPIs.
In contrast, specifically selected KPIs for a business
could not be suitable for others’ consideration. The
next step, the generalization of KPIs, is discussed in
detail.
3.3 Key Performance Indicators (KPIs)
A KPI is a quantifiable statistic that shows how well
a business is accomplishing its important business
goals. To extract the generalized form of KPIs, which
are able to be considered by all types of businesses,
the generalized and refined indicators are selected by
BPM. In order to select the most generalized KPIs,
we selected the common business indicator categories
that are included in almost every BPM. The common
categories include long-term, quantitative, dependent,
independent, cost, time, productivity, quality, high-
level, and low-level indicators. Whereas short-term,
qualitative, external, and internal indicators are spe-
cific to the business type, short-term indicators are
Semantic Representation of Key Performance Indicators Categories for Prioritization
145
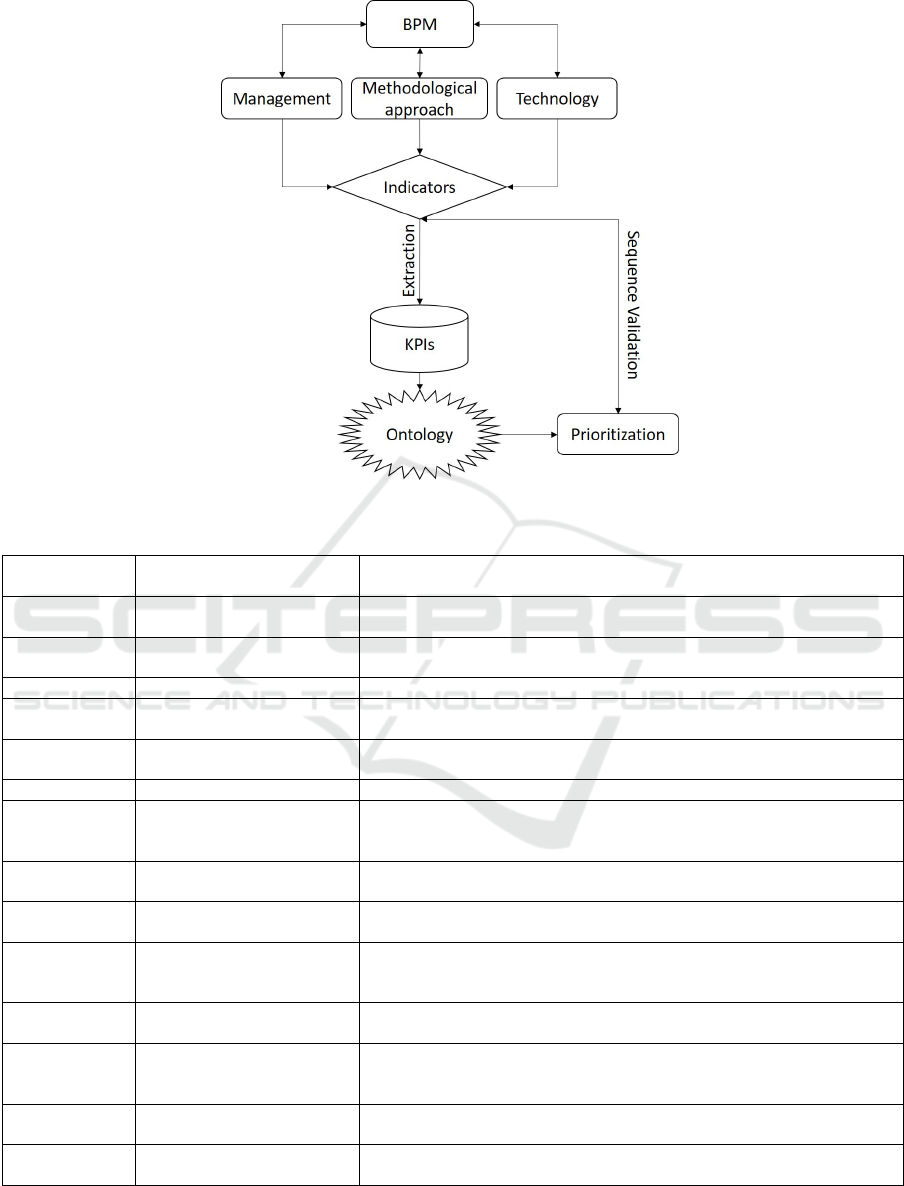
Figure 1: Proposed Methodology.
Table 2: General Categories of Business Indicators Assessed in Process Management.
Abbreviation
Category of business indi-
cator
Description
STI Short term indicators
Those business indicators that are set for short-term goals e.g., production
target for tomorrow
LTI Long term indicators
Those business indicators that are selected for long-term goals e.g., prod-
uct quality
QI I Qualitative indicators Those indicators that belong to the relationship e.g., customer satisfaction
QI II Quantitative indicators
The business indicators that can be evaluated and assigned value e.g.,
delivery time
DI Dependent indicators
The indicators which depend on other indicators e.g., the delivery time
depends on the employ efficiency
II Independent indicators The indicators that can be evaluated independently e.g., investment
CI Cost indicators
these indicators allow you to evaluate the process involved in economic
resources, e.g.,
production cost per unit
TI Time indicators
Indicators that represent and evaluate the time of different processes e.g.,
minimum delivery time
PI Productivity indicators
Productivity the indicator allows you to evaluate the operational effi-
ciency e.g., percentage downtime
QI III Quality indicators
These indicators measure the quality of production and effectiveness of
the process e.g.,
the number of errors occurred
HLI High level indicators
These indicators usually show the overall performance of the business
e.g., annual growth
LLI Low level indicators
Low-level indicators are selected to evaluate the team-wise performance
of the employee e.g.,
employee progress
EI External indicators
External indicators again target high-level performance e.g., collective
goal achievement
II Internal indicators
Internal indicators target low-level performance e.g., team-wise perfor-
mance
ICEIS 2023 - 25th International Conference on Enterprise Information Systems
146
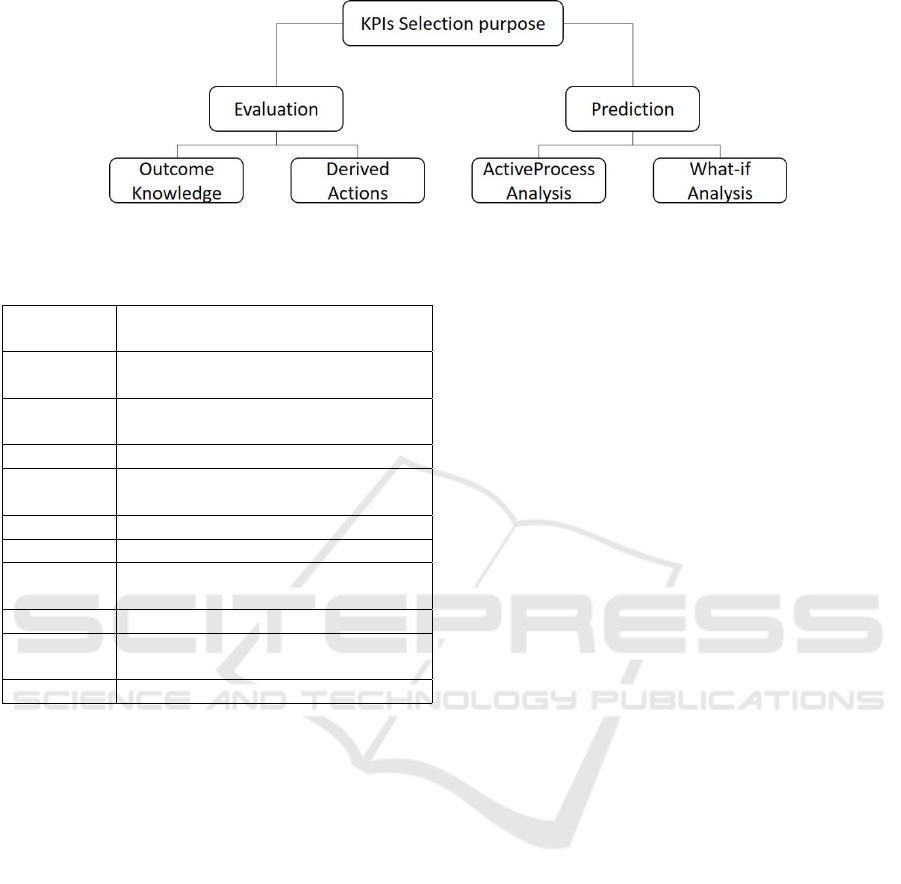
Figure 2: KPIs selection based on the purpose and requirement of organization.
Table 3: KPIs and its Evaluation Parameters along with
Datatypes.
KPIs Cat-
egories
Evaluation Datatypes
Long-
Term
Descriptive (string), Measured
(Double), Measured (integer)
Quantita-
tive
Measured (Double), Measured (inte-
ger)
Dependent N/A
Indepen-
dent
N/A
Cost Currency (string)
Time Time (integer)
Productiv-
ity
Percentage (double)
Quality Grading (string)
High-
Level
Describe (string)
Low-Level Grading (string)
bound to the goals on an hourly basis and do not meet
the generic nature of an indicator. Qualitative indi-
cators depend on qualitative data, which varies from
business to business. External and internal indicators
are mostly covered by high-level and low-level indi-
cators, which are consequently excluded from gener-
alized indicators. In the end, generalized KPIs are ob-
tained based on generalized categories of indicators
and the purpose of the selection.
3.4 KPIs Selection Purpose
KPIs are selected by the high authorities in BPM ac-
cording to the predefined purpose. Additionally, the
selection process also depends on the available infor-
mation regarding involved activities, processes, goals,
and achievements of the business. However, KPIs are
mainly used for the purposes defined in Figure 2.
3.5 Generalization of KPIs
The aim of our proposed methodology is to design
a generalized framework that helps all types of busi-
nesses in their BPM. It is important to design the cat-
egories of indicators for the extraction of the prede-
fined groups of generic KPIs to achieve the aforemen-
tioned goal.
3.6 KPIs Evaluation
After the selection of KPIs categories and subcate-
gories, the second step is to select the correct evalu-
ation mechanism. Consequently, the implementation
of a specific KPI needs the evaluation parameters to
perform the exact analysis. Table 3 explains the as-
sessment evaluation and its data types for selected cat-
egories of KPIs.
3.6.1 Outcome Knowledge
KPI outcome knowledge is a critical component
of successful business management and decision-
making. By having a deep understanding of KPIs and
their outcomes, organizations can make informed de-
cisions, track progress, and continually improve their
performance.
3.6.2 Derived Actions
Derived KPIs actions are powerful tools for busi-
ness management and decision-making, providing a
more comprehensive understanding of a particular as-
pect of the organization. By effectively using de-
rived KPIs, organizations can make informed deci-
sions, track progress, and continually improve their
performance.
3.7 KPIs Prediction
KPI prediction involves analyzing past performance
data, identifying trends and patterns, and using sta-
tistical models to make predictions about future val-
ues. The accuracy of KPI predictions depends on the
quality and availability of historical data, the choice
of appropriate predictive models, and the ability to
accurately capture and account for relevant external
factors that may affect future performance.
Semantic Representation of Key Performance Indicators Categories for Prioritization
147
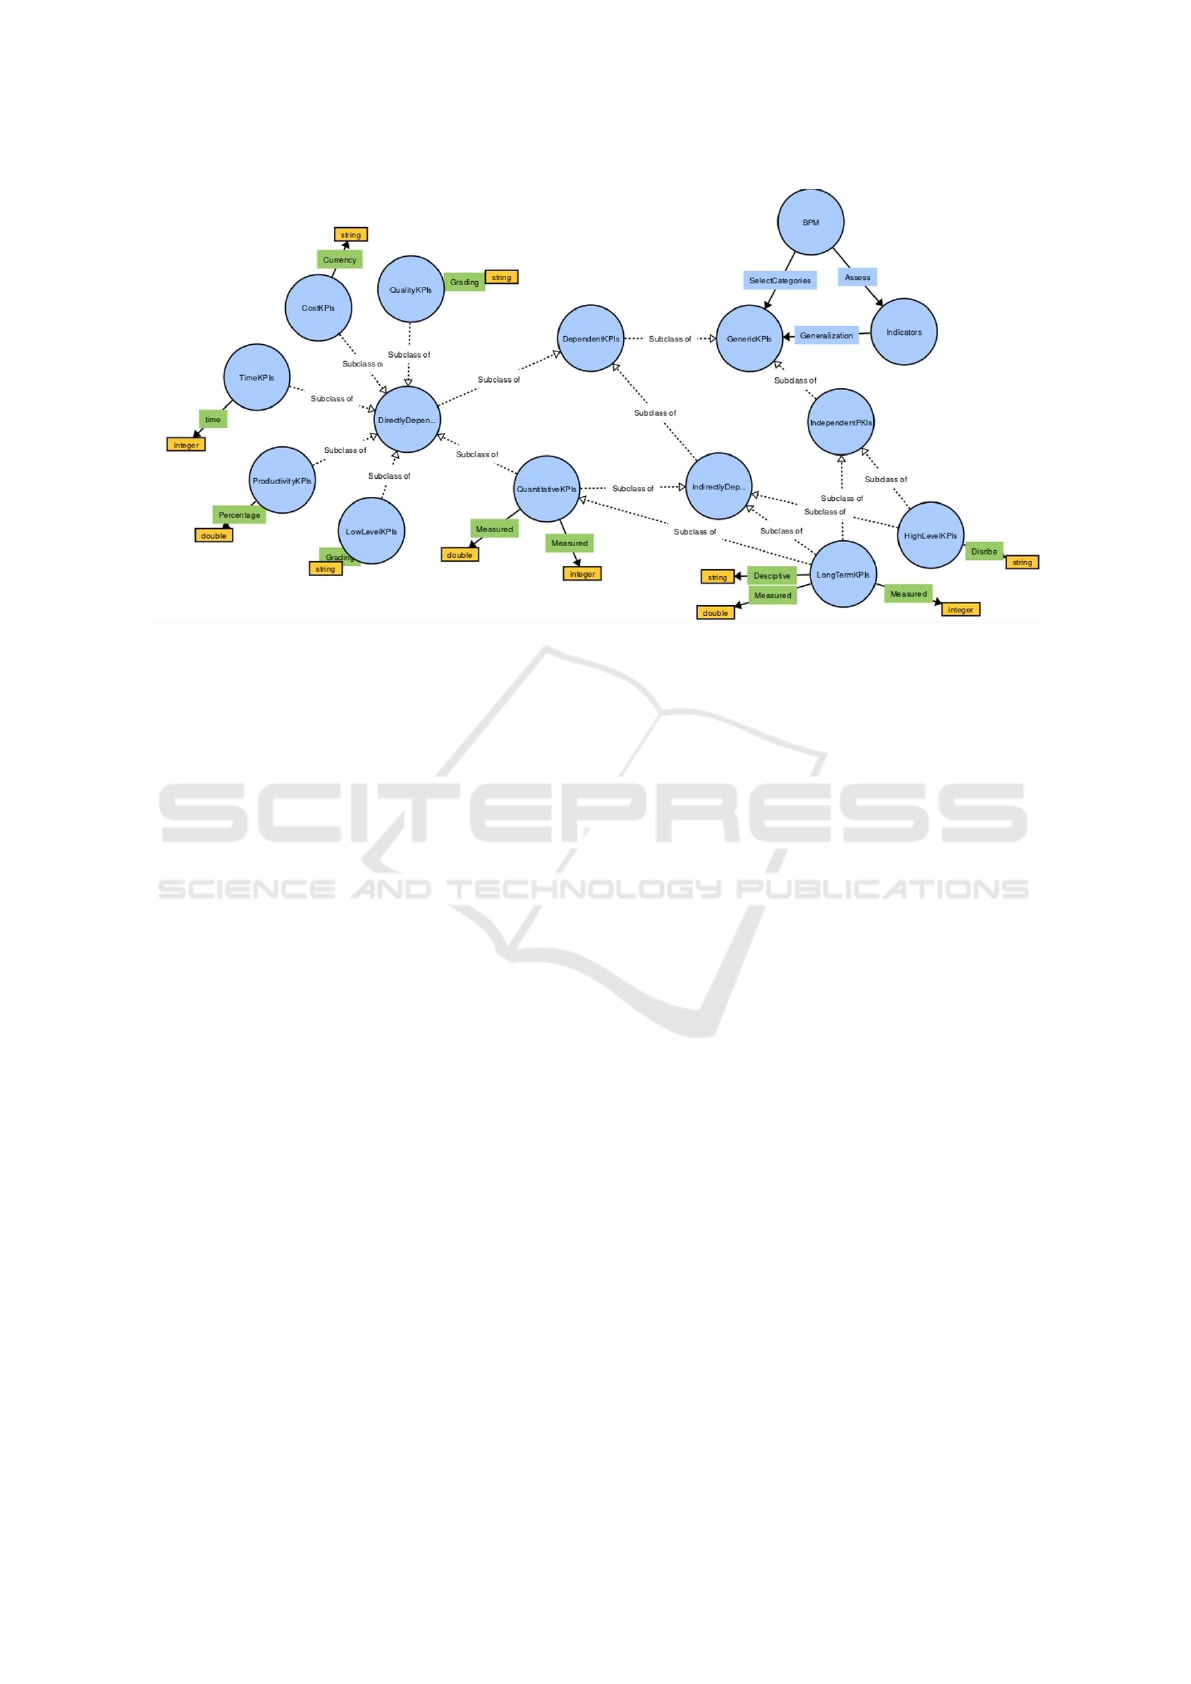
Figure 3: Main Ontology Graphical View.
3.7.1 Active Process Analysis
KPI active process analysis is an important tool for
improving business processes and achieving strategic
objectives. By regularly monitoring and evaluating
KPIs, organizations can identify areas for improve-
ment and make the changes necessary to optimize
processes and increase efficiency.
3.7.2 If Analysis Failed
If a Key Performance Indicator (KPI) analysis fails,
it means that the chosen KPIs were not effective in
measuring the performance of the business processes
they were designed to monitor. In such a scenario,
there are several options that organizations can con-
sider. Few are enumearated below:
Re-evaluate KPIs: The first option is to re-evaluate
the KPIs that were used in the analysis. This may in-
volve changing the KPIs, redefining their objectives,
or adjusting the way they are measured.
Use Alternative Methodologies: If the KPI analy-
sis fails, organizations can consider using alternative
methodologies, such as process mapping, root cause
analysis, or customer satisfaction surveys, to identify
areas of improvement.
Monitor Progress: Finally, organizations should
regularly monitor progress and evaluate the results
of any changes made. This will help to determine
whether the new approach is effective and whether
further adjustments are necessary.
3.8 Ontology (for Semantic
Representation)
This ontology offers all the data requirements for wise
decision-making. As a result, it will enable the acqui-
sition of some guidance regarding the selection and
application of the proper category of KPIs in accor-
dance with the requirements. To put it more precisely,
it first aids the decision-making makers of the KPI
category to be used for business process performance
measurements. Second, the ontology operates at a de-
gree of detail that is sufficient to give a thorough foun-
dation for evaluating the relationships between every
component of the business process. Figure 3 provides
a graphical view of the ontology built by WebVOWL
(Horridge et al., 2009).
Our ontology represents the generic categories of
all related KPIs and aims at facilitating all types of
business processes rather than focusing on a specific
use case. The purpose of this ontology is to find
the semantic relationship between the categories of
generic KPIs which helps to find the execution order
in case of sequential execution to avoid any bottle-
neck. More specifically, this ontology also provides
the assessment tool for the evaluation of KPIs and
their datatypes.
In order to take a more informed decision, it is im-
portant to get and represent more information. There-
fore, we created three main classes (categories) and
subclasses of the main KPIs class to relate the infor-
ICEIS 2023 - 25th International Conference on Enterprise Information Systems
148

Table 4: KPIs categories and its Abbreviation.
Abbreviations KPIs category Abbreviation KPIs category
ST-KPIs Short-term KPIs I-KPIs Independent KPIs
LT-KPIs Long-Term KPIs C-KPIs Cost KPIs
D-KPIs Dependent KPIs T-KPIs Time KPIs
DD-KPIs Directly Dependent KPIs P-KPIs Productivity KPIs
IDD-KPIs Indirectly Dependent KPIs Q-KPIs-II Quality KPIs
Q-KPIs-I Quantitative KPIs LL-KPIs Low-Level KPIs
HL-KPIs High-Level KPIs - -
mation. The subclasses of the main KPIs classes are
related according to their dependencies to linearize
sequential order logically to achieve the aforemen-
tioned objective of this research. To get the order of
execution after selecting a set of required categories
we use a set-based representation which is explained
in the following section.
3.9 Prioritization
For a BPM, it is important to select the potential KPIs
from the generic categories as per the business re-
quirements. But most importantly, the question arises
in which order these KPIs need to be considered to
achieve high performance. This research paper pro-
vides the solution to this question by establishing the
semantic relationship between the generic categories
of KPIs through our ontological representation. More
specifically, we provide the evaluation order of KPIs
as the results of the set-theoretic semantics of onto-
logical relations. KPI Prioritization refers to the pro-
cess of identify and prioritize the most important Key
Performance Indicators (KPIs) for a business. It is
a critical step in performance management as it helps
organizations to focus on the metrics that are most rel-
evant to their goals and objectives.
Set-theoretic semantics defines the interpretation
of concepts (resp. relations) in terms of sets of in-
dividuals (resp. set of pairs of individuals) of a do-
main. In the case of our problem, let us consider the
three parent classes Directly Dependent KPIs, Indi-
rectly Dependent KPIs, and Independent KPIs. The
full logic specification of these categories prescribes
to set a non-disjointness property among them. It
means that in the corresponding Venn diagram the
three sets representing those classes are overlapping.
In order to fully specify the relationships among all
the KPIs classes we first define the short forms of
generic KPIs categories in Table 4.
KPIs categories relations are depicted through
Venn Diagram as three-parent sets and their subsets
(synthesized by their name for simplicity). Figure 4
represents the concept as an intersection among par-
ent sets derived from the ontological representation
of semantic information. As the usage (or calcula-
tion) order of the KPIs generic categories depends on
their interdependency, therefore, the most dependent
categories need to be considered first i.e., the regions
A ∩ B ∩ C. Whereas, the KPIs categories that lie in
A ∩ B or B ∩C or A ∩C need to be considered in the
second order. Lastly, the KPIs categories in the region
A or B or C will be considered in the end. The follow-
ing extracted queue in Figure 4 shows the exact order
of execution based on the generic KPIs categories. To
optimize any business process during BPM, the man-
agers need to select or update the potential KPIs from
the generic categories as mentioned according to the
business requirements. Secondly, the KPIs priority is
to be assigned based on the following queue shown in
Figure 5 to get high performance without any bottle-
neck.
3.9.1 Case Study
A case study on the semantic representation of Key
Performance Indicator (KPI) categories for prioriti-
zation was conducted in a financial organization. The
goal of the study was to develop a more efficient and
effective method for prioritizing KPIs and aligning
them with business goals. The first step of the study
was to conduct a comprehensive review of existing
KPIs and categorize them based on their relevance to
the organization’s goals and objectives. This process
involved identifying all of the KPIs that were cur-
rently being used by the organization and grouping
them into categories based on their relevance to
specific business goals and objectives. Once the KPIs
had been categorized, the next step was to semanti-
cally represent them using a graph-based approach.
This involved creating a visual representation of the
relationships between different KPIs and categories,
with the goal of providing a clearer understanding
of the relationships between different KPIs and the
impact they had on the overall performance of the or-
ganization. The next step was to align them with the
organization’s goals and objectives which ensure that
Semantic Representation of Key Performance Indicators Categories for Prioritization
149
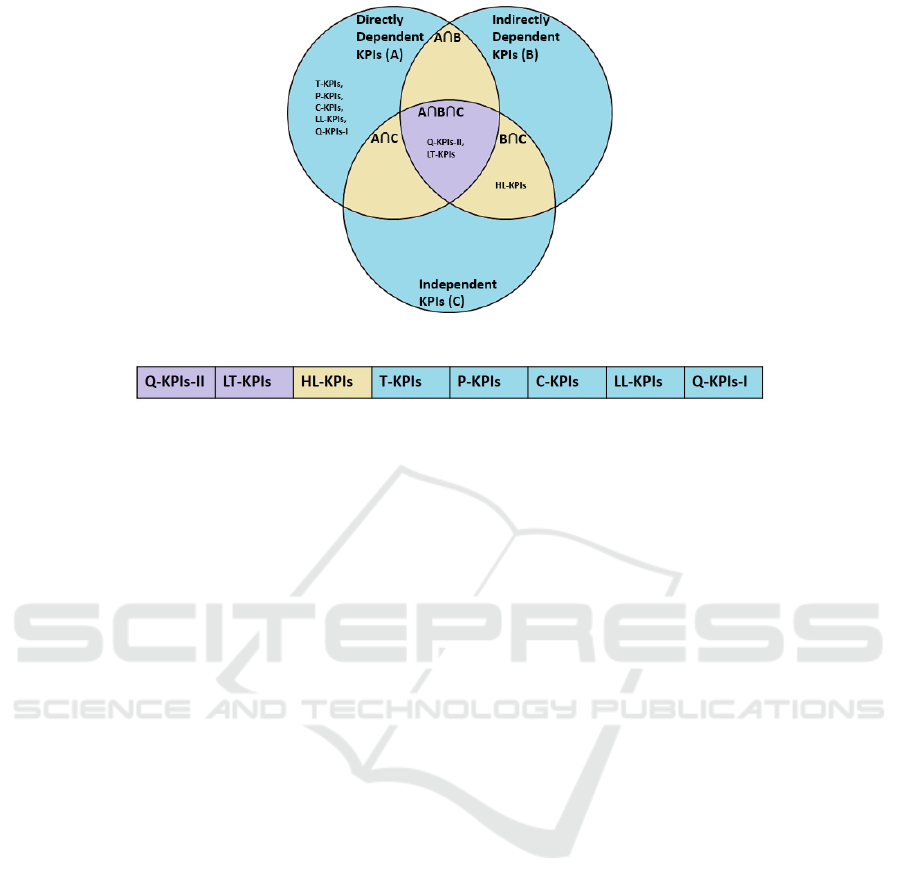
Figure 4: Venn diagram (KPIs categories relational representation).
Figure 5: KPIs Execution Order.
the KPIs were aligned with the specific goals and ob-
jectives.
The case study demonstrated the value of using a
semantic representation of KPIs for prioritization in
a financial organization. This resulted in significant
improvements in their ability to monitor and improve
performance and has laid the foundation for further
progress in the future.
4 CONCLUSIONS
In order to facilitate KPIs advancement management,
this study has given a semantic approach and built
methods based on set theory. In specific, we proposed
using a notion of a KPI advancement pattern and a
KPI advancement meta-model, made up of two in-
terrelated views, to facilitate KPIs development. The
long-term research project’s main objective is to build
a generic framework for handling KPIs advancement.
The main highlights of this paper are: (i) Used a se-
mantic ontology to express KPIs. (ii) KPI levels were
chosen using the set theory concept. (iii) KPI Priori-
tization. In the future study, we will create a semantic
Business Process (SBP) monitor and adapt an exist-
ing SBP modeling tool to incorporate the suggested
technique as well.
REFERENCES
Ahmad, A. C. and Jusoh, M. A. (2014). Institutional own-
ership and market-based performance indicators: Uti-
lizing generalized least square estimation technique.
Procedia-Social and Behavioral Sciences, 164:477–
485.
Albliwi, S. A., Antony, J., and halim Lim, S. A. (2015). A
systematic review of lean six sigma for the manufac-
turing industry. Business Process Management Jour-
nal, 21(3):665–691.
Amor, E. A. E. H. and Ghannouchi, S. A. (2017). Toward an
ontology-based model of key performance indicators
for business process improvement. In 2017 IEEE/ACS
14th International Conference on Computer Systems
and Applications (AICCSA), pages 148–153. IEEE.
Andaloussi, A. A., Burattin, A., Slaats, T., Kindler, E., and
Weber, B. (2020). On the declarative paradigm in hy-
brid business process representations: A conceptual
framework and a systematic literature study. Informa-
tion Systems, 91:101505.
Azapagic, A. (2003). Systems approach to corporate sus-
tainability: a general management framework. Pro-
cess Safety and Environmental Protection, 81(5):303–
316.
Cognini, R., Corradini, F., Gnesi, S., Polini, A., and Re,
B. (2018). Business process flexibility-a systematic
literature review with a software systems perspective.
Information Systems Frontiers, 20(2):343–371.
Cortes, H., Daaboul, J., Le Duigou, J., and Eynard, B.
(2016). Strategic lean management: Integration of
operational performance indicators for strategic lean
management. IFAC-PapersOnLine, 49(12):65–70.
Dadam, P. and Reichert, M. (2009). The adept project: a
decade of research and development for robust and
flexible process support. Computer Science-Research
and Development, 23(2):81–97.
Diamantini, C., Potena, D., and Storti, E. (2016). Sempi:
A semantic framework for the collaborative construc-
tion and maintenance of a shared dictionary of perfor-
mance indicators. Future Generation Computer Sys-
tems, 54:352–365.
Dom
´
ınguez, E., P
´
erez, B., Rubio, A. L., and Zapata, M. A.
(2019). A taxonomy for key performance indica-
ICEIS 2023 - 25th International Conference on Enterprise Information Systems
150

tors management. Computer Standards & Interfaces,
64:24–40.
Domınguez, E., P
´
erez, B., Rubio, A. L., and Zapata, M. A.
(2020). Towards a framework for kpi evolution.
Ferreira, W. d. P., Silva, A. M. d., Zampini, E. d. F., and
Pires, C. (2017). Applicability of the lean thinking in
bakeries. Espacios, 38(2).
Haponava, T. and Al-Jibouri, S. (2012). Proposed sys-
tem for measuring project performance using process-
based key performance indicators. Journal of man-
agement in engineering, 28(2):140–149.
Hoang, H. H., Tran, P.-C. T., and Le, T. M. (2010). State of
the art of semantic business process management: An
investigation on approaches for business-to-business
integration. In Asian Conference on Intelligent In-
formation and Database Systems, pages 154–165.
Springer.
Horridge, M., Jupp, S., Moulton, G., Rector, A., Stevens,
R., and Wroe, C. (2009). A practical guide to build-
ing owl ontologies using prot
´
eg
´
e 4 and co-ode tools
edition1. 2. The university of Manchester, 107.
Horv
´
athov
´
a, J., Mokri
ˇ
sov
´
a, M., Suh
´
anyiov
´
a, A., and
Suh
´
anyi, L. (2015). Selection of key performance
indicators of chosen industry and their application
in formation of creditworthy model. Procedia Eco-
nomics and Finance, 34:360–367.
Kaganski, S., Majak, J., Karjust, K., and Toompalu, S.
(2017). Implementation of key performance indica-
tors selection model as part of the enterprise analysis
model. Procedia Cirp, 63:283–288.
Konsta, K. and Plomaritou, E. (2012). Key performance in-
dicators (kpis) and shipping companies performance
evaluation: The case of greek tanker shipping compa-
nies. International Journal of Business and Manage-
ment, 7(10):142.
Ndadji, M. M. Z., Tchendji, M. T., Djamegni, C. T., and
Parigot, D. (2020). A language and methodology
based on scenarios, grammars and views, for admin-
istrative business processes modelling. arXiv preprint
arXiv:2010.13347.
Park, J. H. J., Kim, J., Zou, D., and Lee, Y. S. (2012). In-
formation Technology Convergence, Secure and Trust
Computing, and Data Management: ITCS 2012 &
STA 2012, volume 180. Springer Science & Business
Media.
Parmenter, D. (2015). Key performance indicators: devel-
oping, implementing, and using winning KPIs. John
Wiley & Sons.
Pasic, F., Wohlers, B., and Becker, M. (2019). Towards
a kpi-based ontology for condition monitoring of au-
tomation systems. In 2019 24th IEEE International
Conference on Emerging Technologies and Factory
Automation (ETFA), pages 1282–1285. IEEE.
RabahAzzam, S. and Zhou, S. (2012). Semantic web ap-
proach for organizations management.
Rajsiri, V., Lorr
´
e, J.-P., B
´
enaben, F., and Pingaud, H.
(2008). Collaborative process definition using an
ontology-based approach. In Working Conference on
Virtual Enterprises, pages 205–212. Springer.
Sahno, J., Shevtshenko, E., Karaulova, T., and Tahera,
K. (2015). Framework for continuous improvement
of production processes. Engineering Economics,
26(2):169–180.
Sebubi, O., Zlotnikova, I., and Hlomani, H. (2019). A
lightweight version of national performance indicator
ontology (npionto). In 2019 Conference on Next Gen-
eration Computing Applications (NextComp), pages
1–6. IEEE.
Shanthi Bala, P. and Aghila, G. (2019). Q-genesis: Question
generation system based on semantic relationships. In
Advances in Big Data and Cloud Computing, pages
509–517. Springer.
Thapar, P. and Sharma, L. S. (2022). Implementing sparql-
based prefiltering on jena fuseki tdb store to reduce the
semantic web services search space. In Evolutionary
Computing and Mobile Sustainable Networks, pages
319–333. Springer.
Trompenaars, F. and Coebergh, P. (2014). 100+ man-
agement models: How to understand and apply the
world’s most powerful business tools. Infinite Ideas
Limited.
Tsai, Y.-C. and Cheng, Y.-T. (2012). Analyzing key perfor-
mance indicators (kpis) for e-commerce and internet
marketing of elderly products: A review. Archives of
gerontology and geriatrics, 55(1):126–132.
Van Der Aalst, W. M. and Ter Hofstede, A. H. (2005). Yawl:
yet another workflow language. Information systems,
30(4):245–275.
Semantic Representation of Key Performance Indicators Categories for Prioritization
151
