
Customisable Fault and Performance Monitoring Across Multiple Clouds
Giuseppe Bisicchia
1 a
, Stefano Forti
1 b
, Alberto Colla
2
and Antonio Brogi
1 c
1
Department of Computer Science, University of Pisa, Pisa, Italy
2
Consortium GARR, Roma, Italy
Keywords:
Cloud Computing, Fault Monitoring, Performance Monitoring, Declarative Management, OpenStack.
Abstract:
Monitoring the proper functioning and performance of an infrastructure spanning multiple Cloud datacentres
is challenging. It requires continuously aggregating monitored data across multiple source machines and pro-
cessing them so to obtain useful alerts and insights. In this article, we propose a simple open-source prototype
tool to perform highly customisable fault and performance monitoring across multiple Clouds. Differently
from commercial tools, our prototype is simpler to deploy and it can be configured through a declarative ap-
proach, by simply specifying data monitoring tasks and aggregation policies. We illustrate such peculiarities
over a use case relying on three datacentres under the Italian Research and Education Network Consortium.
1 INTRODUCTION
Cloud providers rely on multiple datacentres (DCs)
distributed across various geographical regions. To
guarantee proper functioning and availability of their
resources, Cloud providers continuously monitor the
health of their infrastructure against faults and per-
formance degradation as dictated by Service Level
Objectives (SLOs) (Ding et al., 2019). For instance,
application response times, failure rates and net-
work throughput and latency are among fundamen-
tal SLOs (Nastic et al., 2020). Through monitoring,
Cloud administrators can avoid service downtime and
provide their users with suitable Quality of Service
(QoS) (Odun-Ayo et al., 2018).
Cloud monitoring tools should therefore be able
to promptly detect, collect and report failing services
or infrastructure assets, which might indicate one or
more problems (Aceto et al., 2013). However, moni-
toring data generated by Cloud DCs can be very large
and heterogeneous. Thus, monitoring tools also need
to present such collected data in a way that deliv-
ers a simple, yet insightful, vision of the system’s
global state. They should offer a mechanism to aggre-
gate monitored data across multiple geographically
distributed Virtual Machines (VMs) so as to assem-
ble a single picture of the system’s health (Zareian
et al., 2016). Also, SLO violations must be reported
a
https://orcid.org/0000-0002-1187-8391
b
https://orcid.org/0000-0002-4159-8761
c
https://orcid.org/0000-0003-2048-2468
in quasi real-time so to ensure that Cloud providers
can promptly act to solve them.
Last, Cloud SLOs evolve over time along with
Cloud assets. For instance, the availability of GPUs
or an update on the physical network can cause an
improvement in the SLOs. Consequently, monitoring
systems should be easily extensible and customisable,
offering a simple way for Cloud administrators to add,
remove and update monitored metrics and SLOs.
In this article, we propose CloudWatcher, a simple
open-source
1
prototype to perform highly customis-
able fault and performance monitoring across mul-
tiple Clouds through a declarative and task-oriented
approach, enabling monitoring custom metrics. Cus-
tomisation, indeed, allows Cloud administrators to
easily adapt the monitoring metrics to their needs
and requirements. Our prototype is equipped with a
Telegram-based alert system and a Web GUI based on
Node-RED that permits visualising the encountered
faults, the current values of the SLO metrics and their
evolution over time. CloudWatcher is also assessed
over a real use case within a significant portion (3 geo-
graphic areas) of the Cloud powered by the Italian Re-
search and Education Network Consortium (GARR).
The rest of this article is organised as follows.
First, Section 2 illustrates the design and implemen-
tation of CloudWatcher. Then, Section 3 showcases
a real use case exploiting CloudWatcher to monitor
a portion of the GARR infrastructure. Finally, Sec-
1
Freely available at: https://github.com/di-unipi-socc/
cloudWatcher
212
Bisicchia, G., Forti, S., Colla, A. and Brogi, A.
Customisable Fault and Performance Monitoring Across Multiple Clouds.
DOI: 10.5220/0011849500003488
In Proceedings of the 13th International Conference on Cloud Computing and Services Science (CLOSER 2023), pages 212-219
ISBN: 978-989-758-650-7; ISSN: 2184-5042
Copyright
c
2023 by SCITEPRESS – Science and Technology Publications, Lda. Under CC license (CC BY-NC-ND 4.0)

tions 4 and 5 discuss some related work and draw
some conclusions, respectively.
2 DESIGN & IMPLEMENTATION
CloudWatcher’s Design. CloudWatcher aims at
monitoring customised health and performance met-
rics (e.g., service availability and response time, sta-
tus of the network, throughput of a VM’s disk) of
multi-Cloud systems, by providing configurable alerts
associated with such measurements, and it is extensi-
ble to accommodate further metrics. Such an objec-
tive is pursued through a simple declarative and mod-
ular methodology for monitoring multiple DCs.
CloudWatcher relies on a set of distributed agents,
called Managers, deployed in each monitored DC
2
.
Managers exploit some dedicated Virtual Machines,
called Probes, that are deployed across all DCs and
periodically queried by their Manager to collect data
on failures and performance. Last, Probes run in dif-
ferent types, according to the VM types available in
each Cloud datacentre (e.g. tiny, medium, large) the
OS they run (e.g. Ubuntu, CentOS), and their purpose
(e.g. backup, database).
Fig. 1 shows an example deployment of Cloud-
Watcher across two DCs (viz., cloud1 and cloud2).
Managers self-organise into independent overlay net-
works with their Probes across the different DCs.
Each Manager requires at least one Probe of each
considered type in each DC. For instance, Manager
M
1
connects with two Probes of types T
1
and T
2
in
cloud1 and two Probes of types T
1
and T
2
in cloud2.
Similarly M
2
exploits two Probes of types T
1
and T
2
in
cloud1 and two Probes of types T
1
and T
2
in cloud2.
Indeed, for each deployment, all the Managers must
deploy the same set of Probe types, in order to collect
homogeneous data in the different DCs.
3
The main duty of a Manager is to build a picture
of the health of the monitored system from the point
of view of the DC in which the Manager is deployed.
A Manager constructs its view of the system by cre-
ating, interacting with, and deleting Probes. Admin-
istrators can both design each Probe as a passive or
active entity.
2
At least one Manager must be deployed in each DC
of the monitored infrastructure for CloudWatcher to work
properly. It is also possible to deploy multiple Managers
per DC to provide greater robustness and fault tolerance and
enable parallel data collection.
3
To better support the possible heterogeneity among the
different clouds (e.g. different VM flavours). It is possible
to exploit another CloudWatcher deployment where a dif-
ferent type T
3
is considered.
Figure 1: Example of a CloudWatcher deployment.
Figure 2: Task execution diagram.
A passive Probe exists only as a function of its
manager to collect fault and performance data. As an
example, passive Probes can be used to monitor the
time required to execute a remote script or the net-
work’s bandwidth and latency. On the contrary, an
active Probe, in addition to interacting with its Man-
ager, can also carry out its own activities, e.g., exe-
cute one or more services, manage a database. This
mode allows the measurement of the performance of
the possible services and/or activities carried out by
the Probe. In this case, the type of Probe, as well
as the characteristics of the VM, can also indicate the
type of services offered. For instance, active Probes
can be used to monitor the performance and space ex-
ploited by a database or the time required.
Interactions between a Manager and a Probe oc-
cur through Tasks. A Task is a particular activity ini-
tiated by a Manager (e.g., remote script execution,
deletion of a VM). Through the execution of a Task
(and the possible interactions with the Probe), the
Manager collects qualitative and quantitative infor-
mation as well as errors and encountered faults.
Each Manager works in parallel and indepen-
dently from the others to guarantee better scalability
and robustness. The failure of a Manager or a par-
ticular Task does not affect the operations of other
Managers nor the execution of other Tasks. The in-
dependence between different Managers and Probes
also contributes to minimising the footprint of Cloud-
Watcher, avoiding interactions that do not strictly
concern the execution of a Task and, hence, reducing
generated network traffic.
Customisable Fault and Performance Monitoring Across Multiple Clouds
213

Each Manager periodically starts a monitoring
step to perform the Tasks related to each controlled
Probe. The sequence of Tasks is determined by the
Probe type, i.e., the same Task sequence is performed
for all the Probes of a certain type. For each Task, the
execution is divided into two phases (Fig. 2):
1. Data Collection, the Manager executes the Task
activity, according to a data collection function,
collecting all the relevant information (e.g., per-
formance, faults). This phase is performed in
parallel and independently for all the controlled
Probes.
2. Data Aggregation, the collected data are aggre-
gated based on a Task’s aggregation policy. Both
the Data Collection function and the Aggregation
policy are defined by the Cloud administrators.
Finally, the aggregated data as well as the data col-
lected individually from every single Probe, are
stored in a NoSQL database, leaving them avail-
able for further analyses and to be appropriately
displayed through an alert system or a dashboard.
The possibility of using different types of Probes
allows administrators to evaluate the same Tasks un-
der different VM configurations or even develop dif-
ferent Tasks for different Probe types. Moreover, the
aggregated vision by Cloud enables a simple and ef-
fective assessment of the health of each DC from the
point of view of a particular Manager and DC.
Note that CloudWatcher is designed considering
that each Manager deploys Probes on every single
DC, hence, ensuring redundancy in both the Man-
agers and the Probes. Although an architecture where
each Manager deploys Probes only on its DC is possi-
ble, such a choice reduces the flexibility and the fault
tolerance of the system. In our design, a Manager that
interacts directly with its Probes, scattered through all
the DCs, can perform a complete assessment of the
connectivity between DC pairs, making it possible for
each Manager to execute Tasks in any DC, without the
need of relying on the other Managers. Such a design
ensures independence between Managers and conse-
quently improves the fault tolerance of CloudWatcher.
At the same time, an architecture in which Managers
have Probes only in their DC requires frequent ex-
change of data between them to keep updating each
Manager about the health of other DCs, without re-
ducing the overhead of CloudWatcher, in which Man-
agers directly interact with Probes in all DCs.
CloudWatcher’s Implementation. CloudWatcher
is implemented in Python3 leveraging the Fabric and
OpenStack SDK libraries that enable the interactions
through SSH between machines and with Cloud ser-
vices. The prototype was designed to interact with
OpenStack Clouds, i.e. the most popular open-source
Cloud platform.
CloudWatcher features a declarative and fault-
tolerant interface to the functionalities offered by Fab-
ric and OpenStack SDK. It has been designed to make
available high-level, declarative operations for man-
aging Virtual Machines (e.g., running a script, creat-
ing and initialising a VM). At the end of the execution
of each function of the interface, a Report object is
returned. It contains information on the possible er-
rors encountered during its execution, the execution
time and the number of iterations to complete.
Thanks to its interface, CloudWatcher also pro-
vides a way for Cloud administrators to specify cus-
tomised Tasks as Python functions. A Task is com-
posed of a data collection function and an aggregation
policy both in the form of two Python functions. The
collection function exploits the CloudWatcher’s inter-
face to perform its activity, which may require, for
instance, the execution of one or more commands in
a Probe or, in general, interaction with it and/or with
the Cloud services. In this case, when commands are
executed in the Probes, the output is printed in the
stdout, which is caught by Fabric and then further
processed by the Manager’s collection function.
CloudWatcher can be configured by providing it
with the following files:
clouds.yaml, required by OpenStack to work with
Cloud services, is “a configuration file that con-
tains everything needed to connect to one or more
clouds. It may contain private information and is
generally considered private to a user”.
4
config.ini, contains all the configuration parame-
ters of CloudWatcher including the clouds to mon-
itor, the type of Probes to use, how many ma-
chines per type to deploy per Manager and the
number of Managers per Cloud to use. Through
this file, it is possible to configure different de-
ployments of CloudWatcher.
machines.json, used by the Cloud administrators to
manage declaratively the available Probe’s types
and the related Tasks. For each Probe type, the
VM flavour and OS, as well as the local files to
export to the remote machine, the access key pairs
and the security groups are defined. Furthermore,
for each type, a list of scenarios is declared, where
each scenario is a list of Tasks.
5
Finally, for each
4
From the OpenStack Documentation:
https://docs.openstack.org/python-openstackclient/pike/
configuration/index.html
5
Tasks within a scenario are executed in parallel, while
the scenarios, instead, are executed sequentially. Before
CLOSER 2023 - 13th International Conference on Cloud Computing and Services Science
214

Task, it is possible to define some Service Level
Objectives both for the data collected by the exe-
cution of a task and for the aggregated ones. SLOs
can be declared by specifying the maximum or
minimum value allowed (e.g., the maximum la-
tency, the minimum success ratio for a Cloud ser-
vice operation, the maximum number of tolerated
faults) beyond which there is a violation. It is also
possible to specify a series of threshold values as
SLO, associating each of them with a label indi-
cating the severity of the violation.
Finally, we developed a Web GUI with an alert
system via Telegram notifications (Fig. 3). The Web
GUI is implemented with Node-RED and shows the
information on the last report received, the SLO vio-
lations and the evolution over time of the task mea-
surements, divided by Cloud and type of Probe pairs
and by Managers. The data can be consulted by speci-
fying the search period and the Task name and option-
ally filtering by the cloud-type pair and/or a particular
Manager. Furthermore, as soon as a report contain-
ing SLO violations is received, it is shown in the form
of timed notifications in the dashboard. Moreover,
we developed also an alert system through a Tele-
gram channel in which the detected SLO violations
are automatically published in real-time. We decided
to develop our own Web GUI and alert system only to
have interfaces able to show all the features of Cloud-
Watcher. However, it is possible to connect Cloud-
Watcher to different types of GUIs (e.g., Graphana)
elaborating and rendering the published reports.
3 USE CASE
Use Case Objective. In this section, we discuss a
use case of CloudWatcher within a portion of the
Italian Research and Education Network Consortium
(GARR) Cloud, consisting of three DCs in Naples,
Palermo and Catania. The objective of this use case is
to illustrate how CloudWatcher can be used to moni-
tor the health of the network between DCs as well as
that of the deployed VMs and Cloud services.
In particular with our deployment we use Cloud-
Watcher to monitor:
• the VM disks I/O performance through simple
stress tests;
• the featured network latency and available upload
and download bandwidth;
• the required average time and success rate of SSH
requests to the VMs, and
moving from one scenario to the next, all the Tasks of the
previous scenario must be completed.
• the required average time and success rate fea-
tured to create, configure and delete VMs.
Besides, we aim at assessing those metrics while
considering different versions of the Ubuntu OS, so to
spot possible differences.
Use Case Setup. We deployed a Manager for each
DC viz., Naples, Palermo and Catania. As for the
Probes, two types were developed
6
, each of them
based on a VM with 1 vCPU, 6GB of RAM and 20GB
of disk. In one of the two types, the OS used was
Ubuntu 20.04, while Ubuntu 22.04 was used in the
other. For each type of Probe, each Manager de-
ployed two VMs per DC, for a total of 3 overlay net-
works each of 13 nodes (12 Probes and 1 Manager).
Fig. 4 illustrates an excerpt of the actual
machines.json file developed for the use case. The
key pairs (line 1) and the security groups (lines 2–11)
are both defined declaratively and their reference used
inside the Probe’s type cw-probe-small-20 (lines
17, 19). The tokens (line 12), instead, are used as
variables inside the machines.json file. The Probe
type features a set of named scripts (e.g., setup, line
20). In this way, it is possible to request the exe-
cution of a script in the VM only using the script
name. Note that for the network task (lines 23–
33), we declared the data collection function (i.e.,
probe network, line 24) and the aggregation policy
(i.e., aggregate network, line 26). Inside the aggre-
gation policy, we defined some SLOs for the aggre-
gated latency (line 28) and the bandwidth (lines 29–
31). For each Task, it is also possible to provide some
optional arguments to pass in input to the data collec-
tion function (line 35). Last, we can define a script
(line 36), to be executed during the VM setup phase,
containing the commands necessary for allowing the
Task execution
7
.
Experiment Execution. To accomplish our first ob-
jective we decided to measure the disk I/O per-
formance by exploiting the Fio open-source tool.
As shown in Fig. 5 the data collection function is
disk
performance (lines 27–40) through which we
execute in the Probe machine the fio command (a
script in the type declaration inside machines.json),
substituting on the command the token <SIZE> with
6
The machines.json used is available at:
https://github.com/di-unipi-socc/cloudWatcher
7
The possibility of defining a setup subsequence within
the Tasks and not only within the main setup script (line 20)
has been made available to have greater separation of con-
cerns, allowing to clearly identify why certain commands
are part of the setup and, therefore, improving the readabil-
ity and maintainability of the machines.json file.
Customisable Fault and Performance Monitoring Across Multiple Clouds
215
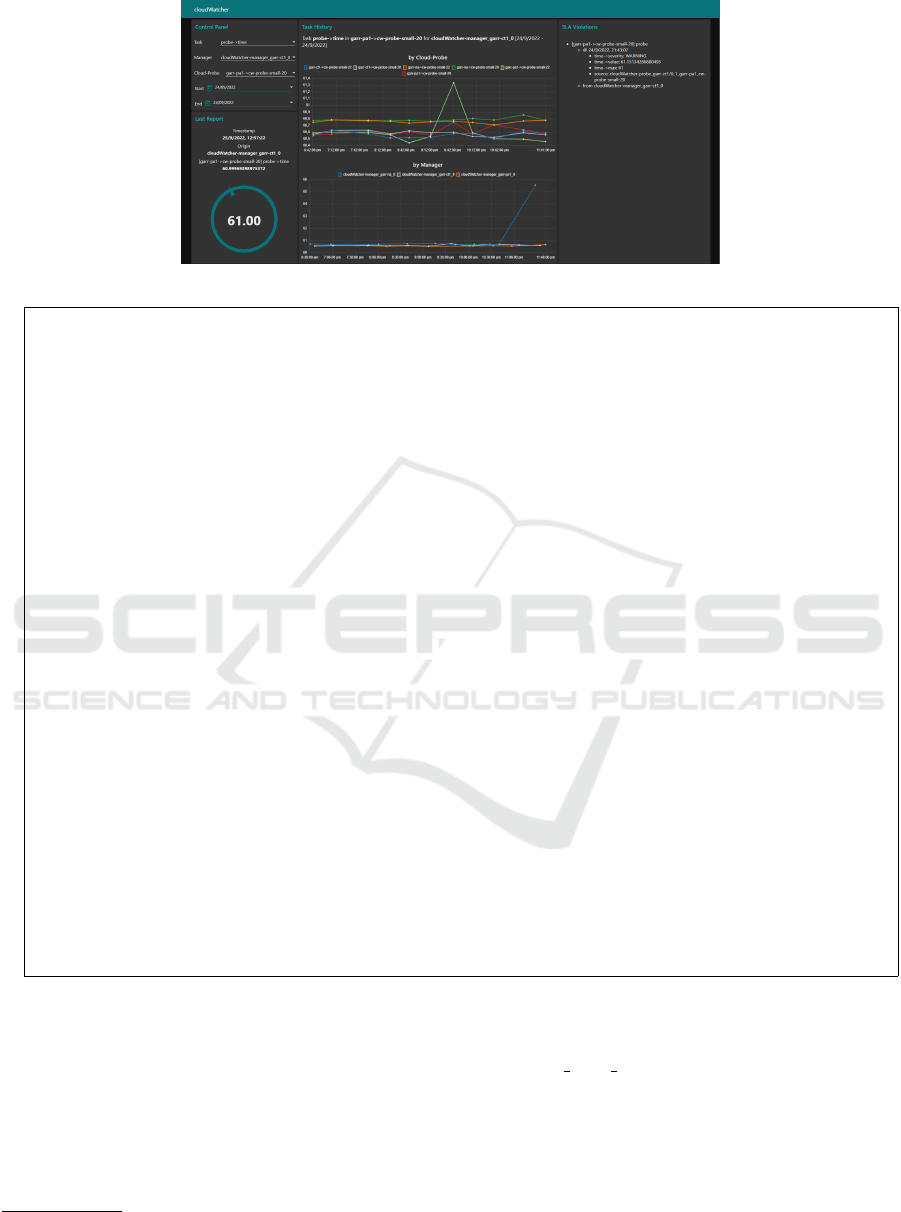
Figure 3: The CloudWatcher’s dashboard.
1 {"keypairs": {"socc": {"public_key": KEY, "key_filename": PATH_TO_PEM_FILE, "user": "ubuntu"}},
2 "security_groups": {
3 "CloudWatcher-sec-group": {
4 "description": "CloudWatcher security group",
5 "rules": [{
6 "protocol": "TCP",
7 "port_range_min": 22,
8 "port_range_max": 22,
9 "remote_ip_prefix": "0.0.0.0/0",
10 "direction": "ingress",
11 "ethertype": "IPv4"}]}},
12 "tokens":{"<BASEPATH>": "/home/ubuntu/cloudWatcher"},
13 "machines": {
14 "cw-probe-small-20": {
15 "image": "Ubuntu 20.04 - GARR",
16 "specs": {"vcpus": 1, "ram": 6000, "disk": 20},
17 "key_name": "socc",
18 "network": "default",
19 "security_groups": ["CloudWatcher-sec-group"],
20 "scripts": {"setup": ["sudo apt update","sudo apt -f install -y"]},
21 "files": [{"source": "./key.pem", "destination": "<BASEPATH>/key.pem"}],
22 "tasks": [[{
23 "name": "network",
24 "function": {"name": "probe_network"},
25 "aggregate": {
26 "name": "aggregate_network",
27 "slo":{
28 "latency":{"avg": {"max": 5}},
29 "bandwidth":{
30 "upload":{"avg": {"min": [[500000000, "WARNING"], [2000000000, "CRITICAL"]]}},
31 "download":{"avg": {"max": [[500000000, "WARNING"], [2000000000, "CRITICAL"]]}}}}},
32 args": [],
33 "setup": ["sudo apt install -y iperf3","sudo iperf3 -s -D"]}],]},}
Figure 4: An example of machines.json.
the actual size required for the file contained in args
(line 38). The output of fio is then parsed to extract
a JSON object (lines 39–40). Generally speaking, a
data collection function takes as input the data of the
target Probe machine (i.e., an OpenStack Server ob-
ject
8
) and a series of possible optional arguments and
outputs a dictionary representing the collected data.
8
From the OpenStack Documentation:
https://docs.openstack.org/openstacksdk
Aggregation is done by the
aggregate disk performance function (lines
41–45) which averages the numerical values and
stores a single copy of the other (line 43). The
success rate is also calculated by computing how
many times the tool completes its execution correctly
(line 44). Generally speaking, the aggregation policy
is defined by a function that takes as input a list of
the dictionaries obtained in output from the execution
CLOSER 2023 - 13th International Conference on Cloud Computing and Services Science
216

37 def disk_performance(machine, args):
38 report = machines.exec_script(machine.name, "fio_cmd", {"<SIZE>": args}).to_dict()
39 dict = "\n".join((report["data"].split("\n"))[2:-2]) #parse the stdout
40 return json.loads(dict)
41 def aggregate_disk_performance(ls):
42 new_ls = [l for l in ls if l != {} and l is not None]
43 res = average_dicts(new_ls) #compute the average of the numeric values
44 res["success"] = float(len(new_ls) / len(ls)) * 100
45 return res
Figure 5: The python functions of the disk performance Task.
of the associated data collection function, on all the
Probes of the same type and in the same DC and out-
puts a single dictionary that aggregates the obtained
data, possibly adding, removing or extending the
existing fields.
In such a way we are able to develop a simple Task
to assess the disk performance with only a few lines
of code, most of them dedicated to parsing the output
of the fio command.
To accomplish our second objective, the perfor-
mance of the network is measured in terms of featured
latency and available upload and download band-
width. Latency is calculated by measuring the ping
from the Manager to the Probe. As regards the band-
width, the iperf3 tool is used.
9
Also in this case, the
aggregation is done by averaging each parameter and
computing the success rate of the measurements.
To accomplish the third objective, as illustrated in
Fig. 6, the Manager requests via SSH the execution
of a simple script on the Probe (line 47) in which the
script name is defined in args. Then the performance
is calculated in terms of execution time, the number
of iterations required and how many and which errors
were possibly encountered, divided by the type of er-
ror. In the aggregate (lines 55–56), the success rate
and the average of the measurements are calculated,
and the errors are added together.
Even in this case, we fulfil our objective with only
a few lines of code, most of them dedicated to parsing
the reports.
Finally, we accomplish the fourth objective, delet-
ing each Probe’s VM with a probability of 50%, and
then creating a new equivalent Probe, so as to assess
the deployment process of the VMs. After being cre-
ated, the setup script and related task setups are run
in the new Probe. The performance of both deletion
and creation is measured in terms of times, iterations
required and errors. In addition, the same parameters
are also measured with regard to the execution of the
setup script. Finally, the time elapsing between the
9
In the setup phase of the probe machine, an iperf3
server is opened to carry out the measurements.
creation of the VM and the first successful access via
SSH to the Probe is considered.
Lessons Learnt. Our CloudWatcher deployment in
the GARR Cloud allows us to easily develop custom
declarative Tasks to monitor the required network and
Cloud performance, with only a few tens of lines of
code per Task. Furthermore, we are able to notice
in near real-time changes in the network performance
as well as to spot in good time, thanks to our alert
system, failures on the Cloud services, in the Cloud
stack or connectivity issues among DCs, and to cir-
cumscribe the faults both in time and space (i.e., in
which DC). At the same time, through the dashboard,
we were able to highlight the differences in perfor-
mance between the three DCs as regards the network
and the performance of the offered services and VMs.
CloudWatcher proved to be enough extensible to
easily support the development of different Tasks sim-
ply and straightforwardly. At the same time, also the
declarative management of the Probes thanks to the
machines.json file proved to be pretty easy.
Although the customisability of CloudWatcher,
through the concepts of Probes’ types and Tasks, al-
lows Cloud administrators to easily develop, change
and adapt the monitoring activities to their needs, a
factor that may hinder the applicability of our pro-
posal could be found in the requirements for Cloud
administrators, to develop, as discussed in this sec-
tion, their own monitoring activities. However, it
could be useful to build a shared repository of com-
mon activities to be used in a plug&play fashion or to
easily adapt to specific needs.
4 RELATED WORK
Cloud monitoring is a widely studied topic, with var-
ious proposals for prototypes and commercial tools
(Aceto et al., 2013; De Chaves et al., 2011; Moses
et al., 2011). In (Fatema et al., 2014; Alhamazani
et al., 2015) and (Ward and Barker, 2014) some of the
Customisable Fault and Performance Monitoring Across Multiple Clouds
217
46 def exec_script(machine, args):
47 report = machines.exec_script(machine.name, args).to_dict()
48 return {"success": 100 if report["status"] is True else 0,
49 "time": report["time"],
50 "iterations": report["iterations"],
51 "errors": report["errors"],
52 "#errors": {
53 "per_type": len(report["errors"]),
54 "total": sum([int(report["errors"][e]) for e in r["errors"]])}}
55 def aggregate_script(ls):
56 return aggregate_reports(ls)
Figure 6: The python functions of the exec script Task.
most popular are discussed and compared.
Among the commercial tools, Prometheus
10
and
Graphite
11
are two of the most used. However,
both are oriented towards storing numeric samples for
named time series, with at most a set of labelled di-
mensions.
Various tools rely on plugins to extend their mon-
itoring capabilities, each system with different com-
plexity and degrees of freedom. In OpenNebula
(Miloji
ˇ
ci
´
c et al., 2011), for example, it is possible
to collect information relevant to the hosts and the
VMs, by executing on them a set of probe programs.
The management of the probe’s programs, however,
is done through the file system with limited flexibility.
With a similar approach, Logic Monitor
12
, Nagios
13
and Zabbix
14
, can be extended through user-defined
scripts to execute on the monitored VMs. However,
the integration and configuration of the scripts into the
ecosystems are not straightforward. Similar problems
can be encountered in PCMONS (De Chaves et al.,
2011) which leverages Nagios.
With a simpler integration mechanism, both
Rally
15
and Munin
16
offer developers the possibil-
ity of extending their monitoring activity through plu-
gins. However, Rally is more of a testing tool that
allows administrators to execute stress test scenarios
and collect information for benchmarking and profil-
ing OpenStack-based Clouds (Pflanzner et al., 2016).
Munin, instead, was designed to monitor cloud infras-
tructures and services but it lacks flexibility when ac-
cessing monitored hosts and its text file configuration
model can be quite complex (Bicaku et al., 2016).
In the literature, it is also possible to find propos-
als relating to new monitoring architectures. For ex-
10
https://prometheus.io/
11
https://graphiteapp.org/
12
https://www.logicmonitor.com/
13
https://www.nagios.com
14
https://www.zabbix.com/
15
https://rally.readthedocs.io/
16
http://guide.munin-monitoring.org/
ample, in (Uriarte and Westphall, 2014), the authors
discuss a possible multi-agent architecture for moni-
toring private Clouds that considers the characteristics
of the autonomic system. In (Andreolini et al., 2012),
instead, the authors focus on the scalability and high
availability of their proposal discussing an architec-
ture which combines a hierarchical approach with de-
centralised monitors.
Finally, as regards possible performance metrics,
in (Mancas¸, 2019) the authors proposed some possi-
ble performance evaluation tests for Cloud environ-
ments, to compare different virtualisation technolo-
gies. With a similar goal in (Bystrov et al., 2021),
a performance analysis of the communication- and
computation-intensive discrete element method SaaS
on the OpenStack Cloud is discussed.
In comparison with the other approaches illus-
trated, we focused our proposal on designing a moni-
toring system that is both flexible and easy to use and
customise. Indeed, even if almost all the monitoring
tools discussed support some form of customisabil-
ity, the proposed mechanisms are often complex and
require users to follow several implementation steps
among different components of the monitoring tools.
Instead, through our declarative approach, based on
the Probe’s types and Tasks, Cloud administrators can
easily adapt and extend the monitoring activities and
metrics of CloudWatcher, as well as the SLOs, to their
needs, even in complex infrastructures such as the
multi-Cloud and multi-datacentres environments.
5 CONCLUDING REMARKS
In this article, we proposed CloudWatcher, an open-
source customisable fault and performance monitor-
ing tool for multi-cloud systems, employing declara-
tive and task-oriented management through which it
is possible to simply deploy and expand with custom
metrics the monitoring activities.
CLOSER 2023 - 13th International Conference on Cloud Computing and Services Science
218

CloudWatcher is based on a two-tier architecture,
in which a set of Managers controls overlay networks
composed of Probe VMs spread among all the mon-
itored DCs. Periodically, each Manager collects data
on the status of the infrastructure interacting with its
Probes while performing Tasks, i.e., activities to col-
lect fault and performance data.
Both the types of Probe and the Tasks are managed
declaratively through a machines.json file and de-
signed to be easily customised and extended so as to
integrate personalised monitoring activities and met-
rics. Each Task employs a data collection function for
gathering data on the health of the monitored DCs, an
aggregation policy to generate a single global report
from the single Tasks’ outputs and possibly a set of
SLO thresholds, also defined declaratively.
As a use case, we deployed CloudWatcher on the
cloud of the Italian Research and Education Network
Consortium (GARR), consisting of three datacentres
scattered throughout the Italian territory. We em-
ployed a total of 3 overlay networks and 12 probes
per Manager. During the monitoring, we measured
the disk I/O performance, the latency and bandwidth
of the network and the behaviour of the Clouds while
executing a remote script and during the random dele-
tion and re-creation of the VMs. Additionally, a Web
Dashboard and alarm system using Telegram were de-
veloped. In our future work, we intend to:
• Data Analysis Pipeline. Design and imple-
ment a pipeline for the automatic production of
human-readable, insightful reports for the Cloud
administrators, based on the data available on the
database, highlighting the evolution over time and
the critical aspects of the monitored parameters.
• Large Scale Assessment. Deploy CloudWatcher
in a large-scale infrastructure for a long period to
assess its behaviour, also comparing it with other
tools. For example, in terms of the overhead pro-
duced by CloudWatcher, the reactivity of the mon-
itoring activities on spotting possible failures or
unusual measurements and how CloudWatcher re-
acts on cloud errors
• Cloud-Edge Applicability. Study the feasibil-
ity of design and develop an extension of Cloud-
Watcher suitable for a dynamic and very hetero-
geneous environment, e.g. Cloud-Edge comput-
ing. Such an extension should be also able to both
manage the scale of such infrastructures and the
mobility of Edge and IoT resources.
REFERENCES
Aceto, G., Botta, A., De Donato, W., and Pescap
`
e, A.
(2013). Cloud monitoring: A survey. Computer Net-
works, 57(9):2093–2115.
Alhamazani, K. et al. (2015). An overview of the com-
mercial cloud monitoring tools: research dimensions,
design issues, and state-of-the-art. Computing, 97(4).
Andreolini, M., Colajanni, M., and Pietri, M. (2012). A
scalable architecture for real-time monitoring of large
information systems. In 2012 2nd Symp. on Network
Cloud Computing and Applications, pages 143–150.
Bicaku, A., Balaban, S., Tauber, M. G., Hudic, A., Mauthe,
A., and Hutchison, D. (2016). Harmonized monitor-
ing for high assurance clouds. In 2016 IEEE IC2EW,
pages 118–123.
Bystrov, O., Pacevi
ˇ
c, R., and Ka
ˇ
ceniauskas, A. (2021).
Performance of communication- and computation-
intensive saas on the openstack cloud. Applied Sci-
ences, 11(16).
De Chaves, S. A., Uriarte, R. B., and Westphall, C. B.
(2011). Toward an architecture for monitoring private
clouds. IEEE Comm.Mag., 49(12):130–137.
Ding, J., Cao, R., Saravanan, I., Morris, N., and Stewart,
C. (2019). Characterizing service level objectives for
cloud services: Realities and myths. In 2019 IEEE
ICAC, pages 200–206.
Fatema, K., Emeakaroha, V. C., Healy, P. D., Morrison, J. P.,
and Lynn, T. (2014). A survey of cloud monitoring
tools: Taxonomy, capabilities and objectives. JPDC,
74(10):2918–2933.
Mancas¸, C. (2019). Performance analysis in private and
public cloud infrastructures. In RoEduNet, pages 1–6.
Miloji
ˇ
ci
´
c, D., Llorente, I. M., and Montero, R. S. (2011).
Opennebula: A cloud management tool. IEEE Inter-
net Computing, 15(2):11–14.
Moses, J., Iyer, R., Illikkal, R., Srinivasan, S., and Aisopos,
K. (2011). Shared resource monitoring and through-
put optimization in cloud-computing datacenters. In
2011 IEEE IPDPS, pages 1024–1033.
Nastic, S., Morichetta, A., Pusztai, T., Dustdar, S., Ding,
X., Vij, D., and Xiong, Y. (2020). Sloc: Service level
objectives for next generation cloud computing. IEEE
Internet Computing, 24(3):39–50.
Odun-Ayo, I., Ajayi, O., and Falade, A. (2018). Cloud
computing and quality of service: Issues and devel-
opments. In IMECS.
Pflanzner, T., Tornyai, R., Gibizer, B., Schmidt, A., and
Kertesz, A. (2016). Performance analysis of an open-
stack private cloud. SciTePress.
Uriarte, R. B. and Westphall, C. B. (2014). Panoptes: A
monitoring architecture and framework for supporting
autonomic clouds. In 2014 IEEE NOMS, pages 1–5.
Ward, J. S. and Barker, A. (2014). Observing the clouds: a
survey and taxonomy of cloud monitoring. Journal of
Cloud Computing, 3(1):1–30.
Zareian, S., Fokaefs, M., Khazaei, H., Litoiu, M., and
Zhang, X. (2016). A big data framework for cloud
monitoring. In Proc. BIGDSE ’16, page 58–64. ACM.
Customisable Fault and Performance Monitoring Across Multiple Clouds
219
