
A Computational Model for Predicting Cryptocurrencies Using
Exogenous Variables
Eduardo M. Gonc¸alves
a
, Eduardo N. Borges
b
, Bruno L. Dalmazo
c
, Rafael A. Berri
d
,
Giancarlo Lucca
e
and Vinicius M. de Oliveira
f
Center for Computational Sciences, Universidade Federal do Rio Grande, Rio Grande, Brazil
Keywords:
Time-Series, Cryptocurrencies, Neural Networks.
Abstract:
The recent growth of cryptocurrencies caused worldwide interest due to capitalization power and geographic
expansion. In this universe, Bitcoin is the main actor. Taking this into consideration, this paper aims to
analyze the behavior of Bitcoin during the time. To do so, we use techniques already studied in the literature
to perform the predictions and comparisons between methods jointly with exogenous variables to boost the
results. An evaluation has been performed and the best results were achieved using the Long-Short-Term-
Memory (LSTM) neural network model. Also, the experiments were carried out in different scenarios, using
datasets with more than five years of daily records and exogenous variables to improve the performance of the
models.
1 INTRODUCTION
Cryptocurrencies have been notoriously volatile in
comparison with other investments. Usually, the liter-
ature shows prediction models based on the long term
for predicting numerous assets. At the same time, the
elastic nature of cryptocurrencies means that they are
also apt to undergo sudden changes which makes it
even harder to predict their behavior. The price of vir-
tual currencies, such as Bitcoin, is still being studied
by the market, and there are several open issues about
its evolution, as observed in the work of (Chu et al.,
2015).
Several techniques have already been proposed to
perform the prediction of cryptocurrencies, such as
(Mallqui and Fernandes, 2019), (Miura et al., 2019),
and (Zoumpekas et al., 2020). Also, different types
of information are used to predict, such as the daily
prices, market cap, volume negotiated in the last 24h,
etc. However, the classic prediction models present an
apparent deficit in their ability to learn the data and
make accurate forecasting. In particular, these tech-
a
https://orcid.org/0000-0003-3002-6386
b
https://orcid.org/0000-0003-1595-7676
c
https://orcid.org/0000-0002-6996-7602
d
https://orcid.org/0000-0002-5125-2756
e
https://orcid.org/0000-0002-3776-0260
f
https://orcid.org/0000-0003-3864-033X
niques demand ample tuning to improve their sensi-
tivity and achieve adequate results. As a result, the
literature lacks mechanisms that can enable it to im-
prove the accuracy of predictions while keeping low
response time.
To fill these gaps, a computational model for pre-
dicting cryptocurrencies using an exogenous variable
group is proposed. Our proposal relies on analyzing
the history of the Bitcoin price to obtain features that
represent the expected appropriate behavior during
the time. This information is then used jointly with
a Long-Short-Term-Memory (LSTM) neural network
model that is supplied with these features. So, this
study aims to explore the relationship that exists be-
tween the temporal data of Bitcoin, Ethereum (Bu-
terin et al., 2013), and the exchange rate from the
dollar to the Real (USD/BRL) to predict the val-
ues of Bitcoin, using techniques of machine learn-
ing (Hochreiter and Schmidhuber, 1997).
The remainder of the paper is organized as fol-
lows. Section II covers the main concepts related to
this study. Section III describes the proposed solution
and the methodology used for this paper, whilst Sec-
tion IV presents the metrics used, the evaluation and
discusses the results. Section V concludes with some
final remarks and prospective directions for future re-
search.
180
GonÃ
˘
galves, E., Borges, E., Dalmazo, B., Berri, R., Lucca, G. and M. de Oliveira, V.
A Computational Model for Predicting Cryptocurrencies Using Exogenous Variables.
DOI: 10.5220/0011852000003467
In Proceedings of the 25th International Conference on Enterprise Information Systems (ICEIS 2023) - Volume 1, pages 180-186
ISBN: 978-989-758-648-4; ISSN: 2184-4992
Copyright
c
2023 by SCITEPRESS – Science and Technology Publications, Lda. Under CC license (CC BY-NC-ND 4.0)

2 PRELIMINARIES
In this section, the main concepts related to the study
are presented. Precisely, we discuss about Cryptocur-
rencies, Time-series, Neural networks, and Long-
Short-Term-Memory networks.
2.1 Cryptocurrencies
The first cryptocurrency (Mukhopadhyay, 2016),
eCash, was a centralized system owned by DigiCash,
Inc. and later eCash Technologies. Although it was
discontinued in the late 1990s, the cryptographic pro-
tocols it employed avoided double-spending. A blind
signature was used to protect the user’s privacy and
provided good inspiration for further development.
The 2008 global financial crisis, together with a
lack of confidence in the financial system, provoked
considerable interest in cryptocurrencies. A ground-
breaking white paper by Satoshi Nakamoto circulated
online in 2008 (Nakamoto, 2008). In the article,
this pseudonym introduced a digital currency that is
now widely known as Bitcoin. This methodology
uses blockchain (Nofer, 2017) as the public ledger for
all transactions and a scheme called Proof of Work
to avoid the need for a trusted authority or central
server for timestamp transactions (Nakamoto, 2008).
Blockchain is an open platform that records all trans-
actions in a verifiable and permanent way, solving the
problem of double-spending and ensuring the security
of exchanges throughout history.
Bitcoin growth led to born of new cryptocurren-
cies, such as Ethereum, Cardano
1
, Polygon
2
, among
others. There are strategies to try to regulate Bit-
coin as an official currency, which can be seen in
(Hughes, 2017). However, the concept of virtual cur-
rency and definitions of possible fees on currencies
are inconclusive and not general, as can also be seen
in (Castello, 2019).
2.2 Time-Series
Time series is a collection of observations made se-
quentially over time. The most important feature of
this type of data is that neighbouring observations
are dependent, and we are interested in analyzing and
modelling this dependence. While in regression mod-
els, for example, the order of observations is irrelevant
to the analysis, in time series, the order of the data is
crucial (Ehlers, 2007).
For financial time series, according to (Morettin,
2017), it is main features: closing value, daily maxi-
1
https://cardano.org
2
https://polygon.technology
mum and minimum values of the evaluated currency.
Such information allows recognizing trends, influ-
ences and other essential attributes to analyze and un-
derstand the data (Dalmazo et al., 2018). However,
even when dealing with the monetary field, the finan-
cial time series differs from the others because they
have high volatility and suffer from various exter-
nal influences, requiring specific methods and mod-
elling (Morettin, 2017).
2.3 Neural Networks
The first information about neurocomputing appeared
in mid-1943 (McCulloch and Pitts, 1943). In it, the
authors made an analogy between living nerve cells
and the electronic process in a published work on
”formal neurons”, simulating the behaviour that oc-
curs in human brains, in which the neuron had only
one output, which was a function of the sum of the
value of its several entries. The work consisted of a
model of variable resistors and amplifiers, represent-
ing synaptic connections of a biological neuron.
An Artificial Neural Network (ANN) has two ele-
mentary facets: the architecture and the learning algo-
rithm. Unlike a Von Neumann architecture computer
(Tanenbaum and Zucchi, 2009) that is programmed,
the network is trained. A neural network is basically
composed of neurons that are responsible for process-
ing information. The response of an initial neuron
with an activation function feeds the next one, and so
on, until the last node; each set of neurons represents
a layer, and the set of them forms the network.
There are several types of neural networks, and it
is worth mentioning the Recurrent Neural Networks
(RNN) (Deng and Yu, 2014), where information can
travel in different directions; in this way, one neuron,
in addition to feeding the next, manages to feed it-
self back, producing a category of short-term mem-
ory. As a result of these characteristics, RNNs can
create more complex models that are extensible to a
larger group of problems.
A special type of RNN is the Long Short-
Term Memory (LSTM) (Hochreiter and Schmidhu-
ber, 1997), which is capable of learning long-term
dependencies. This approach is considered an ideal
solution for a wide variety of problems and is widely
used today, such as pollution in the air (Tsai et al.,
2018), speech enhancement (Sun, 2017), renewable
energy sources (Abdel-Nasser and Mahmoud, 2019)
and others.
All RNNs are in the form of a chain of repeat-
ing modules in a neural network. In a standard RNN,
this module has a very simple structure, such as a
layer with a function that produces a zero-centred out-
A Computational Model for Predicting Cryptocurrencies Using Exogenous Variables
181
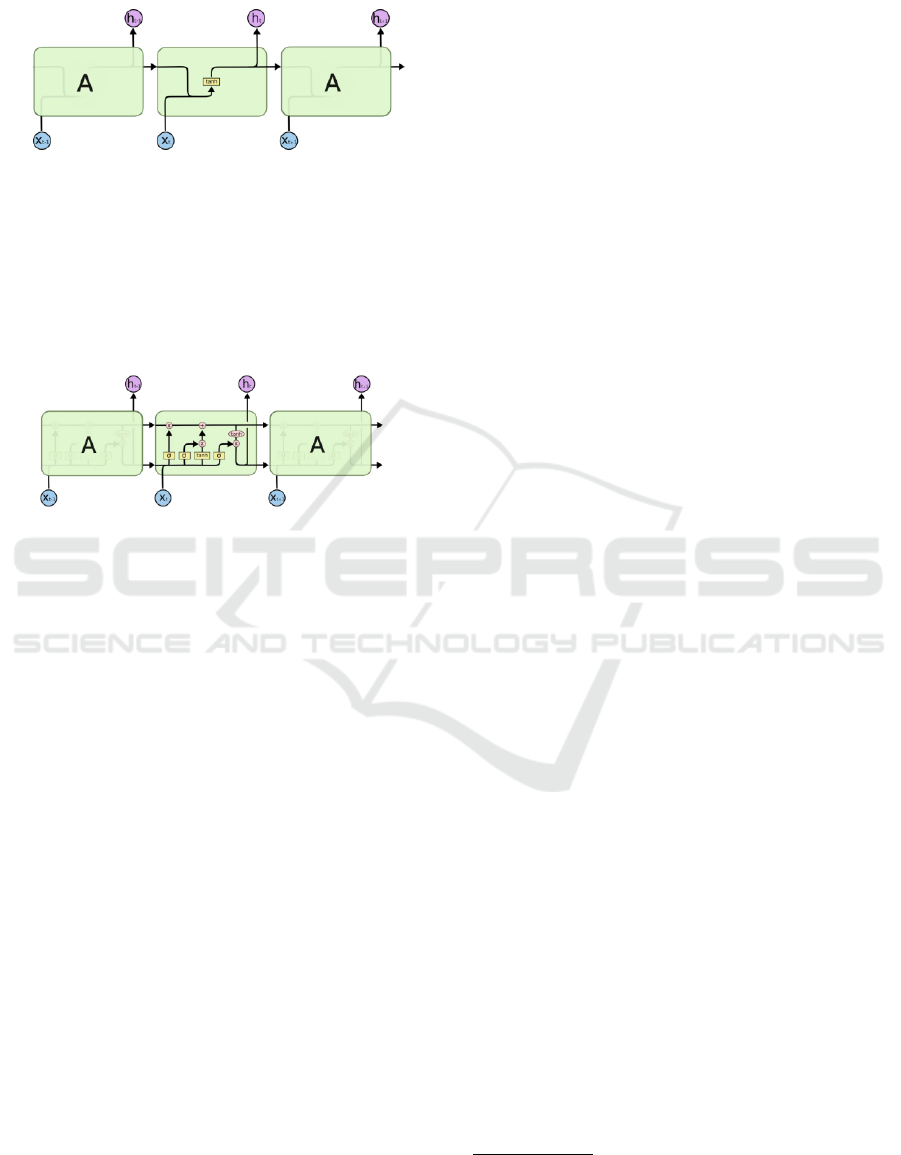
put, supporting the backpropagation process known
as tanh function, as shown in Figure 1.
Figure 1: An RNN’s module contains only a single layer.
Source: OLAH, 2015.
Following a similar structure, the LSTM networks
also have this chain structure, but the repeating mod-
ule has a different shape. Rather than having just a
single layer of a neural network, there are four, which
interact in a very specific way. Figure 2 visually
presents this concept.
Figure 2: An LSTM’s module contains four interacting lay-
ers. Source: OLAH, 2015.
The main idea of LSTM networks is to create a
representation of the cell state that traverses through
the entire structure of the network, undergoing only a
few linear interactions, making it so that information
can flow without many changes.
LSTM networks also have the ability to remove or
add information to the cell state, being regulated by
structures known as gates. It is a way to let informa-
tion flow in the neural network. They are composed
of a sigmoid layer of a neural network and a type
of multiplication. The sigmoid layer outputs num-
bers ranging from zero to one, which describe how
much of each component must pass through the gate.
The higher the value, the more information is passed
through this layer.
3 METHODOLOGY
This section will contextualize the data and methods
used to predict Bitcoin with the support of exogenous
time series, Ethereum and USD/BRL, in addition to
carrying out important considerations for the rest of
the study and demonstrating all proposed tests.
To ease the comprehension of the methodology,
in Figure 3, we summarize the process. It starts with
a dataset as input, and these data are pre-processed
and fed into the neural network. After the training of
the network is completed, the prediction model of the
data is generated. Finally, to evaluate the assertive-
ness of the model, the analysis is carried out through
the metrics described above. In what follows, we de-
scribe in detail the steps of the adopted methodology.
3.1 Data Collection
The datasets used were obtained from one of the
biggest investment sites in the world
3
. The selected
data are from January 1, 2016 to June 1, 2021, with
1,979 samples. This set consists of daily records con-
taining the following features:
• Date - Weekly Registration Date
• Open - Currency Opening Value
• Close - Currency Closing Value
• High - Maximum Currency Value in the Period
• Low - Minimum Currency Value in the Period
• Volume - Trading Amount of Currency in the Pe-
riod
• Var% - Currency Price Variation in Percentage
All analysis performed in this work was made
from the database collected. The closing value of the
coin will be used for testing and the others will be dis-
carded. In this way the study will focus on the Bitcoin
time series. Consequently, the statistical characteris-
tics of the data were observed for a better understand-
ing of the problem and were fundamental to define
some parameters of the modeling.
3.2 Pre-Processing
Before entering the data into the model, they were di-
vided between training and testing and normalized.
Normalization of datasets is a common requirement
for many machine learning estimators, and they can
misbehave if individual features don’t look like nor-
mally distributed data: Gaussian with zero mean and
unity variance. For example, many elements used in
the objective function of a learning algorithm assume
that all features are centred around zero and have vari-
ance in the same order. If a feature has a variance that
is the order of magnitude much higher than the oth-
ers, it can dominate the objective function and make
the estimator unable to learn from other’s features cor-
rectly as expected. There are several ways to split a
database. In this case, the division was done in a dif-
ferent way. Considering that the models used use the
3
To access and for more information about the datasets
see: https://www.investing.com
ICEIS 2023 - 25th International Conference on Enterprise Information Systems
182
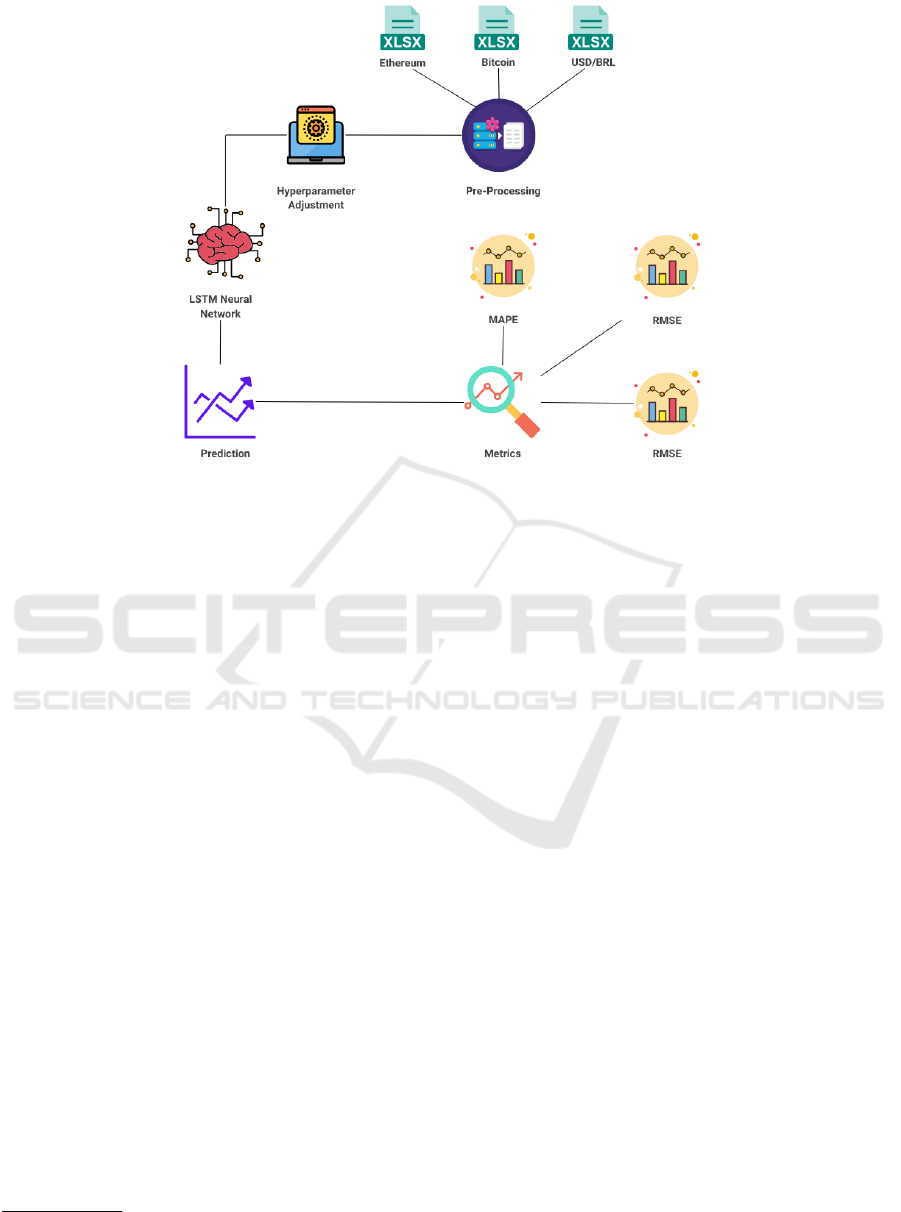
Figure 3: Overview of the proposal.
series’ own values for learning, the interval selected
for training can impact the results. In this way, incor-
porating or removing value peaks from the series dur-
ing the execution of the models can directly change
the prediction values.
First, the data was divided into 80% for training
and 20% for testing. After, for comparison purposes,
it was also performed with training and test data di-
vided into 70% and 30%. The application methods
were the same for both sets. Finally, we highlight that
the model was validate considering a 10-fold cross-
validation(Tanenbaum and Zucchi, 2009).
3.3 Experimental Setup
The analysis performed
4
from data collection to mod-
eling and testing, using Python language, version
3.7.10, and free machines provided by the Google
Collaboratory environment. The libraries Matplotlib
(Hunter, 2007) were used for plotting the graphs and
images, scipy (Virtanen et al., 2020) and keras library,
(Gulli and Pal, 2017), for instances of the LSTM neu-
ral network model.
3.4 Configuration of the Proposal
GridSearchCV library was used to define the param-
eters, as stated in (Brownlee, 2016), hyperparameters
optimization is a big part of deep learning. The rea-
4
The computer that performed these tests has 8gb of
RAM memory and a core I5 8th gen processor.
son is that neural networks are notoriously difficult to
configure and there are many parameters that need to
be set. Grid Search is an approach to parameter tuning
that will build and evaluate a model for each combina-
tion of algorithm parameters specified in a grid. The
key terms to know when using Grid Search CV are:
• Estimator - The model to be trained is passed to
this parameter.
• Parameter Grid - A dictionary with parameters,
they are explained in the next page. All combina-
tions of these parameters are tested to verify the
model with the best accuracy.
3.5 LSTM Network
• Optimization: Optimization refers to a procedure
for finding the input parameters or arguments to a
function that result in the minimum or maximum
output of the function. The applied optimizer is
Adam. It is a first-order optimization algorithm,
that explicitly involve using the first derivative
(gradient) to choose the direction to move in the
search space;
• Batch Size: The batch size is the number of pat-
terns shown to the network before the weights are
updated. It is also an optimization in the train-
ing of the network, defining how many patterns to
read at a time and keep in memory. The batch size
used in the experimental is 64.
• Epochs: The number of epochs is the number of
times that the entire training dataset is shown to
A Computational Model for Predicting Cryptocurrencies Using Exogenous Variables
183

the network during training. After performing the
GridSearchCV, the model consider 25 epochs.
3.6 Evaluation Metrics
In a data modelling (Simsion and Witt, 2004) and
forecasting system (Affonso et al., 2021), it is es-
sential to use metrics that allow the evaluation and
understanding of the results obtained, through which
it is possible to suggest the adequacy of the method-
ology and processes to the problem. For evaluation,
Mean Absolute Error (MAE) and Root Mean Square
Error (RMSE) are widely adopted in several areas of
knowledge to measure performance, mainly to esti-
mate the quality of a forecasting model. Another im-
portant metric is the Mean Absolute Percent Error
(MAPE). It brings a percentage perspective of the er-
ror of the evaluated method. As can be seen in (Af-
fonso et al., 2021), the use of metrics that consider
the errors found between prediction and real value as
a form of evaluation for time series prediction is ef-
fective, in addition to facilitating the identification of
characteristics and carrying out comparisons.
3.6.1 RMSE
The first metric, RMSE consist in the root mean
square error of the difference between the prediction
and the actual value. Similar to the standard devia-
tion, is interpreted as a measure of the average devia-
tion between observed and predicted. Where x
i
is the
actual value and x
′
i
is the predicted value, we have:
RMSE =
r
(
∑
(x
i
− x
′
i
)
2
N
) (1)
3.6.2 MAE
The Mean absolute error basically consists of the av-
erage of errors that the model obtained. Unlike the
previous metric, it penalizes large model errors less.
Where x
i
is the actual value and x
′
i
is the predicted
value, we have:
MAE =
∑
(x
i
− x
′
i
)
2
N
(2)
3.6.3 MAPE
The MAPE differs from the metrics mentioned above
and calculates the error in percentage. It is calculated
as the average of the percent error, i.e. it expresses the
error precision as a percentage.
MAPE =
1
N
∑
(x
i
− x
′
i
)
x
i
∗ 100 (3)
4 RESULTS
In general, evaluating the results obtained, it was pos-
sible to observe how the proposed model, as described
in the methodology, was able to make predictions of
Bitcoin time efficiently, with good behavior for dif-
ferent approaches of training/test split. The first split
is presented in 4; in it, we provide the real variations
of the Bitcoin (blue line) with the prediction of the
model (yellow line) considering in the x-axis differ-
ent years and the values on the y-axis.
As we can see, the periods of 2017, 2018, and
2021 show how intense Bitcoin variations can be in
this case. Up to this point, to provide a complete
study, we perform an analysis of the data split in 70-
30%. Precisely, the behaviour of this series is pre-
sented in 5, which follows a similar structure to the
previous analysis.
When considering periods in which the behavior
of Bitcoin was unstable or more volatile, the model
did not predict this situation well. The great peaks of
value suffered by Bitcoin, whether high or low, are the
result of a set of factors. Studying and understanding
these factors is essential to proceed with the study.
Another consideration that must be made is re-
lated to the existence time of Bitcoin, the small pe-
riod of existence does not allow infer patterns yet.
The atypical situations in which the series is submit-
ted make it difficult to understand, study and corrobo-
rate the large variations and lack of pattern identified.
Studying the behavior of the data and its relation
with the predictive model is an important step. How-
ever, in order to provide a more robust study, we con-
sider the application of different evaluation metrics,
RMSE and MAPE. The results related to these met-
rics and the considered model are presented in Table
1, which is divided into two different parts according
to the splits of the datasets.
Table 1: Results obtained by different evaluation metrics
considering the two datasets distributions and LSTM Neural
Network.
80%-20% 70%-30%
RMSE MAPE (%) RMSE MAPE (%)
4.320,37 6.89 5.535,53 7.03
During training, the results suggest that the net-
work, divided into 80% training and 20% testing,
presented an RMSE of 4,320.37 and a MAPE of
6.89%. The network where the data were divided into
70% training and 30% testing presented an RMSE
of 5,535.53 and a MAPE of 7.03%. In general, the
RMSE penalizes large forecast errors. Considering
the analyzed data, which have large variations, these
ICEIS 2023 - 25th International Conference on Enterprise Information Systems
184

Figure 4: Prediction Using LSTM Network (80% - 20%).
Figure 5: Prediction Using LSTM Network (70% - 30%).
values suggest an average performance of the model.
The choice of evaluation indices take into account
both the prediction error of the model and its adapta-
tion to the time series, taking into account the penalty
of errors on a small and large scale. The selection of
evaluation indices for the final comparison table con-
sidered the best results obtained by each model, con-
taining the same total of data for testing and training.
It is important to highlight the assignment of ran-
dom weights that happens during the training of a
neural network, making its implementation a little
more complex. It was necessary to carry out several
tests using the same input data and parameters to be
able to obtain an average of the evaluation indices.
5 CONCLUSIONS
Machine learning shows itself to be effective in mod-
eling and predicting time series. However, identifying
values or future trends is not a simple task, especially
when dealing with financial context where the studied
context is influenced by several external factors. In
particular, cryptocurrencies, unlike conventional as-
sets, suffer unknown interferences in their value, mak-
ing their temporal evolution extremely volatile. There
are indications and studies of situations that can cause
such changes. Periods of 2017, 2018, and 2021 show
that Bitcoin’s price fluctuates due to several causes
such as supply and demand, investor and user senti-
ments, government regulations, and media hype.
This work aimed to investigate the efficiency of
modeling and understanding the Bitcoin time series
with the use of exogenous time series, which influ-
enced the main series. The selected training models
and the techniques used for prediction aimed to diver-
sify the existing content about this subject, in addition
to proposing different approaches. The results sug-
gest that the model did not behave so well, highlight-
ing a deficiency in the proposed analysis category.
For future work, we intend to evaluate periods
with the highest volatility of the series, considering
A Computational Model for Predicting Cryptocurrencies Using Exogenous Variables
185

social networks analysis, news, and information that
influence people’s desire to buy, for instance. In fact,
this assessment intends to identify and model other
external influences, which were not addressed in this
study, to which the currency is subject.
Combining a qualitative approach to external in-
fluences, such as example, Twitter sentiment analysis,
and a quantitative approach based on the series’ own
values may be the most appropriate way to conduct
the research. Furthermore, these valuations can be a
promising study for currency forecasting.
ACKNOWLEDGEMENTS
This work was partially supported by the Brazilian re-
search funding agencies CNPq (305805/2021-5) and
FAPERGS (Programa de Apoio
`
a Fixac¸
˜
ao de Jovens
Doutores no Brasil - 23/2551-0000126-8).
REFERENCES
Abdel-Nasser, M. and Mahmoud, K. (2019). Accurate pho-
tovoltaic power forecasting models using deep lstm-
rnn. Neural Computing and Applications.
Affonso, F., Dias, T. M. R., and Pinto, A. L. (2021). Finan-
cial times series forecasting of clustered stocks. Mo-
bile Networks and Applications, 26(1):256–265.
Brownlee, J. (2016). How to grid search hyperparameters
for deep learning models in python with keras. l
´
ınea].
Disponible en: https://machinelearningmastery.
com/grid-search-hyperparameters-deep-learning-
models-python-keras.
Buterin, V. et al. (2013). Ethereum white paper. GitHub
repository, 1:22–23.
Castello, M. G. (2019). Bitcoin
´
e moeda? classificac¸
˜
ao das
criptomoedas para o direito tribut
´
ario. Revista Direito
GV, 15.
Chu, J., Nadarajah, S., and Chan, S. (2015). Statistical
analysis of the exchange rate of bitcoin. PloS one,
10(7):e0133678.
Dalmazo, B. L., Vilela, J. P., and Curado, M. (2018). Triple-
similarity mechanism for alarm management in the
cloud. Computers & Security, 78:33–42.
Deng, L. and Yu, D. (2014). Deep learning: methods and
applications. Foundations and trends in signal pro-
cessing.
Ehlers, R. S. (2007). An
´
alise de s
´
eries temporais. Labo-
rat
´
orio de Estat
´
ıstica e Geoinformac¸
˜
ao. Universidade
Federal do Paran
´
a, 1:1–118.
Gulli, A. and Pal, S. (2017). Deep learning with Keras.
Packt Publishing Ltd.
Hochreiter, S. and Schmidhuber, J. (1997). Long short-term
memory. Neural computation, 9(8):1735–1780.
Hughes, S. D. (2017). Cryptocurrency regulations and en-
forcement in the us. W. St. UL Rev., 45:1.
Hunter, J. D. (2007). Matplotlib: A 2d graphics environ-
ment. Computing in science & engineering, 9(03):90–
95.
Mallqui, D. C. and Fernandes, R. A. (2019). Predicting
the direction, maximum, minimum and closing prices
of daily bitcoin exchange rate using machine learning
techniques. Applied Soft Computing, 75:596–606.
McCulloch, W. S. and Pitts, W. (1943). A logical calculus
of the ideas immanent in nervous activity. The bulletin
of mathematical biophysics, 5(4):115–133.
Miura, R., Pichl, L., and Kaizoji, T. (2019). Artificial neu-
ral networks for realized volatility prediction in cryp-
tocurrency time series. In International Symposium on
Neural Networks, pages 165–172. Springer.
Morettin, P. A. (2017). Econometria financeira: um curso
em s
´
eries temporais financeiras. Editora Blucher.
Mukhopadhyay, Ujan, e. a. (2016). A brief survey of cryp-
tocurrency systems. 14th annual conference on pri-
vacy, security and trust (PST), IEEE.
Nakamoto, S. (2008). A peer-to-peer electronic cash sys-
tem. Bitcoin.–URL: https://bitcoin. org/bitcoin. pdf.
Nofer, Michael, e. a. (2017). Blockchain. Business & In-
formation Systems Engineering.
Simsion, G. and Witt, G. (2004). Data modeling essentials.
Elsevier.
Sun, Lei, e. a. (2017). Multiple-target deep learning
for lstm-rnn based speech enhancement. Hands-
free Speech Communications and Microphone Arrays
(HSCMA), IEEE.
Tanenbaum, A. S. and Zucchi, W. L. (2009). Organizac¸
˜
ao
estruturada de computadores. Pearson Prentice Hall.
Tsai, Y.-T., Zeng, Y.-R., and Chang, Y.-S. (2018). Air pollu-
tion forecasting using rnn with lstm. 16th Intl Conf on
Dependable, Autonomic and Secure Computing, 16th
Intl Conf on Pervasive Intelligence and Computing,
4th Intl Conf on Big Data Intelligence and Computing
and Cyber Science and Technology Congress, IEEE.
Virtanen, P., Gommers, R., Oliphant, T. E., Haberland, M.,
Reddy, T., Cournapeau, D., Burovski, E., Peterson,
P., Weckesser, W., Bright, J., et al. (2020). Scipy
1.0: fundamental algorithms for scientific computing
in python. Nature methods, 17(3):261–272.
Zoumpekas, T., Houstis, E., and Vavalis, M. (2020). Eth
analysis and predictions utilizing deep learning. Ex-
pert Systems with Applications, 162:113866.
ICEIS 2023 - 25th International Conference on Enterprise Information Systems
186
