
Digital Models for Power Flow Analysis and Calculation of
Electromagnetic Interference Effects of Long-Distance
Ultrahigh-Voltage Transmission Lines
Andrey Kryukov
1,2 a
, Konstantin Suslov
1,3 b
and Alexandr Kryukov
1c
1
Department of Power Supply and Electrical Engineering, Irkutsk National Research Technical University, Irkutsk, Russia
2
Department of Transport Electric Power, Irkutsk State Transport University, Irkutsk, Russia
3
Department of Hydropower and Renewable Energy, National Research University,
“Moscow Power Engineering Institute”, Moscow, Russia
Keywords: Long-Distance Ultrahigh-Voltage Transmission Lines, Comprehensive Modeling in the Phase Frame of
Reference.
Abstract: The goal of the research presented in this article was to develop computer models of long-distance ultra-high
voltage (UHV) power transmission lines to provide comprehensive modeling of power flows and calculating
electromagnetic interference effects on extended steel structures. In developing the models, we employed the
methods based on the use of the phase frame of reference and equivalent lattice circuits with a fully connected
topology. The simulations were carried out for a 1,150 kV UHV transmission line with a length of 900 km,
each phase of which was formed by eight AC-330 wires . Simulations were performed using the software
package Fazonord. Along with power flow calculations and determination of the voltages created by the 1,150
kV long-distance transmission line on the pipeline, we simulated electromagnetic fields, taking into account
the impact exerted by the grounded steel structure. The results of modeling a long-distance 1,150 kV
transmission line with receiving end loads of 300 + j 200 MVA per phase led to the following conclusions: in
the case of a normal power flow with balanced loads at individual points of the structure the levels of induced
voltages did not exceed the allowable limit of 60 V; in the case of two-phase and single-phase short-circuit
power flows the maximum induced voltages also did not exceed the 1,000 V limit set by the regulatory
document. The models presented in the paper can be put into practice when planning the measures to ensure
the electrical safety of technicians working at the pipeline sections located in the areas that are subject to
electromagnetic interference effects of transmission lines. The application scope of the technique developed
covers the cases where a transmission line and a pipeline run in close proximity following a complex trajectory
that includes parallel and oblique segments.
1 INTRODUCTION
The current stage of electric power industry
development is characterized by commissioning of
long-distance ultrahigh-voltage (UHV) DC and AC
transmission lines. An example of such a power
transmission line is the 1,000 kV line, which serves
as a power bridge between the northern and central
regions of the PRC (Li, 2013). The long-distance
UHV transmission line projects that serves as the
backbone of the Northeast Asia power
a
https://orcid.org/0000-0001-6543-1790
b
https://orcid.org/0000-0003-0484-2857
c
https://orcid.org/0000-0003-3272-5738
interconnection are under discussion (Podkovalnikov,
2015). Against the current background of large-scale
use of information technology, the operation of such
power transmission lines calls for digital models that
provide a proper power flow analysis of electric
power systems (EPS) (Bulatov, 2022), in which such
UHV power transmission lines are employed.
The relevance of the task of modeling of long-
distance UHV transmission lines is attested by a large
body of published research on the subject. For
example, article (Wang, 2021) presented the results
40
Kryukov, A., Suslov, K. and Kryukov, A.
Digital Models for Power Flow Analysis and Calculation of Electromagnetic Interference Effects of Long-Distance Ultrahigh-Voltage Transmission Lines.
DOI: 10.5220/0011853400003491
In Proceedings of the 12th International Conference on Smar t Cities and Green ICT Systems (SMARTGREENS 2023), pages 40-49
ISBN: 978-989-758-651-4; ISSN: 2184-4968
Copyright
c
2023 by SCITEPRESS – Science and Technology Publications, Lda. Under CC license (CC BY-NC-ND 4.0)

of the study of utility frequency overvoltages and
measures for its suppression in ultra-high voltage
transmission lines. Study (Shao, 2012) dealt with the
analysis of overvoltages arising during single-phase
automatic reclosing in long-distance UHV
transmission lines. The issues of overvoltage
limitation in long-distance 1,000 kV transmission line
were considered in article (Wang, 2018). The problem
of matching the insulation of a half-wavelength ultra-
high voltage transmission line was solved in (Zhang,
2020). In study (Golov, 2020) its authors described an
adjustable sequential compensation installation
proposed by them, which provided an increase in the
transmission capacity of long-distance transmission
lines. Works (Xue, 2011 a, Xue, 2011 b) were devoted
to the study of switching overvoltages in long-distance
UHV transmission lines. Based on the results
obtained, the authors proposed measures to reduce
them. The system of transmitting energy over long
distances from a solar power plant was discussed in
article (Rahul, 2020). Distance protection with a
traveling wave for an UHV line, implemented on the
basis of the wavelet transform, was proposed in (Long,
2018). Article (Dias, 2011) dealt with the issues of
transmitting bulk power over extra-long distances.
Flexible systems for transmitting electricity over long
distances were proposed in (Davydov, 2019)
Theoretical aspects of long-distance power
transmission were discussed in research monographs
(Aleksandrov, 2006, Ryzhov, 2007).
Our analysis of published research reveals that the
tasks of complex modeling of power flows and
determining the electromagnetic fields (EMF) of
long-distance UHV lines and their effects on adjacent
conductive facilities have not been solved to the
extent warranted by the problem. This is due to the
fact that in most cases the single-line approach is used
to model long-distance transmission lines
(Aleksandrov, 2006, Ryzhov, 2007, Zakaryukin,
2005), which makes it difficult to take into account
longitudinal and transverse imbalances in power
systems.
The methods for calculating power system power
flows and computer technologies proposed in
(Zakaryukin, 2005, Zakaryukin, 2020) allow
implementing a proper and comprehensive approach
to the modeling of electric networks with long-
distance transmission lines and ultra-high voltage.
Below we present the results of research aimed at
furthering the development of techniques for
modeling power flows, EMF of long-distance
transmission lines and their electromagnetic
interference effects (EMIE) on extended steel
structures.
2 METHODOLOGY
The study of power flows, EMF and EMIE was
carried out by simulating a transmission line with a
nominal voltage of 1,150 kV and a length of 900 km.
For simulation purposes we used the parameters of
the line "Itat - Barnaul - Ekibastuz - Kokshetau -
Kustanai - Chelyabinsk", built in 1980 - 1988, which
now operates at 500 kV. The design transmission
capacity of this line was 5,500 MW. The line used
split phases made with eight AC-330 wires.
The Fazonord software package (Zakaryukin,
2020) was used as the main tool for carrying out
computer-aided power flow analysis of the long-
distance UHV transmission line. In order to capture
the changes in currents and voltages along the length
of the transmission line, the line model was
partitioned into eleven elements. The first five of
them corresponded to sections that were each 10 km
long. The models of these sections included a
segment corresponding to the above-ground pipeline,
running parallel to the line at a distance of 50 m from
the axis of the transmission line. The diameter of the
pipe was assumed to be 250 mm. Stationary earth
electrodes with a 1 Ohm leakage resistance were
installed along the edges of the structure. In addition,
the distributed grounding of the pipe with a
conductivity of 0.05 S/km was taken into account.
The length of the sixth section was 100 km, and that
of the rest - 150 km. Provision was made for the
transposition of line phases.
To take into account the distributive nature of
parameters of the transmission line and the grounded
pipeline, ladder equivalence circuits of sections
consisting of series-connected multiport devices were
formed (Zakaryukin, 2005, Zakaryukin, 2020,
Kryukov, 2022).
The algorithm for forming a ladder diagram
included the following steps:
1) the maximum length of the short section was
taken equal to a quarter of the thickness of the skin
layer in the ground
0
1
μγμπ
=Δ
r
f
, (1)
where
γ
– ground conductivity, S/m;
r
μ
=1; f –
frequency;
Гн/м104
7
0
−
⋅π=μ
;
2) the value of the length l was determined so as
to satisfy the condition l2
n
= L, where n - the number
of sections connected in series; L – the length of the
simulated line;
3) an equivalent lattice circuit (ELC) was
generated for the section with length l;
Digital Models for Power Flow Analysis and Calculation of Electromagnetic Interference Effects of Long-Distance Ultrahigh-Voltage
Transmission Lines
41

4) a ladder circuit was formed of 2n ELCs of
sequentially connected sections; the node numbers at
the beginning of the i-th section were taken equal to
the numbers at the end of the i-1 section;
5) intermediate nodes of the generated circuit
were removed and renumbered;
6) steps 4 and 5 of the algorithm were repeated n
times.
The removal of the intermediate node was
performed on the basis of the transformation of a star
polygon into a polygon. It should be noted that the
described procedure led to an increase in the number
of branches of the resulting ELC.
This procedure can be illustrated using the
diagram shown in Fig. 1. In the diagram, we removed
the node numbered 0, to which the ground shunt with
the conductivity
0
1
Z
Y =
and N branches with
impedances Z
1
, Z
2
, …, Z
N
were connected.
1
I
2
I
N
I
0
I
2
Z
N
Z
0
Z
1
ϕ
2
ϕ
N
ϕ
0
ϕ
Figure 1: Transformed section of the circuit.
Branch currents can be found on the basis of their
potentials:
1
01
1
Z
I
ϕ−ϕ
=
;
2
01
2
Z
I
ϕ−ϕ
=
; …,
N
N
N
Z
I
0
ϕ−ϕ
=
(2)
Then the following relationship can be written for
the potential of the node to be removed:
ϕ−
ϕ
===ϕ
==
=
N
i
i
N
i
i
i
N
i
i
ZZYY
I
Y
I
1
0
1
10
0
11
,
(3)
from which it follows that
=
=
ϕ
+
=ϕ
N
i
i
i
N
i
i
Z
Z
Y
1
1
0
1
1
.
(4)
By introducing the notation
=
+=
N
i
i
Z
YY
1
0
1
, (5)
for the k-0 branch current, the following expression
can be obtained:
ϕ
−−
ϕ
−−
ϕ
−
ϕ
−ϕ=
N
N
k
k
k
k
k
ZYZYZYZYZ
I
0020
2
10
1
......
1
(6)
It follows from the above that at each of the nodes
in question a shunt appeared with a conductivity of
−=
=
N
i
ik
k
ZYZ
Y
1
0
11
1
1
. (7)
Furthermore, additional branches were formed
between the nodes, the resistances of which are
defined as follows:
jk
jk
jk
k
jk
k
jk
k
jk
j
jk
j
ZYZZYZ
ZYZZYZZYZZYZ
00
0000
1
ϕ−ϕ
+ϕ−=
=
ϕ
−
ϕ
+
ϕ
−=
ϕ
−
(8)
From the above it follows that for the resistance
of the branch k-j we can write
jkjk
ZYZZ
0
=
(9)
In the transformed circuit there was no node 0.
However, a shunt to ground appeared in each of the
nodes connected to it. The circuit was complemented
by N(N-1)/2 branches, corresponding to the
connections of node 0 to adjacent nodes.
The resulting ladder diagram makes it possible to
properly simulate any long-distance transmission
line, as well as grounded current-carrying parts,
correctly accounting for the distributed nature of
parameters
3 RESULTS OF MODELING
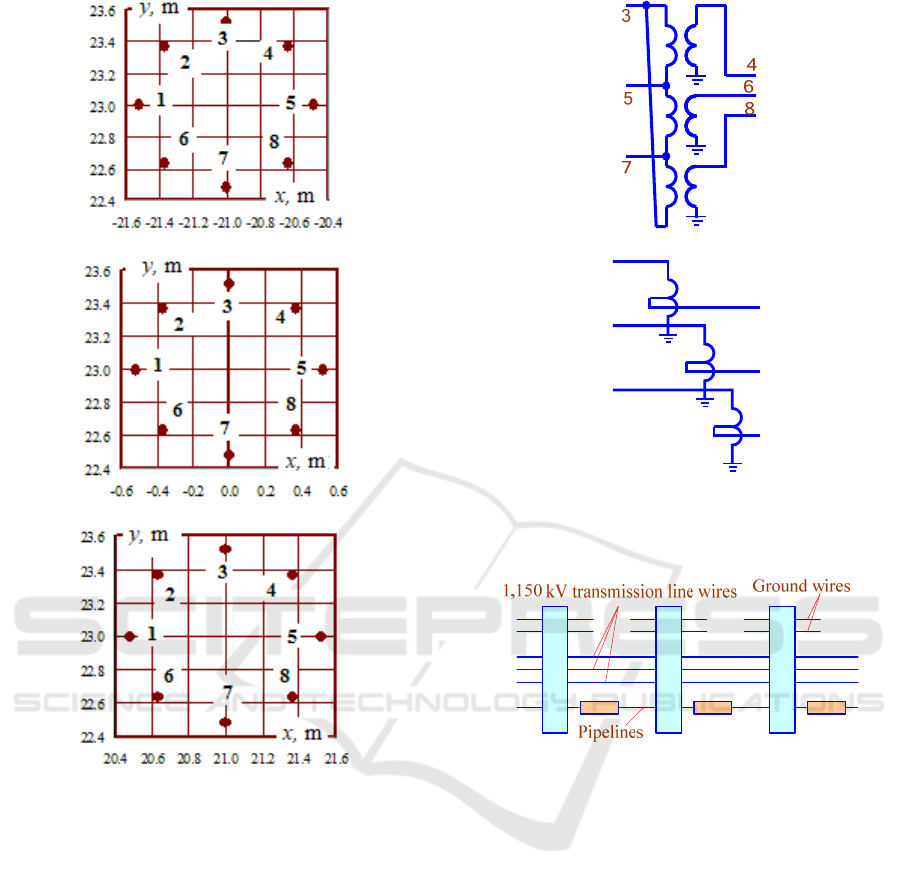
The network schematic is shown in Fig. 2, the spatial
arrangement of wires is shown in Fig. 3, the display
of transformer and transmission line models in the
main window of the software package is shown in
Fig. 4 and 5, the simulation results - in Figs. 6 to 22.
Figure 2: Network schematic: x - distance from the sending
end of the transmission line.
SMARTGREENS 2023 - 12th International Conference on Smart Cities and Green ICT Systems
42
a)
b)
c)
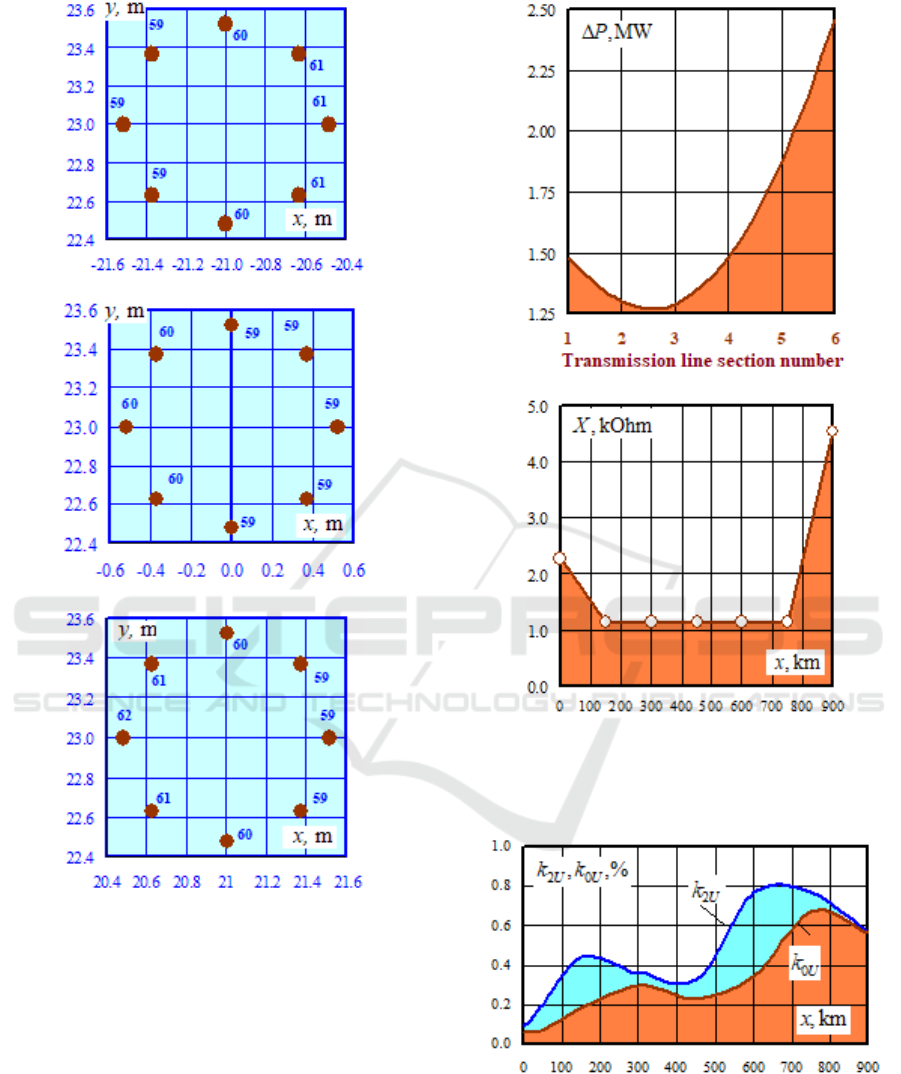
Figure 3: Coordinates of wires location: a - left phase; b -
middle phase; c - right phase; bold numbers indicate wire
numbers.
At the receiving end of the transmission line, a
balanced load of 300 + j200 MVA per phase was
assumed. The distribution of currents over the wires
at the beginning of the head section of the
transmission line is shown in Fig. 6. In order to ensure
that the voltage deviations are contained within the
permissible limits, it was necessary to install shunt
reactors, the parameters of which are shown in Fig.
7b. A model of the controlled reactive power source
was installed at the receiving end of the long-distance
transmission line, which provided stabilization of
phase voltages at 664 kV.
a)
b)
Figure 4: Models of transformers and autotransformers: a -
3х417 MVA transformer, b - 3х667 MVA autotransformer.
Figure 5: Detail of the visual representation of the
computational model, including the UHV transmission line
and the above-ground pipeline.
Power losses by sections of the transmission line
are shown in Fig. 7a; the losses at sections 1...6 were
summed up to obtain the same length. Fig. 7a shows
that the relationship
()
xPP Δ=Δ has a minimum,
corresponding to the eighth segment with coordinates
x = 300 km at the beginning and x = 450 km at the
end. Specific power losses per kilometer of the
transmission line were in the range of 8.6 to 16.4 kW.
The losses as a percentage of the transmitted active
power were in the range 0.14...0.27%.
Fig. 8 shows the dependencies of asymmetry
coefficients along the reverse (k
2U
) and zero (k
0U
)
sequences on the x-coordinate, from which we can see
that there is insignificant asymmetry at long-distance
transmission line nodal points, which does not exceed
the permissible limits.
Digital Models for Power Flow Analysis and Calculation of Electromagnetic Interference Effects of Long-Distance Ultrahigh-Voltage
Transmission Lines
43
a)
b)
c)
Figure 6: Distribution of currents along the wires at the
beginning of the head section of the transmission line: the
bold numbers indicate the numbers of wires according to
Fig. 2.
a)
b)
Figure 7: Power losses along sections of the transmission
line (a) and inductance of shunt reactors (b) reduced to
1,150/√3 kV.
Figure 8: Asymmetry coefficients on the inverse (k
2U
) and
zero (k
0
) sequences as a function of the x-coordinate.
Fig. 9 shows plots of voltage dependencies of the
1,150 kV transmission line on the x-coordinate
plotted for sections 1-5 that were adjacent to the
pipeline. The above plots show the decrease of
SMARTGREENS 2023 - 12th International Conference on Smart Cities and Green ICT Systems
44

voltages with the increasing the x-coordinate; at the
same time, the intensity of their decrease, which can
be estimated by the ratio of increments
x
U
Δ
Δ
,
increases. It should be noted that dependencies
()
xf
x
U
=
Δ
Δ
are linear in nature. The plots I = I(x)
presented in Fig. 10 show an increase in currents as
the x-coordinate increases. The parameter
corresponding to the intensity of their increase grows
linearly.
Figure 9: Voltages of the 1,150 kV transmission line as a
function of the x-coordinate.
Figure 10: Currents flowing through the wires of UHV
transmission line sections on the source side as a function
of the x coordinate.
An important indicator characterizing the
electromagnetic safety conditions is the levels of
electromagnetic field strengths calculated at a height
of 1.8 m, Fig. 11-13.
Since the long-distance 1,150 kV transmission
line will not run through residential areas, in
compliance with the current standards applicable for
such a line the acceptable level of electric field (EF)
strength is equal to 5 kV/m. The analysis of the
obtained results allowed us to conclude that this level,
in terms of the actual values, was exceeded in
the range of changes in the z-coordinate that spanned
Figure 11: Electric field strength components at a height of
1.8 m as a function of the z-coordinate.
Figure 12: Magnetic field strength components at a height
of 1.8 m as a function of the z-coordinate.
Figure 13: Magnetic field strength components at a height
of 1.8 m as a function of the z- coordinate.
over -42...42 m. The Z axis was perpendicular to the
transmission line axis. The highest values of field
strength were observed directly under the line wires
(Fig. 11), which was to be expected. From Fig. 12, 13
we can see that due to the current flowing through the
Digital Models for Power Flow Analysis and Calculation of Electromagnetic Interference Effects of Long-Distance Ultrahigh-Voltage
Transmission Lines
45

pipeline at the point of its location there was an
increase in the magnetic field strength.
The results of determining the electromagnetic
interference effects of the long-distance transmission
line on the pipeline are shown in Fig. 14-17. Fig. 14
presents the dependency of induced voltages (IV) on
the pipeline on the x-coordinate for the balanced load
power flow. It shows that the values of induced
voltages did not exceed the permissible value of 60 V
established by the document (Technische Richtlinien-
71). Fig. 15 shows a plot corresponding to the
dependency of the current flowing through the pipe
on the x-coordinate. This relationship has a
maximum, which corresponds to the value of x = 10
km.
Figure 14: Induced voltages on the pipeline as a function of
the x-coordinate.
Figure 15: Currents flowing through the pipe in the case of
the balanced load power flow as a function of the x-
coordinate.
Fig. 16 shows the dependencies of induced
voltages on the x-coordinate, obtained for unbalanced
power flows, caused by switching off the shunt
reactors. For certainty, we chose the reactors installed
in phase A. We considered the power flows in the
case of shutdowns of the reactors installed at the
points corresponding to the following values of the x-
coordinate: 150, 300, 450, 600, 750 km. The
asymmetry resulting from the shutting down of the
reactors led to an increase in induced voltages. The
greatest increase in IV was observed at the points
located along the edges of the structure. The IV
maximum, exceeding the permissible value of 60 V,
occurred in the power flow with the shutdown of the
shunt reactor installed at the point corresponding to
the x-coordinate of 150 km, Fig. 17.
Figure 16: Induced voltages under unbalanced power flow
caused by reactor shutdown in phase A as a function of the
x coordinate.
Figure 17: Maximum induced voltages in the case with
reactors shut down.
Fig. 18 shows vector diagrams, built by means of
the Fazonord software package, for the power flow of
asymmetrical short circuits occurring at the point x =
50 km, which corresponds to the right end of the
section where the pipeline and the transmission line
SMARTGREENS 2023 - 12th International Conference on Smart Cities and Green ICT Systems
46

run in close proximity. From the analysis of the above
diagrams, we can conclude that during a two-phase
short circuit fault, the currents flowing through the
phases of the transmission line had a phase shift close
to 180º.
a)
b)
Figure 18: Vector diagrams of long-distance transmission
line currents in short-circuit power flows: a - two-phase
short circuit between phases C-B; b - single-phase short
circuit (phase A).
Figs. 19 to 22 show the results of calculation of
the induced voltages and currents flowing in the pipe
during asymmetrical short circuits in the long-
distance UHV transmission line. In the case of single-
phase short circuits, due to a pronounced
electromagnetic imbalance, the maximum induced
voltages reached 700 V (Fig. 19) but did not exceed
the maximum permissible value of 1,000 V, as
established by the document (Technische Richtlinien-
71). In this power flow, currents exceeding 800 A
were flowing through the pipeline (Fig. 20). The
magnitudes of the induced voltages and especially of
the currents depend on the choice of the faulty phase.
In the case of a single-phase short circuit, the
maximum IV and currents in the pipeline were
observed when phase C was shorted to ground (Fig.
20).
In the two-phase short-circuit power flow, due to
the different direction of currents flowing through the
current-conducting parts of the long-distance
transmission line (Fig. 18), the values of induced
voltages and currents in the pipe are much lower than
in the case of single-phase short circuits (Fig. 21, 22).
Figure 19: Induced voltages for a single-phase short circuit
at the point x = 50 km as a function of the x-coordinate.
Figure 20: Currents flowing in the pipeline as a function of
the x-coordinate in the case of a single-phase short circuit
at the point x = 50 km.
Figure 21: Induced voltages as a function of the x-
coordinate in the case of a two-phase short circuit at the
point x = 50 km.
Digital Models for Power Flow Analysis and Calculation of Electromagnetic Interference Effects of Long-Distance Ultrahigh-Voltage
Transmission Lines
47
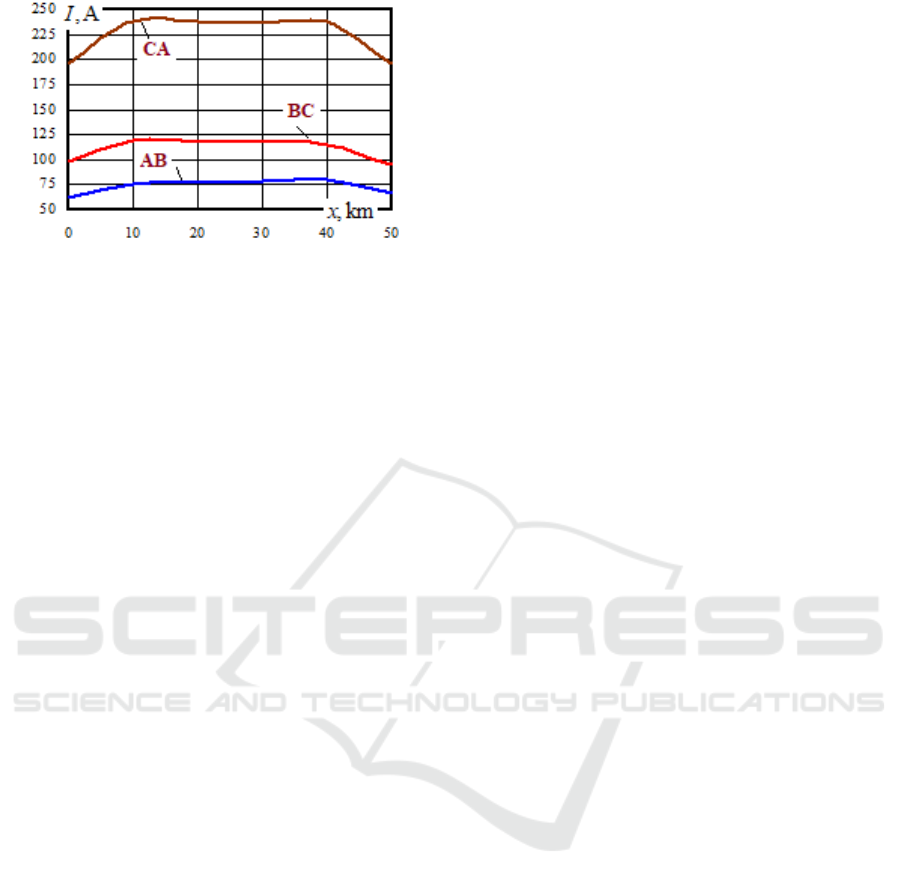
Figure 22: Currents flowing in the pipeline as a function of
the x-coordinate in the case of a two-phase short circuit at
the point x = 50 km.
4 CONCLUSIONS
We have developed digital models that allow for the
comprehensive modeling of power flows of electric
power systems that have long-distance ultrahigh-
voltage transmission lines as their part. Furthermore,
based on these models it is possible to determine EMF
strengths and induced voltages occurring on the
adjacent above-ground pipeline.
The results of modeling of a long-distance 1,150
kV transmission line with loads at the receiving end
of 300 + j 200 MVA per phase allowed us to draw the
following conclusions:
1. Specific power losses per kilometer of
transmission line ranged from 8.6 to 16.4 kW. The
losses as a percentage of the transmitted active power
were in the range 0.14...0.27%.
2. There was insignificant asymmetry observed at
the nodal points of the long-distance transmission
line, which did not exceed the permissible limits.
3. In the case of a normal power flow with
balanced loads, the induced voltage levels did not
exceed the permissible limit of 60 V.
4. In the case of single-phase short-circuit power
flows, the maximum induced voltages reached 700 V,
but did not exceed the maximum permissible value
set in TRL-71. The maximum IV level occurs when
phase C, whose wires were closest to the pipe, were
shorted. The maximum current flowing in the
pipeline reached 824 A. Because of the opposite
direction of currents flowing through the current-
carrying parts of the long-distance transmission line
during a two-phase short-circuit, the values of
induced voltages and currents in the pipe were much
lower than during a single-phase short circuit. The IV
maximum reached 200 V and occurred when phases
CA were short-circuited. In the above case, currents
of up to 240 A were flowing through the pipe.
Potential applications of the proposed models
cover a rather wide range of tasks. They can provide
the basis for addressing the following issues: analysis
of normal, unbalanced, incomplete-phase, and non-
sinusoidal power flows of electric power systems that
have long-distance transmission lines as their part;
analysis of electromagnetic safety conditions along
the routes of such lines and substations adjoining
them; choice of rational measures to protect
technicians of adjacent structures located in the areas
of electromagnetic interference effects of long-
distance-transmission lines, etc.
The developed numerical models lend themselves
to a rather straightforward modification to account
also for cases where a long-distance transmission line
and an adjacent steel structure run in close proximity
following non-parallel trajectories.
ACKNOWLEDGEMENTS
The research was carried out within the framework of
the state task "Conducting applied scientific research"
on the topic "Development of methods, algorithms
and software for modeling the modes of traction
power supply systems for DC railways and
electromagnetic fields at traction substations for AC
railways".
REFERENCES
Li, Y., He, J., Yuan, J., Chen Li, Hu, J., Zeng, R.(2013).
Failure Risk of UHV AC Transmission Line
Considering the Statistical Characteristics of Switching
Overvoltage Waveshape. IEEE Transactions on Power
Delivery, vol. 28, no. 3, pp. 1731 - 1739.
Podkovalnikov S.V., Saveliev V.A., Chudinova L.Yu.
(2015). Study of the systemic energy-economic
efficiency of the formation of the interstate energy
association of North-East Asia . News of the Russian
Academy of Sciences. Energy. No. 5., pp. 16-32.
Bulatov, Y., Kryukov, A., Suslov, K. (2022). Integrated
Modeling of the Modes of High Voltage Long Distance
Electricity Transmission Lines. In 9th International
Conference on Electrical and Electronics Engineering,
ICEEE 2022, pp. 45–49.
Wang, S., Shang, L. (2021) Research on Power Frequency
Over-voltage And Suppression Measures Of Ultra-high
Voltage Trans-mission Lines. In IEEE 5th Advanced
Information Technology, Electronic and Automation
Control Conference (IAEAC), vol. 5.
Shao, W., Wang, J., Peng, J. (2012). Reclosing Over-
Voltage Analysis for Single-Phase Reclosure in UHV
Transmission Lines. In 2012 Asia-Pacific Power and
Energy Engineering Conference.
SMARTGREENS 2023 - 12th International Conference on Smart Cities and Green ICT Systems
48

Wang, X., Xiang, Z., Li, Z. (2018). Overvoltage and
Restriction of 1000kV Long-Distance Transmission
Lines in Weak System. In 2nd IEEE Conference on
Energy Internet and Energy System Integration (EI2).
Zhang, L., Zhang, C., Shi, W., Zhang, B. (2020). Research
on insulation coordination of UHV half-wavelength
power transmission line. In 16th IET International
Conference on AC and DC Power Transmission
(ACDC 2020).
Golov, V., Kalutskov, A., Kormilitsyn, D. (2020)
Controlled Series Compensation of High Voltage Lines
to Increase Transmission Capacity. In International
Ural Conference on Electrical Power Engineering
(UralCon).
Xue, S., He, J., Xu, L., Sun, J. (2011) Study of Self-
Excitation Over-Voltage and Switching Over-Voltage
and Their Suppression Measure in Ultra-High Long
Distance Transmission Lines. In Asia-Pacific Power
and Energy Engineering Conference.
Xue, S., He, J., Xu, L., Wang, Y. (2011) Search scheme of
self-excitation over-voltage in UHV long transmission
lines. In International Conference on Advanced Power
System Automation and Protection, vol. 2.
Rahul, G. P., Teja, O. N., Shivani P. G., Deepa, K.,.
Manitha, P.V., Sailaja V. (2020). Long Distance Power
Transmission System with ZVS Ultra-Lift Luo
Converter from Large Photovoltaic Generation. In
Third International Conference on Smart Systems and
Inventive Technology (ICSSIT)
Long, C.S., Chun, S.H., Zhi, W.Y., Fang, Z. (2008).
Distance protection scheme with traveling wave for
UHVDC transmission line based on wavelet transform.
In Third International Conference on Electric Utility
Deregulation and Restructuring and Power
Technologies.
Dias, R., Lima, A., Portela, C., Aredes, M. (2011). Extra
Long Distance Bulk Power Transmission. IEEE
Transactions on Power Delivery. vol. 26. Issue 3.
Davydov, G. I., Vasilyev, P. F. (2019). Flexible Systems for
the Transmission of Electrical Energy Over Long
Distances. In International Science and Technology
Conference "EastConf".
Aleksandrov, G. N. (2006) Modes of operation of overhead
power lines. St. Petersburg,. 138 p. (in Russian)
Ryzhov, Yu. P. (2007). Long-distance transmission lines of
ultra-high voltage. Moscow, 488 p. (in Russian)
Ananicheva, S. S., Bartolomei, P. I., Myzin, A. L.
Transmission of electricity over long distances.
Ekaterinburg, 1993. 80 p. (in Russian)
Zakaryukin, V. P., Kryukov A. V. (2005). Complicated
asymmetrical modes of electrical systems. Irkutsk, 273
p. (in Russian)
Zakaryukin, V. P., Kryukov, A. V., Le Thao Van (2020).
Complex modeling of multi-phase, multi-circuit and
compact transmission lines. Irkutsk,. 296 p. (in
Russian)
Kryukov, A., Suslov, K., Van Thao, L., Hung, T.D.,
Akhmetshin, A. (2022).Power Flow Modeling of Multi-
Circuit Transmission Lines. Energies, vol. 15 (21),
8249.
Technische Richtlinien-71 (TRL-71). EMR-Technic
Kathodischer Korrosionsschutz fur
Erdgasfernleitungen. P. 80.
Digital Models for Power Flow Analysis and Calculation of Electromagnetic Interference Effects of Long-Distance Ultrahigh-Voltage
Transmission Lines
49
