
Towards a Topological Map-Matching Algorithm for Solid Waste
Collection Systems
Carola A. Blazquez
1 a
, Roberto Le
´
on
2 b
and Luis Delgado
3
1
Department of Engineering Sciences, Universidad Andres Bello, Quillota 980, Vi
˜
na del Mar, Chile
2
Departamento de Inform
´
atica, Universidad T
´
ecnica Federico Santa Mar
´
ıa, Av. Espa
˜
na 1680, Valpara
´
ıso, Chile
3
Faculty of Engineering, Universidad Andres Bello, Quillota 980, Vi
˜
na del Mar, Chile
Keywords:
GPS, Intelligent Transportation Systems, Algorithm, Waste Management.
Abstract:
Global Navigation Satellite Systems (GNSS) such as Global Positioning Systems (GPS) are employed in
different Intelligent Transportation Systems (ITS) applications to determine vehicle routes. However, the
map-matching problem emerges when GPS measurements are assigned to incorrect road segments on a digital
map due to the complexities of the road network and errors from different sources when capturing GPS data.
This study presents a Topological Map-Matching Algorithm (TMMA) for determining correct waste collection
vehicle routes using GPS measurements in an offline context to help improve solid waste collection services
and compute proper performance measures. The TMMA is applied to a real-world case study with ten waste
collection routes in the commune of Renca in Santiago, Chile. Overall, results indicate that the accuracy of the
algorithm is greater than 90%, and small percentages of false negative cases with unsnapped GPS data points
are obtained for most vehicle routes. The sensitivity analysis suggests that larger buffer sizes and higher speed
tolerances yield the best solution quality and execution times.
1 INTRODUCTION
In 2016, the estimated generation of urban solid waste
worldwide was approximately 2.01 billion tons and
was estimated to reach 3.4 billion tons by 2050 (Kaza
et al., 2018; Rojas et al., 2018). As population, ur-
banization, and industrialization increase, authorities
must address this accelerated solid waste production
rate by implementing adequate solid waste manage-
ment systems (Khandelwal et al., 2019). However,
in most developing countries, unsatisfactory policies,
regulatory structures, and inefficient solid waste man-
agement negatively impact society, the environment,
and the economy. Urban solid waste is usually col-
lected using a manual approach (door-to-door) based
on field experience and intuition, generating high op-
erational and transportation costs, low service qual-
ity, high traffic congestion, a large amount of green-
house gas emissions, and high health risk (Blazquez
and Vonderohe, 2009; Blazquez and Paredes-Belmar,
2020; Letelier et al., 2022). In addition, municipali-
ties spend between 20% and 50% of their budget on
a
https://orcid.org/0000-0003-4760-885X
b
https://orcid.org/0000-0002-7164-1783
solid waste management, of which 50% to 70% cor-
responds to waste collection and transportation tasks
(Erfani et al., 2017; Blazquez and Paredes-Belmar,
2020; Letelier et al., 2022).
To overcome these issues, in the last decade,
there has been an increase in the use of informa-
tion and communication technologies for solid waste
management services as part of smart cities (Ricardo
et al., 2018; Vishnu et al., 2021). In particular, the
use of Global Positioning Systems (GPS) technology
has improved tremendously the solid waste collec-
tion process, which is the most expensive within the
solid waste value chain (Ghiani et al., 2015; Steyn and
Willemse, 2018). Various performance indicators of
the solid waste collection process may be computed
using GPS measurements such as service time, road
traversal time, unloading time, number of stops, fuel
consumption, and vehicle emissions, among others,
to improve the collection service and planning and
minimize operational and transportation costs (Han-
nan et al., 2015; Akram et al., 2021).
GPS measurements must be associated or snapped
to the correct road segment to calculate performance
measures accurately. However, due to the complex-
ities of the road network and errors from different
Blazquez, C., León, R. and Delgado, L.
Towards a Topological Map-Matching Algorithm for Solid Waste Collection Systems.
DOI: 10.5220/0011854100003479
In Proceedings of the 9th International Conference on Vehicle Technology and Intelligent Transport Systems (VEHITS 2023), pages 95-102
ISBN: 978-989-758-652-1; ISSN: 2184-495X
Copyright
c
2023 by SCITEPRESS – Science and Technology Publications, Lda. Under CC license (CC BY-NC-ND 4.0)
95

sources when capturing GPS data, GPS measure-
ments are assigned to incorrect road segments on
a digital map, causing the so-called map-matching
problem (Blazquez and Vonderohe, 2009; Blazquez
et al., 2012; Le
´
on et al., 2020). Figure 1 illustrates an
example of the map-matching problem, in which GPS
data points p
1
and p
3
are correctly snapped to the road
at locations represented by data points s
1
and s
3
, re-
spectively. While data point p
2
is incorrectly snapped
to the closest road segment indicated by point s
2
. The
correct snapping location of the data point p
2
is repre-
sented by point c
2
. Therefore, there is a need for map-
matching algorithms to solve this problem by identi-
fying correct GPS trajectories along the road network.
Figure 1: Example of the map-matching problem. Adapted
from Blazquez et al. (2022).
In the last decades, numerous map-matching al-
gorithms have been proposed in the literature rang-
ing from simple geometric techniques to advanced,
complex algorithms such as hidden Markov models,
Kalman filter, and fuzzy logic (Blazquez et al., 2018;
Le
´
on et al., 2020). These algorithms have been imple-
mented to solve the map-matching problem in mul-
tiple Intelligent Transportation Systems (ITS) appli-
cations. For example, as part of an electronic hori-
zon in driver assistance systems, Burgstahler et al.
(2016) utilized a map-matching algorithm for map-
ping vehicle geographical positions onto the digital
road map and determining the correct road segment
being used. In another study by Klitzke et al. (2019),
a map-matching algorithm was used for matching ego
vehicle positions to a digital road map as part of the
test drives in the validation of autonomous driving
systems. Similarly, Kang et al. (2020) employed an
iterative closest point-based map-matching algorithm
for identifying GPS trajectories on a digital road map
in autonomous driving and advanced driver assistance
systems. Ricardo et al. (2018) implemented a map-
matching algorithm to determine bus lines and bus
stops from GPS measurements in Porto, Portugal. A
GIS-based map-matching algorithm was employed by
Scott et al. (2021) to determine bike share users’ route
choices along the cycling network within Hamilton,
Ontario, Canada, using hub-to-hub GPS trajectories.
Regarding solid waste management applications,
most studies employ GPS technology for identify-
ing waste bin levels (Hadria et al., 2018; Anjum
et al., 2022) and waste bin locations (Erdinc¸ et al.,
2019; Mishra and Kumar Ray, 2020; Moral et al.,
2022), monitoring waste collection routes (Steyn and
Willemse, 2018), and planning route scheduling (Wil-
son and Vincent, 2008; Ghiani et al., 2015). How-
ever, scarce studies focus on implementing a map-
matching algorithm to help improve solid waste col-
lection services and compute correct performance
measures by determining the correct route on which
vehicles travel. For instance, Ghiani et al. (2015)
implemented an automated classification and estima-
tion algorithm for estimating service time at collec-
tion points and traversal times along different roads.
This study addresses the map-matching problem
by presenting a Topological Map-Matching Algo-
rithm (TMMA) implemented offline for determining
correct waste collection vehicle routes using mea-
sured data (position, timestamp, and vehicle speed).
The proposed TMMA uses parts or all GPS measure-
ments to resolve the map-matching problem. Addi-
tionally, computational experiences are reported us-
ing real-world GPS data collected by waste collection
vehicles in the commune of Renca in Santiago, Chile.
A sensitivity analysis is conducted to identify the im-
pact of the algorithm parameters on the solution qual-
ity and execution time.
2 TOPOLOGICAL
MAP-MATCHING ALGORITHM
Among the map-matching algorithms found in the
literature, TMMAs have been preferred in ITS ap-
plications since they are simple, efficient, fast, and
easy to implement (Hashemi and Karimi, 2014; Gupta
and Shanker, 2022). TMMAs employ link connectiv-
ity and contiguity to compute the shortest paths and
travel time between pairs of GPS measurements. Nor-
mally, TMMAs use different algorithmic parameters
related to buffer size for finding snapping locations of
GPS measurements along road segments, information
on traffic flow or congestion, and road features such as
speed limit and the number of lanes. In this study, the
TMMA utilizes two distinct parameters (buffer size
and speed range tolerance), explained below.
VEHITS 2023 - 9th International Conference on Vehicle Technology and Intelligent Transport Systems
96

start
fw = False
k
i
→ k
j
alt k
j
k
i
→ alt k
j
alt k
i
k
i−1
→ k
i
k
i
→ k
j
j − i ≤ N
FID(k
j
) = 0
fw == False
k
i
= k
i−1
fw = False
k
j
= k
j+1
fw = True
j − i > 1
end
Assign FID to snap
points k
p
for each
p = i + 1, ..., j − 1
fw : dummy boolean variable (backward or forward)
k
i
→ k
j
: shortest path between snapped points k
i
and k
j
N : maximum amount of consecutive data points.
alt k
i
: alternative centerline to snapped point k
i
alt k
j
: alternative centerline to snapped point k
j
NO
YES
NO
YES
NO
YES
NO
YES
NO
YES
NOYES
YES
NO
NO
Figure 2: Flow diagram of the TMMA. Adapted from Le
´
on
et al. (2020).
Figure 2 shows the flow diagram of the TMMA
used in this study. Once road segment candidates are
selected as possible snapping locations within buffers
around GPS data points, the TMMA tests pairs of
GPS points by snapping them to the closest road seg-
ment candidate and computing shortest paths between
pairs of snapped GPS points k
i
and k
j
. Subsequently,
travel speeds are calculated using distances of the
shortest paths and time differences between times-
tamps and are compared with the average vehicle
speeds recorded with each GPS measurement. Cur-
rent snapped locations of the GPS points are accepted
when the average vehicle speeds are within a speed
range tolerance of the travel speeds. On the contrary,
current snapped locations of the GPS points are re-
jected, and other snapping locations (alt k
i
and alt
k
j
) on alternative road segment candidates are tested,
shortest paths are recomputed, and speeds are com-
pared again. If there are no feasible routes between
snapped locations of GPS points, then the TMMA
tests with preceding and succeeding GPS points until
the map-matching problem is solved or a predefined
number of maximum consecutive GPS points (N) is
reached.
Note that those GPS points with no snapping loca-
tions on the correct road segment (i.e., false negatives
with FID(k
j
) = 0) are forced to snap to the closest road
segment that comprises viable routes between preced-
ing and succeeding GPS points. If GPS points k
p
with
p = i + 1, ..., j − 1 have no snapping locations on any
road segment (false negatives), and if a valid route ex-
ists between snapped points k
i
and k
j
, therefore, these
points are snapped to their closest road segments that
belong to this viable route and are assigned the FID
of the road.
3 CASE STUDY
3.1 Study Area
The capital city of Chile, Santiago, produces approx-
imately 43% of the total waste generated nationwide
(Rojas et al., 2018). This study focuses on the com-
mune of Renca, one of the 34 communes that consti-
tute the Great Santiago, with a population of 147,151
inhabitants and an area of 24.0 km
2
(INE, 2017).
Renca generates over 70,000 tons of municipal solid
waste every year, representing approximately 24.5%
more than the total average waste generation of the
country. Currently, Renca has a waste collection
system comprising a door-to-door collection using a
single-compartment compactor truck and two or three
crew members per truck responsible for collecting
waste from the curbside and throwing it in the rear
of the truck for compaction (Blazquez and Paredes-
Belmar, 2020).
3.2 Data
This study applied the TMMA to 10 waste collection
vehicle routes shown in Figure 3. This figure depicts
350 GPS measurements captured every 30 seconds in
the commune of Renca. The vehicle routes include
different types of roads (e.g., local and major roads
and highways), as shown in Table 1.
Figure 4 presents the basic statistics of the
recorded vehicle speeds for each route obtained from
the data measurements. This figure shows the fluc-
tuation of vehicle speeds for different types of roads.
Overall, lower speeds are observed for vehicle routes
along local roads, while higher speeds are perceived
along major roads and highways. Note that no differ-
ential GPS or other GPS position accuracy improve-
ment methods are available in this study.
Towards a Topological Map-Matching Algorithm for Solid Waste Collection Systems
97
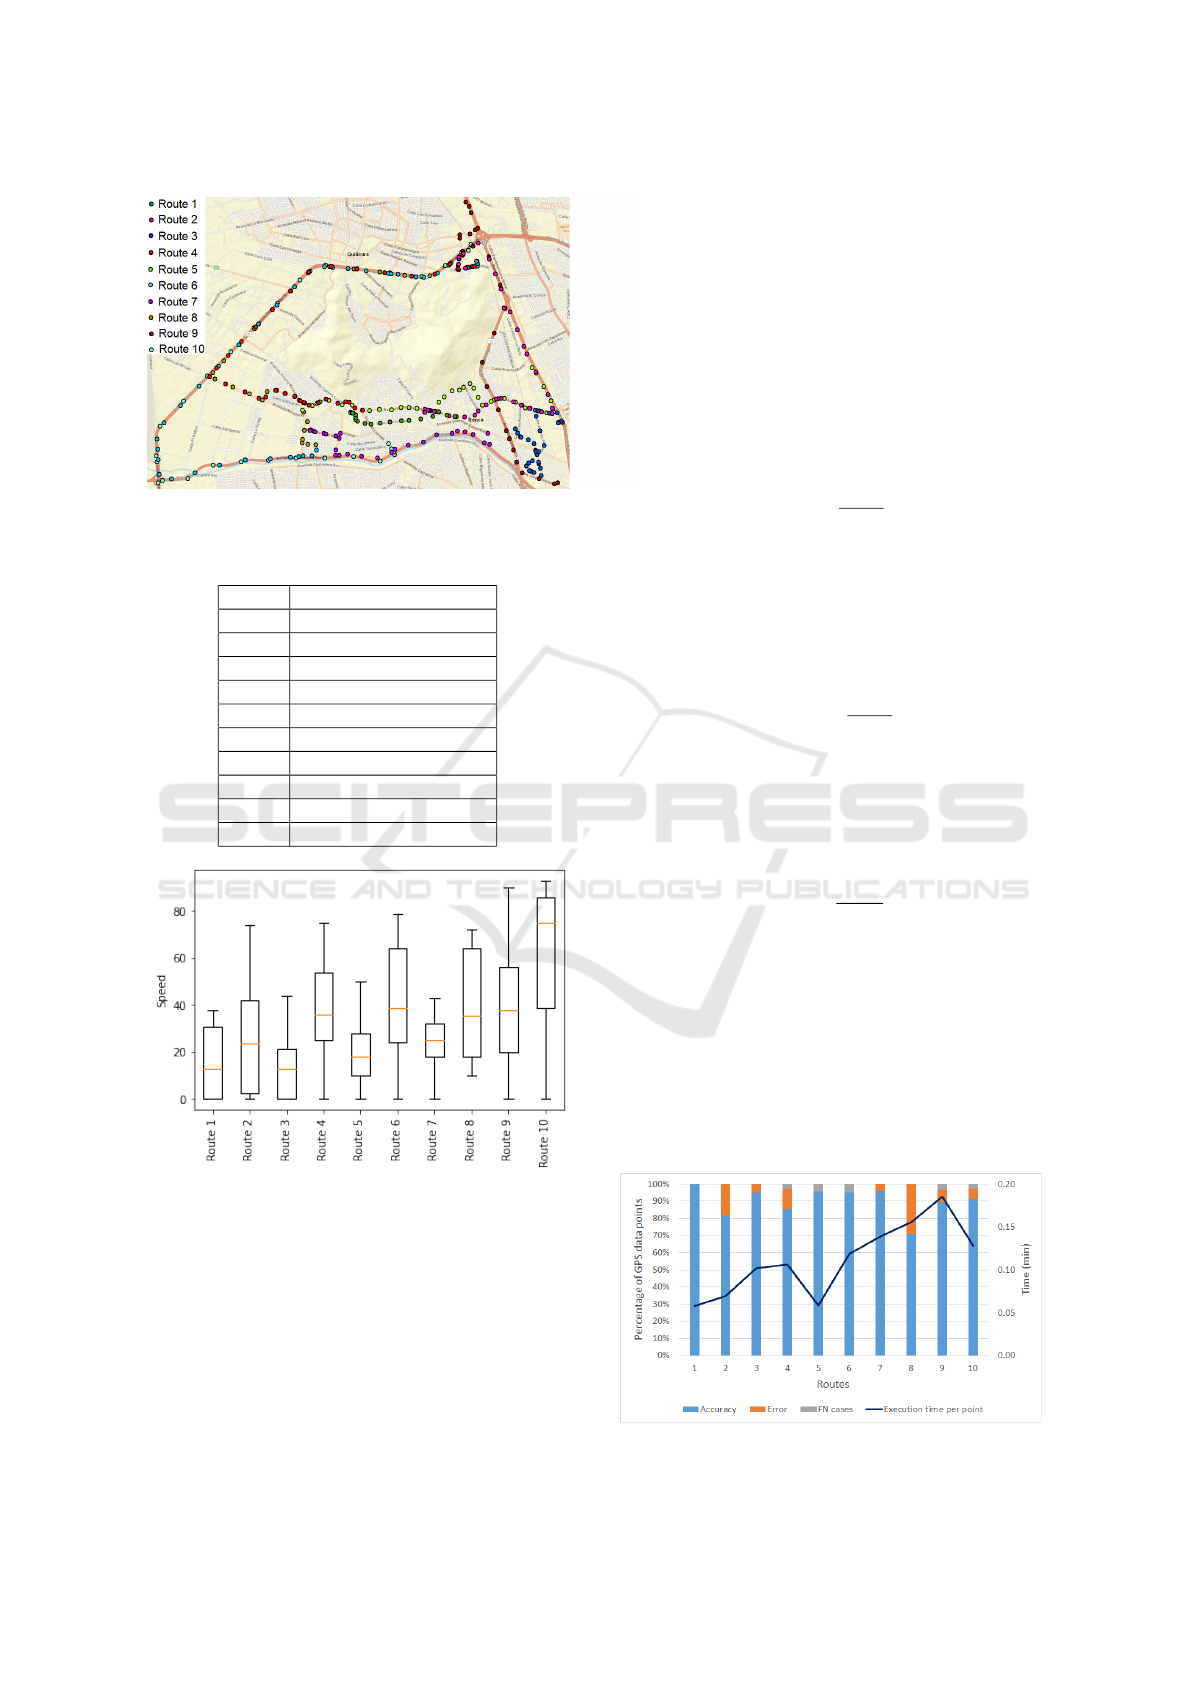
Figure 3: GPS measurements for the waste collection vehi-
cle routes.
Table 1: Road types for each route.
Route Type of Road
1 Local roads
2 Major roads/Highways
3 Local roads
4 Major roads/Highways
5 Local and major roads
6 Highways
7 Major roads/Highways
8 Major roads/Highways
9 Major roads/Highways
10 Highways
Figure 4: Distribution of vehicle speeds in km/hr for each
route.
4 RESULTS
4.1 Performance of the TMMA
The performance of the TMMA is evaluated using the
accuracy (i.e., correct snaps of GPS measurements),
error (i.e., incorrect snaps of GPS measurements),
false negative (FN) cases, and execution times. FN
cases correspond to GPS measurements that are not
associated with any road segment candidate since the
buffer size is too small when these measurements
should have snapped to a certain road segment.
The accuracy is computed with Equation (1),
where p
r
c
is a GPS measurement or data point of a
vehicle route r that is snapped to the correct road seg-
ment with c = 1, ...,C, p
r
n
is a GPS data point of a
vehicle route r with n = 1, ..., N, C is the total num-
ber of correctly snapped GPS data points, and N is the
total number of GPS data points.
Acc
r
=
∑
c
p
r
c
∑
n
p
r
n
(1)
Similarly, Equation (2) is used to calculate the er-
ror for each vehicle route, where p
r
o
is a GPS data
point of a vehicle route r that is snapped to the incor-
rect road segment with o = 1, ..., O, and O is the total
number of GPS data points snapped to incorrect road
segments.
Error
r
=
∑
o
p
r
o
∑
n
p
r
n
(2)
FN cases (FN
r
) are computed with Equation (3)
for each vehicle route, where p
r
f
is a GPS data point
of a vehicle route r that is considered an FN case with
f = 1, ..., F, and F is the total number of GPS data
points that are not snapped to any road segment.
FN
r
=
∑
f
p
r
f
∑
n
p
r
n
(3)
Figure 5 shows the performance results of the
TMMA for the analyzed vehicle routes using a base
case scenario with a buffer size of 20 meters and a
speed range tolerance of 20 km/hr. This figure in-
dicates that the accuracy for most vehicle routes is
greater than 90%. Errors arising from the snapping
of GPS trajectories to incorrect road segments for
Routes 2, 4, and 8 occur mainly along highways be-
cause the algorithm assigns GPS data points to viable
side roads parallel to the highways. Further research
Figure 5: Performance results of the TMMA.
VEHITS 2023 - 9th International Conference on Vehicle Technology and Intelligent Transport Systems
98
should include the revision of the TMMA for address-
ing this type of issue, perhaps by also capturing the
vehicle heading to accept those road segment candi-
dates with directions (azimuth angle) that are within
a predefined heading range tolerance, as in Blazquez
et al. (2012), Blazquez et al. (2022) and Chen et al.
(2019).
A small percentage of FN cases (on average,
< 1.9%) is observed in the 10 tested routes of Fig-
ure 5. Therefore, the TMMA satisfactorily forces the
snap of most GPS points with no associated road seg-
ments to the routes between preceding and succeeding
GPS points. The remaining FN cases occur for some
routes when the vehicles enter the transfer station to
unload the collected waste, and there is no road rep-
resentation in a digital form.
Figure 5 presents the computing time per point
for each tested route. The average execution time
per GPS point among all routes is approximately 0.12
minutes. This figure suggests that the TMMA needs
a higher execution time to solve the map-matching
problem for some routes, particularly those with a
larger percentage of GPS data points that are snapped
to incorrect road segments. On the contrary, routes
that reach an accuracy of nearly 100% require smaller
times in the execution to solve the problem, such as
with Route 1.
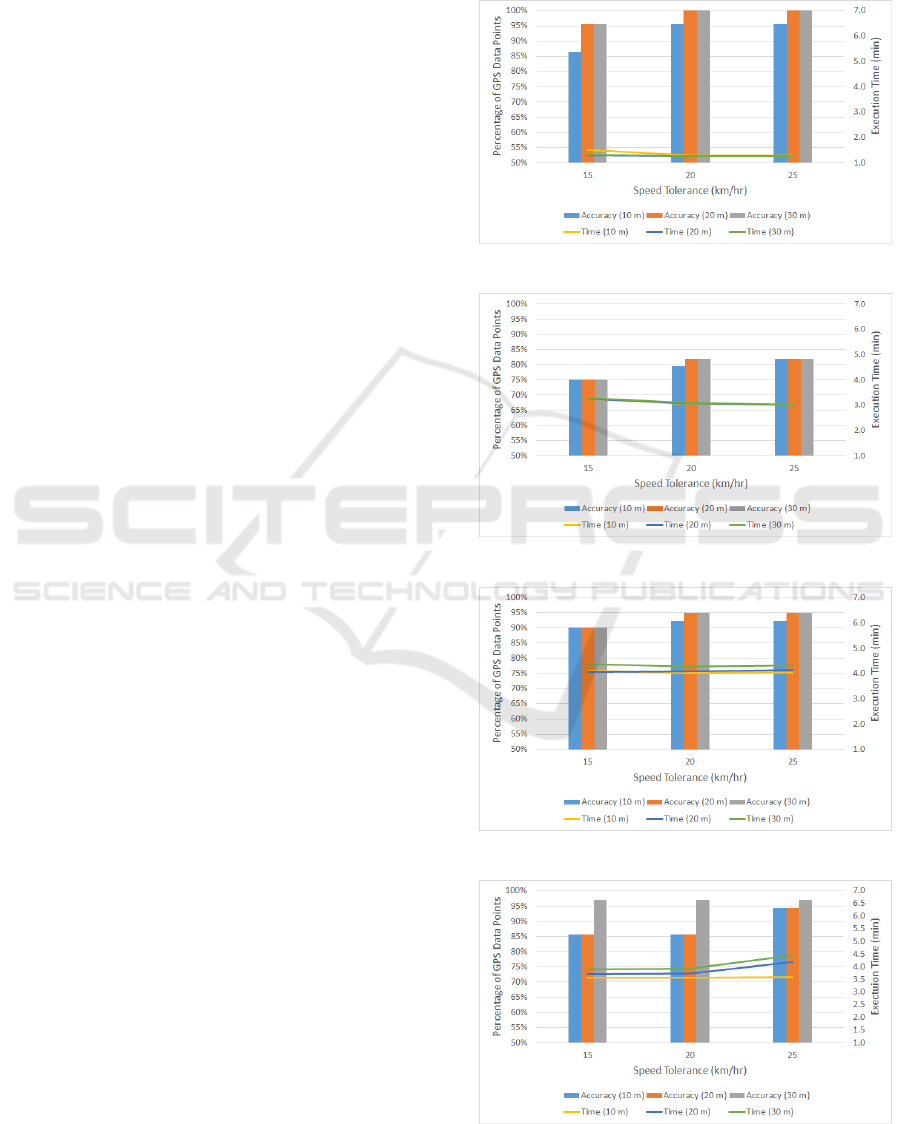
4.2 Sensitivity Analysis
This subsection presents the results of the sensitivity
analysis of the TMMA for buffers sizes of 10, 20,
and 30 meters and speed tolerances of 15, 20, and
25 km/hr. Figures 6-15 depict the variation of the ac-
curacy and the execution times of the TMMA for each
route as the buffer size and the speed tolerance fluc-
tuate. Overall, the graphs in these figures show that
better results, in terms of accuracy, are obtained with
larger buffer sizes (> 20 meters) and higher speed
tolerances (> 25 km/hr), independent of the type of
roads that comprise each route.
Additionally, the figures indicate that the execu-
tion times of the algorithm remain relatively constant
as the speed tolerance increases from 15 to 25 km/hr
and the buffer size increases from 10 to 30 meters,
except for Routes 4 and 8 (Figures 9 and 13, respec-
tively). The latter routes present a higher comput-
ing time of the TMMA in a complicated part of the
road network for two possible reasons. First, when
increasing the speed tolerance, the shortest paths be-
tween pairs of incorrect snapped GPS data points are
accepted, which are subsequently corrected by the
TMMA as preceding and succeeding GPS data points
are tested. Second, if the buffer size increases, then
a higher number of road segment candidates are se-
lected within each buffer of the GPS data point, and
more alternative snapping locations along different
road segments for the GPS points are examined.
Figure 6: Sensitivity analysis for Route 1.
Figure 7: Sensitivity analysis for Route 2.
Figure 8: Sensitivity analysis for Route 3.
Figure 9: Sensitivity analysis for Route 4.
Towards a Topological Map-Matching Algorithm for Solid Waste Collection Systems
99
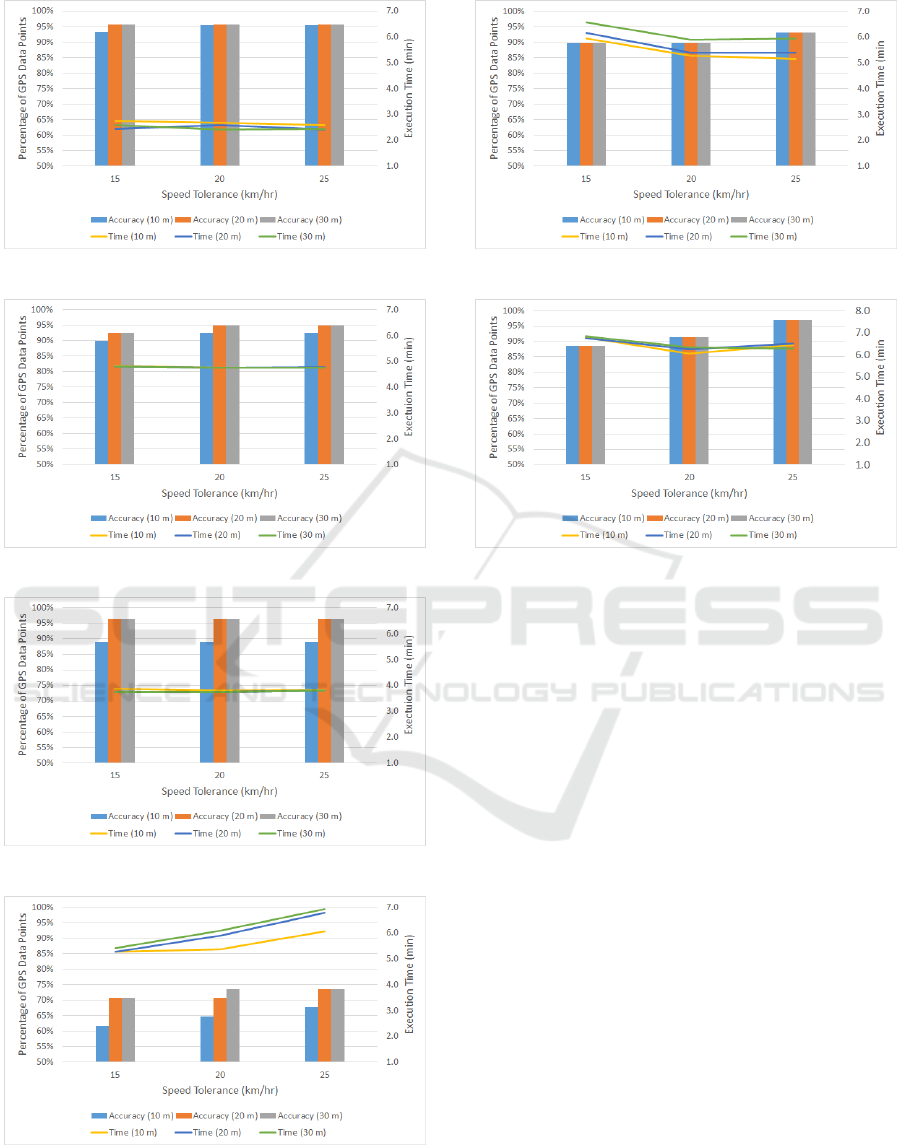
Figure 10: Sensitivity analysis for Route 5.
Figure 11: Sensitivity analysis for Route 6.
Figure 12: Sensitivity analysis for Route 7.
Figure 13: Sensitivity analysis for Route 8.
Figure 14: Sensitivity analysis for Route 9.
Figure 15: Sensitivity analysis for Route 10.
Table 2 presents the percentage of FN cases for
different speed tolerance and buffer size parameter
values. This table indicates that road segment can-
didates are assigned to GPS data points as the buffer
size increases, and thus, the percentage of FN cases
diminishes. Routes 1, 2, 3, and 7 are not listed since
these routes have no FN cases as the parameter val-
ues vary. The percentage of FN cases for most routes
does not fluctuate as the speed tolerance increases.
5 CONCLUSIONS
This study employs a TMMA for determining correct
waste collection routes to improve solid waste collec-
tion services and compute appropriate performance
measures (e.g., service time, road traversal time, un-
loading time, number of stops, fuel consumption, ve-
hicle emissions, etc.). The TMMA was tested with
ten vehicle routes in the commune of Renca in Santi-
ago, Chile. Results of the TMMA are presented for a
base case and sensitivity analysis of different parame-
ter models. Overall, for the base case, more than 90%
of the GPS data points are snapped to correct road
segments for most routes, a small percentage of FN
cases exist for most routes, and the average execution
time per GPS point is approximately 0.12 minutes.
VEHITS 2023 - 9th International Conference on Vehicle Technology and Intelligent Transport Systems
100

Table 2: FN cases for different tested buffer sizes.
Speed Tolerance Buffer Size
10m 20m 30m
Route 4
15 km/hr 0.0% 0.0% 0.0%
20 km/hr 0.0% 2.9% 2.9%
25 km/hr 0.0% 0.0% 0.0%
Route 5
15 km/hr 4.3% 4.3% 4.3%
20 km/hr 4.3% 4.3% 4.3%
25 km/hr 4.3% 4.3% 4.3%
Route 6
15 km/hr 7.5% 5.0% 5.0%
20 km/hr 7.5% 5.0% 5.0%
25 km/hr 7.5% 5.0% 5.0%
Route 8
15 km/hr 8.8% 2.9% 2.9%
20 km/hr 2.9% 0.0% 0.0%
25 km/hr 0.0% 0.0% 0.0%
Route 9
15 km/hr 2.9% 2.9% 2.9%
20 km/hr 2.9% 2.9% 2.9%
25 km/hr 2.9% 2.9% 2.9%
Route 10
15 km/hr 0.0% 0.0% 0.0%
20 km/hr 2.9% 0.0% 0.0%
25 km/hr 0.0% 0.0% 0.0%
The sensitivity analysis suggests a tendency to
yield improved solution quality with larger buffer
sizes and higher speed tolerances. The execution
time of the TMMA remains approximately constant
as the parameters are varied, except for a couple
of routes, in which GPS measurements are captured
along parallel roads (e.g., highways and side roads).
Thus, the TMMA should be revised in future research
to address map-matching problems that arise when
there are equally viable paths between pairs of GPS
points. In addition, further research should test the
TMMA with different sampling frequencies and ve-
hicle routes from other communes or cities to identify
the appropriate algorithm parameters for each tested
data sets. Finally, future research should compare the
results of this study with a proper benchmark.
GPS technology aids in determining correct ve-
hicle routes to increase the effectiveness of waste
collection systems, which are imperative for reduc-
ing negative impacts on the environment and society.
Thus, municipal authorities must make informed de-
cisions to address the current accelerated solid waste
production rate, particularly in urban areas. A real-
time TMMA may be required to monitor and surveil
a fleet of waste collection vehicles.
ACKNOWLEDGEMENTS
This study was financially supported by the
Chilean Government through FONDEF IdeA
Grant ID22I10107 and Universidad Andres Bello
through Project N°DI-01-20/REG.
REFERENCES
Akram, S. V., Singh, R., Gehlot, A., Rashid, M., AlGhamdi,
A. S., Alshamrani, S. S., and Prashar, D. (2021). Role
of wireless aided technologies in the solid waste man-
agement: A comprehensive review. Sustainability,
13(23):13104.
Anjum, M., Sarosh Umar, M., and Shahab, S. (2022).
Iot-based novel framework for solid waste manage-
ment in smart cities. In Smys, S., Balas, V. E., and
Palanisamy, R., editors, Inventive Computation and
Information Technologies, pages 687–700, Singapore.
Springer Nature Singapore.
Blazquez, C., Le
´
on, R., P
´
erez, F., and Delgado, L. (2022).
Pre-processing techniques for improving a topological
map-matching algorithm. In 2022 41st International
Conference of the Chilean Computer Science Society
(SCCC), pages 1–6.
Blazquez, C., Miranda, P., and Ponce, A. (2012). Perfor-
mance of a new enhanced topological decision–rule
map-matching algorithm for transportation applica-
tions. Journal of applied research and technology,
10(6):929–940.
Blazquez, C. and Paredes-Belmar, G. (2020). Network de-
sign of a household waste collection system: A case
study of the commune of renca in santiago, chile.
Waste Management, 116:179–189.
Blazquez, C., Ries, J., Miranda, P. A., and Le
´
on, R. J.
(2018). An instance-specific parameter tuning ap-
proach using fuzzy logic for a post-processing topo-
logical map-matching algorithm. IEEE Intelligent
Transportation Systems Magazine, 10(4):87–97.
Blazquez, C. A. and Vonderohe, A. P. (2009). Effects of
controlling parameters on performance of a decision-
rule map-matching algorithm. Journal of Transporta-
tion Engineering, 135(12):966–973.
Burgstahler, D., Peusens, C., B
¨
ohnstedt, D., and Steinmetz,
R. (2016). Horizon. kom: A first step towards an open
vehicular horizon provider. In VEHITS, pages 79–84.
Chen, C., Ding, Y., Xie, X., Zhang, S., Wang, Z.,
and Feng, L. (2019). Trajcompressor: An online
map-matching-based trajectory compression frame-
work leveraging vehicle heading direction and change.
IEEE Transactions on Intelligent Transportation Sys-
tems, 21(5):2012–2028.
Erdinc¸, O., Yetilmezsoy, K., Ereno
˘
glu, A. K., and Erdinc¸,
O. (2019). Route optimization of an electric garbage
truck fleet for sustainable environmental and en-
ergy management. Journal of Cleaner Production,
234:1275–1286.
Towards a Topological Map-Matching Algorithm for Solid Waste Collection Systems
101

Erfani, S. M. H., Danesh, S., Karrabi, S. M., and Shad, R.
(2017). A novel approach to find and optimize bin
locations and collection routes using a geographic in-
formation system. Waste Management & Research,
35(7):776–785.
Ghiani, G., Guerrieri, A., Manni, A., and Manni, E. (2015).
Estimating travel and service times for automated
route planning and service certification in municipal
waste management. Waste Management, 46:40–46.
Gupta, A. K. and Shanker, U. (2022). A comprehensive
review of map-matching techniques: Empirical anal-
ysis, taxonomy, and emerging research trends. Inter-
national Journal of Web Services Research (IJWSR),
19(1):1–32.
Hadria, F. M., Jayanthy, S., Arunraja, A., and Vigneswaran,
E. E. (2018). Iot based smart waste management us-
ing top k-query scheduling. In 2018 Second Interna-
tional Conference on Intelligent Computing and Con-
trol Systems (ICICCS), pages 448–452. IEEE.
Hannan, M., Al Mamun, M. A., Hussain, A., Basri, H., and
Begum, R. A. (2015). A review on technologies and
their usage in solid waste monitoring and management
systems: Issues and challenges. Waste Management,
43:509–523.
Hashemi, M. and Karimi, H. A. (2014). A critical review
of real-time map-matching algorithms: Current issues
and future directions. Computers, Environment and
Urban Systems, 48:153–165.
INE (2017). 2017 census, instituto nacional de es-
tad
´
ıstica. http://www.censo2017.cl/. accessed:
18.04.2019.
Kang, J. M., Yoon, T. S., Kim, E., and Park, J. B. (2020).
Lane-level map-matching method for vehicle localiza-
tion using gps and camera on a high-definition map.
Sensors, 20(8):2166.
Kaza, S., Yao, L., Bhada-Tata, P., and Van Woerden, F.
(2018). What a waste 2.0: a global snapshot of solid
waste management to 2050. World Bank Publications.
Khandelwal, H., Dhar, H., Thalla, A. K., and Kumar, S.
(2019). Application of life cycle assessment in mu-
nicipal solid waste management: A worldwide critical
review. Journal of cleaner production, 209:630–654.
Klitzke, L., Koch, C., Haja, A., and K
¨
oster, F. (2019). Real-
world test drive vehicle data management system for
validation of automated driving systems. In VEHITS,
pages 171–180.
Le
´
on, R., Blazquez, C., and Depassier, V. (2020). Im-
provements of a topological map-matching algorithm
in post-processing mode. In 2020 39th International
Conference of the Chilean Computer Science Society
(SCCC), pages 1–5. IEEE.
Letelier, C., Blazquez, C., and Paredes-Belmar, G. (2022).
Solving the bin location–allocation problem for
household and recycle waste generated in the com-
mune of renca in santiago, chile. Waste Management
& Research, 40(2):154–164.
Mishra, A. and Kumar Ray, A. (2020). Iot cloud-based
cyber-physical system for efficient solid waste man-
agement in smart cities: a novel cost function based
route optimisation technique for waste collection ve-
hicles using dustbin sensors and real-time road traffic
informatics. IET Cyber-Physical Systems: Theory &
Applications, 5(4):330–341.
Moral, P., Garc
´
ıa-Mart
´
ın,
´
A., Escudero-Vi
˜
nolo, M.,
Mart
´
ınez, J. M., Besc
´
os, J., Pe
˜
nuela, J., Mart
´
ınez,
J. C., and Alvis, G. (2022). Towards automatic
waste containers management in cities via computer
vision: containers localization and geo-positioning in
city maps. Waste Management, 152:59–68.
Ricardo, L., Sargento, S., and Oliveira, I. C. (2018). An
information system for bus travelling and performance
evaluation. In VEHITS, volume 1, pages 395–402.
Rojas, A., Yabar, H., Mizunoya, T., and Higano, Y. (2018).
The potential benefits of introducing informal recy-
clers and organic waste recovery to a current waste
management system: The case study of santiago de
chile. Resources, 7(1):18.
Scott, D. M., Lu, W., and Brown, M. J. (2021). Route
choice of bike share users: Leveraging gps data to
derive choice sets. Journal of Transport Geography,
90:102903.
Steyn, L. J. and Willemse, E. J. (2018). Using vehicle gps
data to infer offloading times of waste collection vehi-
cles at transfer stations. In 2018 International Confer-
ence on Advances in Big Data, Computing and Data
Communication Systems (icABCD), pages 1–6. IEEE.
Vishnu, S., Ramson, S. R. J., Senith, S., Anagnostopou-
los, T., Abu-Mahfouz, A. M., Fan, X., Srinivasan, S.,
and Kirubaraj, A. A. (2021). Iot-enabled solid waste
management in smart cities. Smart Cities, 4(3):1004–
1017.
Wilson, B. G. and Vincent, J. K. (2008). Estimating waste
transfer station delays using gps. Waste management,
28(10):1742–1750.
VEHITS 2023 - 9th International Conference on Vehicle Technology and Intelligent Transport Systems
102
