
Improving Czech Digital Government Based on Quantified Maturity
Model of Enterprise Architecture
Martin Rod
1,2 a
and Jiri Vomlel
2b
1
Faculty of Management, Prague University of Economics and Business, Jarosovksa 1117/II,
Jindrichuv Hradec, 377 01, Czechia
2
Institute of Information Theory and Automation, Czech Academy of Sciences, Pod Vodarenskou vezi 4,
Prague, 182 00, Czechia
Keywords: Enterprise Architecture, Bayesian Networks, Maturity Model, Czech e-Government, Digital Government.
Abstract: One of the current drivers for transitioning from the traditional E-Government to the digital government is
the ability to create and share new services in the governmental ICT landscape. The government must
effectively communicate and offer its services to itself (G2G) and outside, be it an end-consumer or business
(G2C, G2B). Since the government is internally divided, there is a need to measure its parts' performance for
effective management. However, conventional maturity models cannot address and explain the cause of the
differences, and thus typically respond to symptoms and show just winners and losers of the given benchmark.
From this position, a study and a deeper analysis of the maturity model used in the public administration of
Czechia are provided. Further analysis was undertaken via Bayesian networks to answer the question: How
do project management and prioritization affect service level management? Or how the enterprise architecture
as a method is linked to the overall organization's performance? Significant relationships were identified, and
the use of the Bayesian network as a prediction model was proposed. Further evaluation steps and research
opportunities were discussed.
1 INTRODUCTION
The main goal of the presented paper is to obtain and
compare the capabilities of individual public
authorities. Comparison is made from the viewpoint
of the National Architecture of the Czech Republic.
This overview of the current state of the scope of
capabilities of individual actors of public
administration is a suitable but also a necessary
starting point for the design of sustainable other
concepts, solutions, and development of national
architecture. Ultimately, national architecture is the
result of the cooperation of all individual actors.
Among the current problems of deploying and
maintaining corporate architecture in the public
sector are considered causes such as the resistance of
individual authorities to corporate architecture and
the division of roles, setting relevant goals, and the
issue of using corporate architecture in practice. A
partial problem pertinent to this area is the need for a
a
https://orcid.org/0000-0003-3336-265X
b
https://orcid.org/0000-0001-5810-4038
link between qualitative and quantitative data. Also,
specialized and expert experience and skills are
insufficient to manage complex systems (Seppänen et
al., 2018). Al-Kharusi et al. (2018), in a qualitative
case study of the public sector of Oman, elaborates
in-depth on the genesis of the creation of enterprise
architecture, in which the level of knowledge of
stakeholders and its sharing plays a key role.
2 THEORETICAL
BACKGROUNDS
Regarding the current state of maturity models, two
approaches predominate, or domain-specific meta-
models of maturity, for example, as Ostadzadeh and
Shams (2014) have shown in a study of highly
complex and interconnected systems for which
general meta-models were insufficient.
600
Rod, M. and Vomlel, J.
Improving Czech Digital Government Based on Quantified Maturity Model of Enterprise Architecture.
DOI: 10.5220/0011855300003467
In Proceedings of the 25th International Conference on Enter prise Information Systems (ICEIS 2023) - Volume 2, pages 600-607
ISBN: 978-989-758-648-4; ISSN: 2184-4992
Copyright
c
2023 by SCITEPRESS – Science and Technology Publications, Lda. Under CC license (CC BY-NC-ND 4.0)
As Santos-Neto and Costa (2019) introduced,
there is also an exciting trend where many models are
created, but only a part of them is validated and
applied.
2.1 Czech e-Government
From the point of view of the development of
enterprise architecture in the public administration of
the Czech Republic (Czechia), four years have passed
since the first significant standardization processes
commenced. These changes were driven by the
program Digital Czechia (Digitální Česko) (Czechia,
2018b) and strategically mainly with the Information
Strategy of the Czech Republic and its annexes
(Czechia, 2018a).
The annexes: National Architectural Framework
(NAF) and the National Architectural Plan (NAP),
are the backbone for the objectives of Digital
Czechia. This standardization follows the reforms and
concepts of managing the architecture of the public
administration as Hrabě (2013) presented in its work.
One of the central architectural governance
bodies is the Department of the E-Government Chief
Architect of the Ministry of the Interior of the Czech
Republic (shortened as DECA). DECA is also
responsible for approving ICT projects in the public
sector of Czechia.
2.1.1 Context of EU
The European Union has presented its framework for
measuring the maturity of service interoperability
across the members of the European Union (EU &
Mannot, 2016). The NAF acknowledges this
framework. However, the scope of the
interoperability framework is narrow, and usage is
limited. Currently, NAF includes the Benchmark of
Public Administration. However, that is a change
made in the past year. Up to that point, the NAF
included only brief subjective self-assessments based
on eight capabilities for managing an organization's
enterprise architecture, and the rest referenced
TOGAF (DECA, 2021).
As the TOGAF to this day does not contain its
maturity model, the reference was and still is a proxy
for the maturity models of the third parties (The Open
Group, 2019, 2022).
Another approach to measuring maturity in the
context of the European Union is The Digital
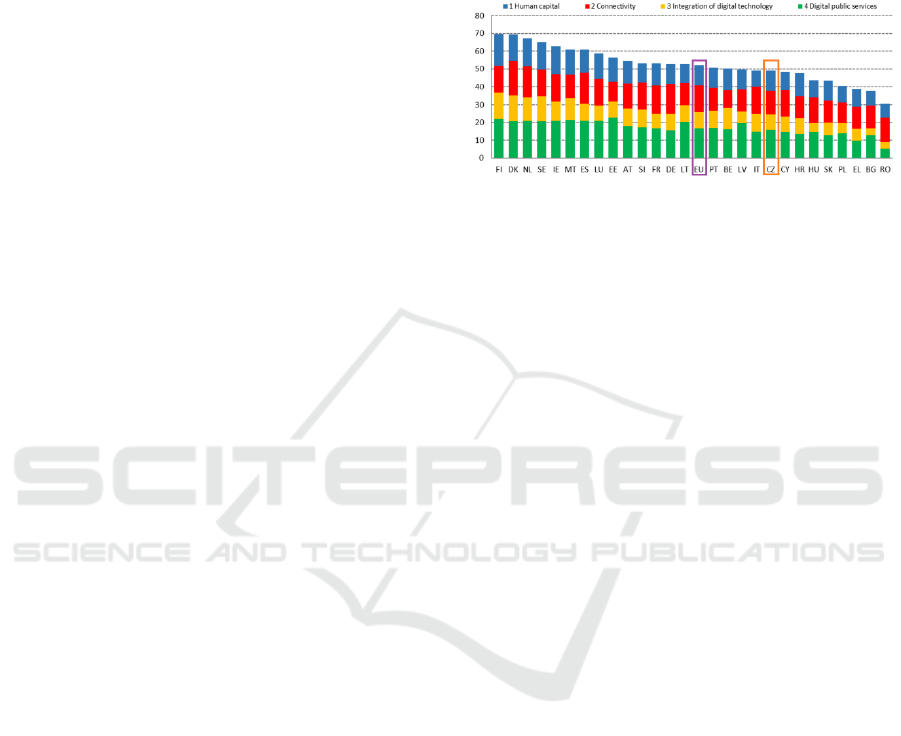
Economy and Society Index (DESI). DESI can be
used to ascertain Europe's overall digital performance
and the digital competitiveness of the corresponding
countries. DESI is a composite index of five
underlying categories (European Commission, 2022).
Looking at the relative position of countries,
Czechia is still underperforming and put behind the
average EU values. Moreover, Czechia is lacking in
digital public services.
Figure 1: DESI 2022 – and position of the Czechia
(European Commission, 2022).
2.2 Quantifying the Performance
The underlying problematization of given maturity
models lies in their explainability – with basic
questions such as: What is the cause? Why it works
that way? Conventional maturity models cannot
address and explain the reason for the differences.
Thus, typically respond to symptoms and show just
winners or losers of the given benchmark, where the
low-performing areas of the organization would be
targeted for improvement, but the real cause would
remain hidden.
From this position, the need for study and a
deeper analysis of the maturity model arises.
Explainability further raises the ambitions for internal
quantitative improvement based on additional
quantification and structuring of variables. This
approach is performed in the case study of the Czech
digital government (E-Government). This further
analysis was achieved via Bayesian networks,
theoretically described in the next chapter.
3 MATERIALS AND METHODS
This section introduces the primary data sources and
their processing methods. Firstly, the Benchmark of
the public administration of Czechia is described.
Then the approach of using Bayesian networks is
presented
3.1 Czech Benchmark of Public
Administration
The Benchmark of Public Administration, also known
as the ICT Benchmark of Public Administration, is
Improving Czech Digital Government Based on Quantified Maturity Model of Enterprise Architecture
601
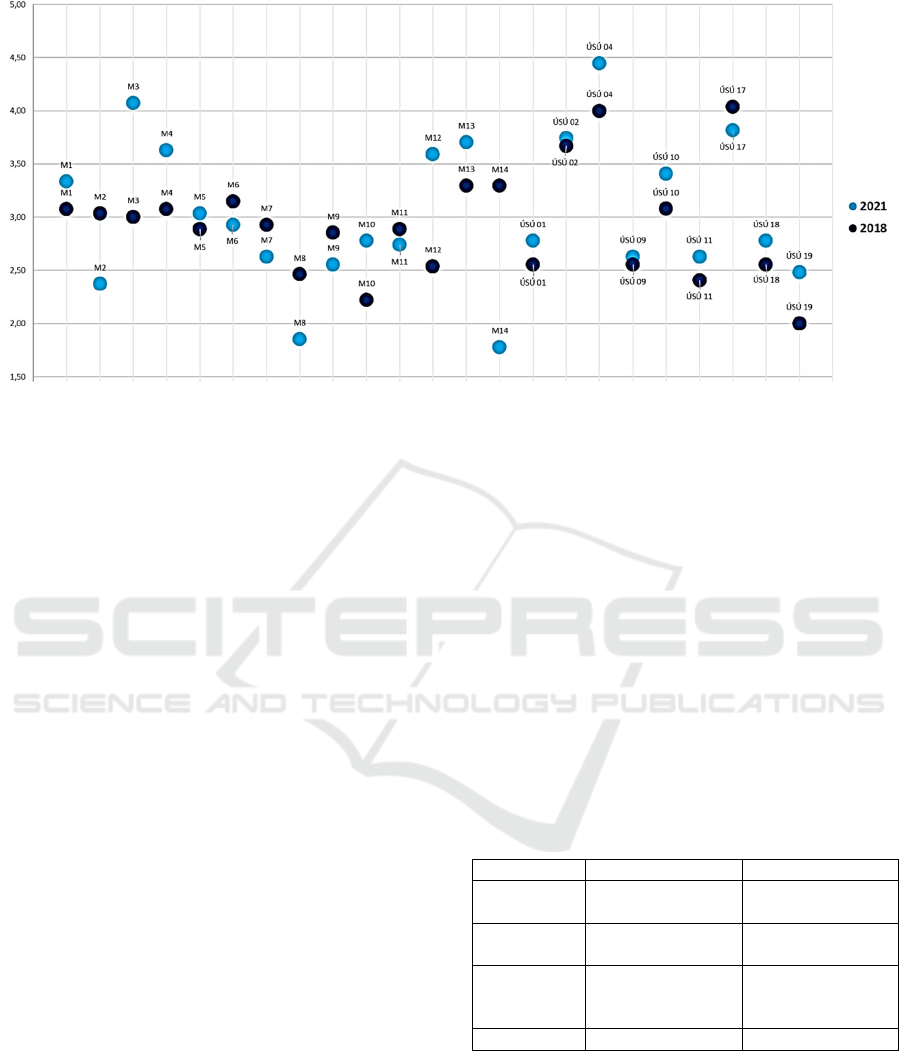
Figure 2: Overall Maturity Level Dynamics – Change from 2018 to 2021. M(x) is an anonymized ministry, ÚSÚ(x) stands
for anonymized central administrative authority. Maturity could range from 1 to 5.
conducted every three years and is based on the
Digital Czechia program (Dzurilla et al., 2018). In
this paper, the Benchmark of the Public The
administration will be called "Benchmark". The
Benchmark focuses on three main areas: a) Public
administration management, b) Finance and
personnel situation, c) Subjective evaluation of the
Czech public administration and E-Government.
Each of these areas is broken down in more detail
into individual questions. The first Benchmark took
place towards the end of 2018. The second
Benchmark took place towards the end of 2021.
In terms of a scientific viewpoint, this Benchmark
is a domain-specific maturity model tailored for the
public sector, particularly the corresponding
legislation. This domain-specific approach is
justified, as Ostadzadeh & Shams (2014) showed in a
specific information system case study. In the case of
the complexity of public administrations and their
systems, the complexity will be higher. Of course,
this domain specificity is redeemed by a reduction in
interoperability. Thus, the possibility of ad-hoc
comparison of the different systems. It is important to
note that multiple domain-specific maturity models
are created; however, only a fraction is validated and
used (Santos-Neto & Costa, 2019).
The motivation for applying robust inference
techniques is to gain insight into the structure of the
issues or the concepts behind them. This could be
used to overview where knowledge needs to be added
or used correctly. Thus, it is a step forward in creating
and maintaining a functional enterprise architecture
approach (Al-Kharusi et al., 2018), but also the
possibility to create target points/states and find
scenarios that best support or even enable them.
An extensive benchmark was carried out from the end
of 2018. This Benchmark included all 14 ministries
of the Czech Republic and 20 central administrative
authorities (CAA for short).
In 2021, a second iteration of the Benchmark took
place where we, as the authors, were part of the
Benchmark team. Again, all the ministries were
surveyed. The overview of the Benchmark 2018 and
Benchmark 2021 can be seen below. In this paper, we
further explore the first and three main areas of
benchmarking: Level of governance, Level of change
management, and ICT level of governance and
capabilities.
Table 1: Overview of the used Benchmark 2018 and
Benchmark 2021 datasets.
Benchmar
k
2018 2021
Number of
or
g
anizations
14 ministries, 20
CAA
14 ministries, 20
CAA
(
7 rotated
)
Timeframe June to August
2018
October to
November 2021
Data
collection
Semi-structured
panel interview with
the
q
uestionnaire
Semi-structured
p
anel interview with
the
q
uestionnaire
Variables 40
(
as factors
)
38
(
as factors
)
3.2 Methods and Bayesian Networks
Firstly, the questionnaire data were evaluated using
descriptive statistics, namely sample means and
frequencies. As all forms were completed and no
gross errors were found, all the data were deemed
valid and were further used in the creation of the
Bayesian network.
ICEIS 2023 - 25th International Conference on Enterprise Information Systems
602

Table 2: Mapping the code questions/variables of the Benchmark 2021 and harmonized Benchmark 2018.
Code Question/variables
x0 <Dumm
y
variable> - ministr
y
(
1
)
, central administrative authorit
y
(
0
)
x1.1 Relevance and
q
ualit
y
of the or
g
anization's strate
gy
(
existence and use of the Information Strate
gy)
x1.2.1 Up-to-date catalog of services and actions for citizens and companies (according to Law 12/2020 Coll.)
x1.2.2 Does a customer service manager exist to manage client services and service channels of the
ministr
y
/authorit
y
(
counters, e-filin
g
, data boxes, a
p
ortal of the ministr
y
/authorit
y)
across a
g
en
d
as?
x1.3 Your or
g
anization's mana
g
ement s
y
stem, hierarchical vs.
p
rocedural mana
g
ement
x1.4.1 Degree and method of digitalization of agendas
x1.4.2 Degree and method of digitalization of support/operational processes (budgeting, human resources...)
x1.4.3 Degree and method of digitalization of management processes (planning, concept management, quality…
x1.5.1 Level of
q
ualit
y
/excellence mana
g
ement and feedbac
k
x1.5.2 Level of risk mana
g
ement
x2.1.1 Do you have a Digital Champion? (This is not a formal position of the Digital ambassador)
x2.2 ICT's position and mandate in the organization's management syste
m
x2.3.1 How is Enterprise Architecture (EA) maintained and used as a management method in the organization to
su
pp
ort strate
g
ic
p
lannin
g
an
d
chan
g
e mana
g
ement?
x2.3.2 Does the organization have its own internal Enterprise Architect?
x2.3.3 Are the new systems, or changes to systems, always approved by the unit of the Enterprise Architecture?
x2.4.1 How is project and program management used to deliver successful organizational change?
x2.4.2 Does the or
g
anization have
p
ro
j
ect mana
g
ers?
x2.4.3 Is a
p
rocess for recordin
g
and
p
rioritizin
g
p
ro
j
ects across the or
g
anization defined and used?
x2.4.4 Is there a dedicated (planned) capacity of systematized posts (or part-time posts) within the organization to
im
p
lement chan
g
e
(
for inclusion in
p
ro
j
ects
)
?
x2.4.5 Is a process in place and routinely used to dedicate/release internal experts to projects and replace their
missing capacity in the line management of the organization's performance?
x3.1 Level of management of the information strateg
y
x3.2 Level of im
p
lementation of re
q
uirements mana
g
ement and its flow from the business to the ICT de
p
artments
x3.3 The current catalo
g
of internal IT services
x3.4 Service mana
g
ement in
p
lace
(
SLAs on all ke
y
s
y
stems, both to internal customers and external su
pp
liers
)
x3.5.1 How have you addressed the integration of security policies into IT processes and procedures for the design,
im
p
lementation, o
p
eration, and use of IT solutions
x3.5.2 Have
y
ou im
p
lemented and activel
y
used SIEM
(
Securit
y
Information and Event Mana
g
ement
)
?
x3.6.1 IT
q
ualit
y
s
y
stem in
g
eneral
x3.7.1 Do you measure the cost per en
d
-user transaction?
x3.7.2 Do you measure the successful and unsuccessful completion of transactions?
x3.7.3 Do
y
ou measure user satisfaction with the a
pp
lication/s
y
stem?
x3.7.4 Are
y
ou measurin
g
the usa
g
e of the di
g
ital channel versus the non-di
g
ital channel?
(
Where meanin
g
ful
)
x3.8 The abilit
y
of the IT de
p
artment to desi
g
n the s
y
stem, tender, and deliver on time with a
g
iven
q
ualit
y
x3.9 The ability of the Authority / IT Department to operate the systems and measure the quality of operation.
x3.10.1 Do you use the software provided as an external service (SaaS)?
x3.10.2 Do you use cloud solutions (running systems as a service, PaaS, IaaS)
x3.11.1 Do you have the source code for custom solutions and custom modifications to stand-alone software for all
critical IT solutions (primarily the legal category of public administration information systems)?
x3.11.2 Do you have development documentation (e.g., detailed data model) for all critical IT solutions?
x3.11.3 Do
y
ou have contractuall
y
secured licensin
g
ri
g
hts to maintain and develo
p
IT solutions?
x3.11.4 Have you secured in-house competence (capacity and knowledge) to maintain and develop the organizations'
key platforms and solutions (for each solution accounting for at least 10% of the organizations’ IT spend)?
In addition to descriptive statistics, which
typically speak about the state, distribution, and
frequencies of the concepts under study, we wanted
to move within the knowledge modeling to a state that
would allow us to grasp the internal dependencies and
predict the conditions of individual ministries and
authorities. For this purpose, the approach of
Bayesian statistics and its Application using Bayesian
networks based on artificial intelligence and machine
learning was used.
The Bayesian network is a multidimensional
method that, in addition to the objectives defined
above, is user-friendly as part of its result is a
visualized graph (Jensen, 2001; Koller & Friedman,
2009). This graph can be imagined as a map of the
relationships between sub-constructs (variable), such
Improving Czech Digital Government Based on Quantified Maturity Model of Enterprise Architecture
603
as how a digital service uses the computing power of
the underlying servers and how these services relate
to the existing catalog of IT services. Simply put, the
network helps us find links between issues that would
not otherwise be visible.
The resulting Bayesian network can thus be seen
as a model that allows:
- Define the internal structure of the data.
- Analyse the probability distribution of the data.
- Predict data states of interest based on known
other related information.
The Bayesian network was used for the
underlying structure of the research concepts as a
learning algorithm has used a variety of score-based
(Hill-climb, tabu search) and constrain-based (pc-
stable, grow-shrink) suitable algorithms implemented
in the bnlearn (Scutari, 2018). For ascertaining, the
statistical significance chi-square test was used, and
for measuring the strength of the relationship, the
criterium of Mutual Information was used. Both those
metrics were based on the α = 5%, with a 95%
confidence interval. The Bayesian information
criterion (BIC) was used for the overall model quality
evaluation (Jensen, 2001; Koller & Friedman, 2009).
The algorithms were realized based on the bnlearn
package for R Scutari (2010).
4 RESULTS AND DISCUSSION
The input to the model to obtain the Bayesian network
was 34 vectors, all with 39 variables per vector. There
were no missing values. Given this number of
ministries and agencies surveyed, score-based gradient
algorithms performed well, whereby the best model
was then selected based on BIC. Final Bayesian
networks are computed via the Hill-Climb algorithm.
All relationships in the models are statistically
significant, where the mutual information parameter,
as was already mentioned, was used to classify and
determine the strength of the arc. The direction of the
arcs is defined based on internal network consistency
criteria. It thus cannot be considered as the direction
of causality, although it may be consistent with it. The
final model based on data from Benchmark 2021
contains three mutually disjoint Bayesian networks,
two of which are trivial, containing a maximum of
three elements. The last network includes a structure
of 21 nodes and 20 arcs. Due to the limited data set,
the created model is a tree (graph theory). We refer to
this Bayesian network as the “main network”.
No significant statistical relationships were found
between the ten questions (variables), so they are not
part of any of the networks mentioned in the model.
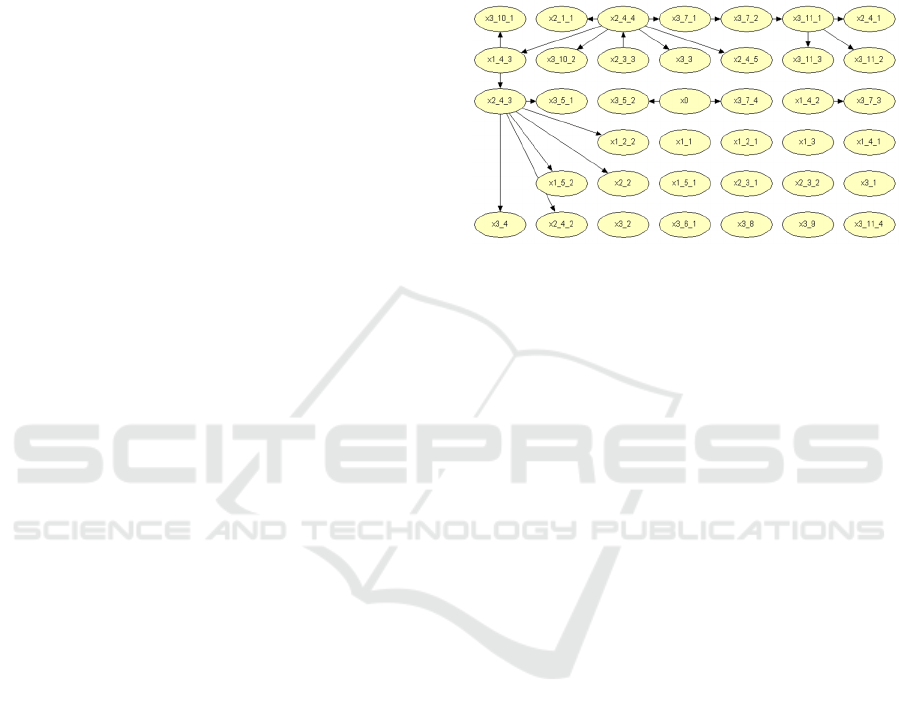
Let's analyze concrete questions such as question
x1.2.1 by looking at the answers, especially for the
ministries. We can see a possible pressure to answer,
corresponding to a clearly given legislative
obligation. This aspect of "not admitting weakness
and staying in the grey middle" needs to be
considered when assessing this Benchmark.
Figure 3: Model created from Benchmark 2021 data set.
A different perspective is offered when considering
question 2.3.1, “How is Enterprise Architecture (EA)
maintained and used as a management method…” as
this variable is independent and not connected to any
network.
This result indicates that the level of exercising
enterprise architecture does not bring a good effect,
as not even the dummy variable (x0) of the overall
maturity level is independent. This situation could be
explained as the enterprise architecture approach has
still failed to be adopted in today's public
administration of Czechia. The purpose of enterprise
architecture is the effective holistic management of an
organization.
Unfortunately, the current situation corresponds
to a situation where these thoughts are tightly linked
only to information systems. However, EA is not an
ICT discipline, although it is historically tied to it.
The situation where this approach is used from an ICT
direction is better than if it did not exist, but it is not
meant to be so. If this current ICT stigma were
removed and enterprise architecture departments had
access to ICT and non-ICT management and change,
the potential for effective functioning of single public
administration actors and their digital services would
be multiplied many times over.
4.1 Difference Between Ministries and
Central Administrative Authorities
Adding an auxiliary variable defining whether an
organization is a ministry or a CAA, we learn that
only two variables are affected by this division.
ICEIS 2023 - 25th International Conference on Enterprise Information Systems
604

The first of these behavioral differences is using
SIEM, one of the main tools for managing
cybersecurity and, thus, the reliable operation of
public administration. In terms of ministries, all but
one ministry used SIEM. The split in the central
administrative authorities is 60:40 in favor of using
SIEM. However, this situation cannot be considered
satisfactory; one of the priorities for the secure
functioning of the public administration would be to
roll out the already existing SIEM solutions to the
area of the UAS concerned and to introduce this
system unconditionally to the remaining ministries.
The second noticeable difference is the
representation of the measurement of the use of the
digital channel for services versus the non-digital
channel. Here, there are situations where the CCA
either excels (45%) or does virtually nothing (also
45%), with the remaining 10% (two CCA) of the
organizations surveyed falling somewhere in
between.
Looking at ministries, which are generally larger,
only one ministry indicates that it does so for all
meaningful activities. Most ministries (56%) need to
practice this measurement and evaluation. The
remainder, about a third of ministries, indicate that
measurement occurs when there is increased interest,
i.e., not routinely but systematically as needed.
However, measurement and evaluation are principles
of compiling and maintaining a catalog of digital
services, including planning new ones based on user
knowledge and thus facilitating the digitization of
such services.
4.2 The Second Bayesian Network
As another very trivial Bayesian network, the
relationship between the degree and manner of
digitalization of operational processes (question
1.4.2) and the measurement of user satisfaction with
the application/system is presented. In this condition,
a positive relationship is observed, where the
probability of measuring user satisfaction increases
with an increasing degree of digitalization of
operational processes.
The resulting model did not further connect this
network to other elements or directly to other
networks, but by looking deeper into the data
structure, a subjective connection, or hints of it, can
be found, at least with the other questions of the
service/transaction measurement capability topics
(3.7.1, 3.7.2). In the case of a more significant number
of data, this connection with other elements/networks
could be statistically confirmed based on the chosen
model criteria.
4.3 The Main Bayesian Network
The leading Bayesian network consists of 21
variables (maturity model questions). It can be
noticed that its visual structure corresponds to the
system of primary elements and the fans that branch
from them. Questions 2.4.4 examining how the
organization plans and allocates its internal capacities,
2.4.3 concerning the definition and prioritization of
projects, or 3.11.1 whether the organization has
solution source codes can be considered as the main
elements through which the remaining others are
linked.
Let us consider the last-mentioned element, i.e.,
the role of source codes in ICT solutions. The graph
shows that this element is statistically related to the
other four elements (questions 3.7.2, 2.4.1, 3.11.2,
3.11.3). If we mentally try to derive how the source
code solution will be related to the ownership of the
access documentation, it makes sense to have both
approaches at the same or similar level. It makes no
practical sense to have access to source code but no
longer to development documentation and vice versa.
Table 3: Conditional probability between the maturity of
questions 3.11.1 and 3.11.2.
3.11.1
maturity 1 3 5
3.11.2
1 0.75 0.07 0.00
3 0.25 0.87 0.40
5 0.00 0.07 0.60
A look at the probability ranking between the two
elements gives us the right idea. The most likely
situations are on the main diagonal (both maturities at
levels 1, 2, or 3). With that said, a relationship where
one maturity is at level 1 and the other at level 5 does
not occur.
The statement presented above could have been more
interesting. We had such an assumption beforehand,
so the result could be considered obvious. If we now
disregard the situation where this "obviousness" is
detrimental, we do get another, a more fundamental
piece of information. The model behaves as we
expect it to, i.e., the validity of the approach is
substantively demonstrated in this case. The
following sections will discuss only the conceptual,
possibly surprising implications.
Improving Czech Digital Government Based on Quantified Maturity Model of Enterprise Architecture
605
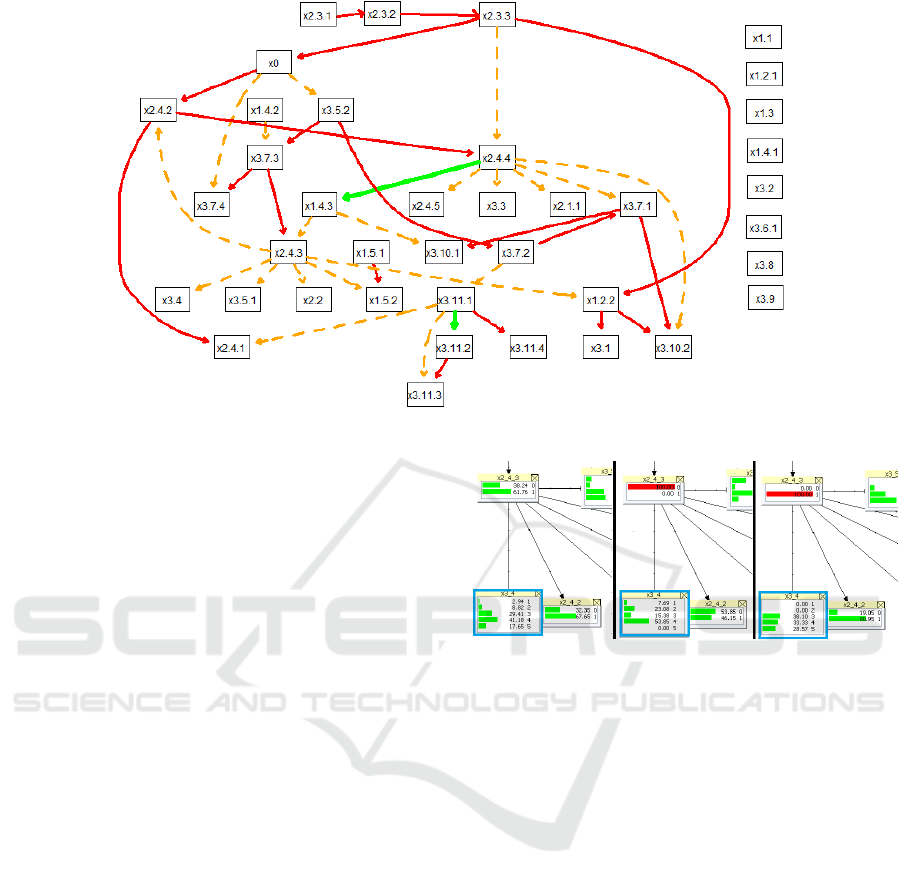
Figure 4: Bayesian Network Comparison Between Benchmark 2021 and Benchmark 2018.
4.3.1 Use of Software in the Form of SaaS
and Cloud Solutions
It is interesting that the two cloud questions (3.10.1,
3.10.2) are not together but are re-allocated to internal
management question 1.4.3 - The extent and manner
of digitalization of management processes..., and
question 2.4.4 - Is there a dedicated (planned)
capacity of systemized posts in the organization for
implementing change? Thus, under this assumption,
the way of using software such as SaaS and cloud
solutions are independent, given 1.4.3 or 2.2.4.
Those who can effectively plan and structure
internal capacity are able to use cloud solutions. The
reverse direction of the relationship is meaningless
here since the ability to delegate and compartmentalize
is independent of how the technology is implemented.
Conversely, of those who do not have this capability,
only one in two use cloud technologies. Thus, with the
progressive digitization of management pro-processes,
the ability to use the cloud can be influenced by
activating and enhancing the internal capacity planning
capabilities. A more in-depth analysis of the
management of the organizations in question would be
needed to determine what the specific steps should be.
However, in the first approach, the incremental
differences (deltas) between levels (maturity) can be
based on the answers obtained.
4.3.2 Prediction Capability
Suppose we are interested in how the level of the
service level management (3.4) is influenced by the
capability of the management of projects (2.4.3).
Figure 5: Main Bayesian Network – 2.4.3 Cut-Out.
As can be seen, there is a tight relationship. If the
capability is absent, the maturity level of 3.4 is more
spread and does not achieve the highest maturity. In
contrast, setting the evidence for 2.4.3 that the
organization's project management with prioritization
is exercised results in a higher chance for higher
maturity levels (Figure 5).
4.3.3 Comparison with the Benchmark 2018
For the comparison between 2021 and 2018, the
source data had to be harmonized first. Benchmark
2018 was harmonized to be comparable to
Benchmark 2021. The changes for Benchmark 2018
included removing or aggregating different questions.
By comparison, only two links have been
completely preserved (Figure 4, green relationships).
For the other nodes, there are changes (orange is
present in the Bayesian network from Benchmark
2021, and red arcs are present only in the Bayesian
network from Benchmark 2018). This difference can
be demonstrated by the already discussed usage of the
SIEM (question 3.5.2). Looking at the underlying
data of 2018, there was no difference between
ICEIS 2023 - 25th International Conference on Enterprise Information Systems
606

ministries and CAA. Ministries have acted, and
almost all of them have integrated the SIEM solution.
This overall significant difference between networks
calls for further exploration.
5 CONCLUSIONS
This paper addressed the quantification of
relationships within a standardized public
administration benchmark. Machine learning-based
Bayesian networks were used as a tool for this
quantification. Bayesian networks combine both
visual simplicity and explanatory and predictive
power. Also, the demonstrated approach is
generalizable.
By understanding the structure, strategic
decisions can be better directed, and processes of
digitalization and further development of the Czech
public administration can be made more efficient.
Further examination of the dataset and the
Bayesian network could bring more exciting findings
than those presented in this short paper. Also,
applying different approaches to aggregating the data
will enable different views on the matter. Moreover,
applying the leave-one-out cross-validation (Efron,
1982) for the presented model or constructing and
comparing more Bayesian network models could be
performed. A deeper evaluation of the differences and
their causes between Benchmark 2021 and
Benchmark 2018 could be another future topic.
Last but not least, insight could be gained with the
incorporation of the rest of the Benchmark available
data. The challenge would be making a hybrid
network with not just factor variables but also
numeric ones. As authors, we are excited about the
next Benchmark from the public administration of
Czechia and the possibility of further improving the
Czech Digital government.
ACKNOWLEDGEMENTS
This research was supported by the Internal Grant
Agency project of the Prague University of
Economics and Business IGS F6/61/2020. Also, it is
only proper to acknowledge the assistance of the
Department of the E-Government Chief Architect of
the Ministry of the Interior of the Czech Republic and
the partners from the program Digital Czechia and the
opportunity to use raw data from the Benchmark of
the Public Administration for the year 2018 and 2021.
REFERENCES
Al-Kharusi, H., Miskon, S., & Bahari, M. (2018). Enterprise
Architecture Development Approach in the Public
Sector: International Journal of Enterprise Information
Systems, 14(4), 124–141. https://doi.org/
10.4018/IJEIS.2018100109
Czechia. (2018) Usnesení Vlády České republiky č. 629 k
programu Digitální Česko a návrhu změn Statutu Rady
vlády pro informační společnost.
Czechia. (2018). Informační koncepce České republiky.
https://www.mvcr.cz/soubor/vladni-program-
digitalizace-ceske-republiky-2018-digitalni-cesko-
informacni-koncepce-cr.aspx.
Efron, B. (1982). The Jackknife, the Bootstrap and Other
Resampling Plans. Society for Industrial and Applied
Mathematics. https://doi.org/10.1137/1.9781611970319
EU, & Mannot, P. (2016, March 27). Interoperability
Maturity Model | Joinup. https://joinup.ec.europa.eu/
collection/semantic-interoperability-community-
semic/document/interoperability-maturity-model
European Commission. (2022, July 28). Digital Economy
and Society Index (DESI) 2022 | Shaping Europe’s
digital future. https://digital-strategy.ec.europa.eu/en/
library/digital-economy-and-society-index-desi-2022
Hrabě, P. (2013). Koncepce podnikové architektury pro
reformu veřejné správy ČR [Doctoral, VŠE].
https://vskp.vse.cz/47869_koncepce_podnikove_archite
ktury_pro_reformu_verejne_spravy_cr
Jensen, F. V. (2001). Bayesian networks and decision graphs.
Springer.
Koller, D., & Friedman, N. (2009). Probabilistic graphical
models: Principles and techniques. MIT Press.
DECA (2021). Národní architektonický rámec [Architektura
eGovernmentu ČR]. https://archi.gov.cz/ nar_dokument
Ostadzadeh, S., & Shams, F. (2014). Towards a Software
Architecture Maturity Model for Improving Ultra-Large-
Scale Systems Interoperability. ArXiv: 1401.5752 [Cs].
https://doi.org/10.7321/jscse.v3.n3.13
Santos-Neto, J. B. S. dos, & Costa, A. P. C. S. (2019).
Enterprise maturity models: A systematic literature
review. Enterprise Information Systems, 13(5), 719–769.
https://doi.org/10.1080/17517575.2019.1575986
Scutari, M. (2010). Learning Bayesian Networks with the
bnlearn R Package. Journal of Statistical Software, 35(3).
https://doi.org/10.18637/jss.v035.i03
Scutari, M. (2018, November 8). bnlearn—Man/bnlearn-
package.html. http://www.bnlearn.com/documenta
tion/man/bnlearn-package.html
Seppänen, V., Penttinen, K., & Pulkkinen, M. (2018). Key
Issues in Enterprise Architecture Adoption in the Public
Sector. Electronic Journal of E-Government, 16(1), 46–
58.
The Open Group. (2019). The TOGAF Standard, Version
9.2—Architecture Maturity Models. https://pubs.open
group.org/architecture/togaf9-doc/arch/chap45.html
The Open Group. (2022). TOGAF Series Guide: Maturity
Models. https://pubs.opengroup.org/togaf-standard/
architecture-maturity-models/
Improving Czech Digital Government Based on Quantified Maturity Model of Enterprise Architecture
607
