
Marginal Emission Factors in Power Systems: The Case of the
Netherlands
Parnian Alikhani
a
, Nico Brinkel
b
, Wouter Schram
c
, Ioannis Lampropoulos
d
and Wilfried van Sark
e
Copernicus Institute of Sustainable Development, Utrecht University, The Netherlands
Keywords:
Electricity System, Cross-Border Exchange, Decarbonization, Marginal Emission Factors, Merit Order.
Abstract:
The Marginal Emission Factor (MEF) is a consistent metric with increased accuracy, compared to the average
emission factor, to evaluate the avoided emissions as a result of changes in electricity consumption caused
by new technologies and policies. In this study, a method is developed to model MEFs by constructing
merit order profiles in interconnected power systems. The proposed method is applied in a case study of
the Netherlands for the years 2018 to 2022. This method, in contrast to previous studies that developed
marginal emission profiles, does not neglect the share of the electricity demand which is met by countries
in neighboring bidding zones. In this study, the results suggest that ignoring electricity trading significantly
underestimates the marginal emission factors. It is found that the key factors resulting in clear temporal shifts
in the marginal emission profiles are fuel and CO
2
prices. Even though the installed capacity of fossil-fueled
electricity generation has declined over time, these are mainly the power plants that operate at the margin
and often set electricity prices at the wholesale level. Overall, the MEF profiles obtained using the proposed
method could be readily employed in detailed evaluations of the emission optimization of distributed power
systems to support decarbonization.
1 INTRODUCTION
Given the adverse effects of anthropogenic climate
change, impact studies exploring strategies to achieve
maximum greenhouse gas (GHG) emission reduction
and power systems decarbonization are of great im-
portance. Developing techniques or metrics to ac-
curately assess the reduction of CO
2
is an important
step in properly assessing both supply strategies and
demand-side management measures (Lampropoulos
et al., 2013), (Brown and Chapman, 2021). Electric-
ity sector CO
2
emissions vary per location and over
time.
There are two approaches to assess the CO
2
emis-
sions of power systems based on the average emis-
sion factor (AEF), and the marginal emission factor
(MEF). Not only these emission factors make it possi-
ble to assess the CO
2
emissions associated with power
a
https://orcid.org/0000-0003-1678-1588
b
https://orcid.org/0000-0001-9973-2890
c
https://orcid.org/0000-0003-3407-7893
d
https://orcid.org/0000-0001-8566-4970
e
https://orcid.org/0000-0002-4738-1088
systems operations, but can also serve as a driving
force behind individuals’ and businesses’ electricity
consumption behavior.
The AEF is calculated by dividing total CO
2
emis-
sions from electricity generation by the total amount
of generation over a certain period of time (typically
one year) and represents a mixture of all generation
sources. In contrast, the MEF reflects the emission
intensity of the first power plant responding to an in-
tervention at a given time interval and represents the
emissions factor of the generator that is operating at
the margin. When using AEFs to assess the emission
impact of an intervention (e.g., a demand response ac-
tion), it is assumed that a change in electricity gener-
ation is evenly distributed over all generation facili-
ties. This is not in accordance with the operation of
electricity markets (Schram et al., 2019). Comparing
average and marginal emissions factors revealed that
AEFs largely fail to correctly estimate the avoided
emissions resulting from an intervention (Siler-Evans
et al., 2012). Generators do not ramp up produc-
tion equally, instead, the generator at margin responds
to a change in demand and the emissions of this
single generator should be attributed to this demand
50
Alikhani, P., Brinkel, N., Schram, W., Lampropoulos, I. and van Sark, W.
Marginal Emission Factors in Power Systems: The Case of the Netherlands.
DOI: 10.5220/0011855700003491
In Proceedings of the 12th International Conference on Smart Cities and Green ICT Systems (SMARTGREENS 2023), pages 50-57
ISBN: 978-989-758-651-4; ISSN: 2184-4968
Copyright
c
2023 by SCITEPRESS – Science and Technology Publications, Lda. Under CC license (CC BY-NC-ND 4.0)

change (Woody et al., 2022).
Variation in MEFs by the hour of the day is impor-
tant for the evaluation of technologies and policies de-
signed to incentivize an increase or decrease in elec-
tricity consumption at specific times of the day. An-
other essential use of hourly MEFs is to accurately es-
timate the decrease in emissions associated with non-
dispatchable renewable generation, which typically is
equivalent to the effect of a reduction in load (Holland
et al., 2022).
Several studies have been conducted in recent
years to develop methods to calculate MEFs and out-
line the importance of the topic. Hawkes (Hawkes,
2010) developed a regression-based approach to con-
struct MEF profiles for the UK by evaluation of power
system historical data. This methodology has been
applied in subsequent studies as well (Holland et al.,
2015), (Thomson et al., 2017). This method might
not be feasible if significant changes in the power
system occur. The most accurate approach is based
on electricity market models by taking into account
power plant dispatch. In such models, changes in the
power systems could be taken into account. Genera-
tors at the margin are not usually published. Schram
(Schram et al., 2019) proposed a method to estimate
the marginal power plant based on the Day-Ahead
Market (DAM) price and the marginal costs of a
power plant.
There are several studies using MEFs to estimate
emissions-saving in demand-side management. In
Ontario, passenger Electric Vehicle (EV) charging
profiles optimization to minimize MEF led to 50%
lower EV emissions (Tu et al., 2020). Similar re-
sults were obtained applying regional-specific MEFs
where optimized charging of EVs reduced emis-
sions by as much as 31% for standard use and 59%
for vehicle-to-grid (V2G) use (Hoehne and Chester,
2016). In addition, the trade-off between electric-
ity cost and MEFs using multi-objective optimization
and optimal solutions using Pareto frontiers for EV-
controlled charging was investigated in (Brinkel et al.,
2020).
While several studies have investigated AEF and
MEF, there is no prior study, to the best of our knowl-
edge, that considers electricity produced by genera-
tors in neighboring countries/states and cross-border
trade as a result of electricity market coupling. Em-
ploying an electricity-interconnected market is re-
ferred to as market coupling which aims to harmo-
nize various systems of electricity exchanges and, in
particular, to reduce price differences by linking con-
trol areas and market areas. Integration of the Euro-
pean electricity markets is an approach to contribute
to the decarbonization of the European energy sys-
tem and increasing the security of supply. In the
early 2000s, some Central Western Europe (CWE)
countries started to move towards market coupling
in agreements with several regional initiatives (Ten-
neT, 2021b). The convergence in market prices across
CWE countries is one of the main targets of market
integration. Therefore, transmission capacities allo-
cated to cross-border trading and the level of price
convergence have increased over time. Full price
convergence within CWE reached 48% of the hours
in 2021 (TenneT, 2021a). Higher price convergence
contributes to better European market integration, and
market coupling has created efficient trading at the
day-ahead stage (Gissey et al., 2019).
A large and highly interconnected grid has many
economic and operational constraints, which make
challenging the identification of marginal generation
units (Siler-Evans et al., 2012). Due to the increased
market coupling, the generator at the margin that re-
sponds to a change in demand might be not located in
the studied country, but in one of the surrounding bid-
ding zones. This can considerably affect the marginal
emission factor profiles for electricity, in particular
when the variation in the electricity generation capac-
ity mix between bidding zones is significant. The con-
cept of market coupling has not been integrated into
the methods proposed in previous studies to generate
marginal emission profiles.
In this study, we develop a method to model MEFs
for national power systems by constructing merit or-
der profiles of all generation facilities while taking
cross-border trade into account. Next, the approach
is applied to the case of the Netherlands to derive
MEFs from 2018 to 2022. This method takes into
account the electricity imported by considering the
power plants in CWE countries with a high amount
of hours of DAM price convergence with the Nether-
lands. The proposed approach is also compared with
the results of a scenario in which electricity trading is
neglected.
In Section 2, the methodology is presented. The
case study and datasets are discussed in Section 3. In
section 4, the results of the proposed method for a
given case study are presented. Section 5 contains the
key conclusions.
2 METHOD
The construction of the MEF profiles is based on the
countries’ generation facilities and historical data and
is developed using the approach proposed by (Schram
et al., 2019). This method calculates the marginal
costs of each power plant in one country, and marginal
Marginal Emission Factors in Power Systems: The Case of the Netherlands
51

costs are linked with the DAM price to find which
generator is at the margin. However, this method
neglects that a high level of price convergence has
been observed in recent years within the CWE re-
gion (ENTSO-E, 2021).
Full price convergence refers to exact same price
between two neighboring bidding zones. The mar-
ket coupling could cause the marginal generator to be
located in another bidding zone. Price convergence
between bidding zones indicates that the DAM clear-
ing was not restricted by transmission constraints be-
tween bidding zones, causing the same merit order
to be applied to both countries. Hence, a moment
of price convergence between two or more bidding
zones indicates that the same generator is at the mar-
gin in these bidding zones. In this study, it is assumed
to have electricity exchange within CWE countries at
times with full price convergence.
After collecting and pre-processing the data sets
which are explained in section 3, the merit order con-
struction is the first step in modeling the MEFs pro-
file. This is the electricity generation mix ranked
based on ascending order of marginal operation costs
(MC). MC (in
C/MWh) of facility i is the sum of
three components, namely the fuel costs, the emis-
sion costs, and the variable operating costs (Biggar
and Hesamzadeh, 2014), and thus could be obtained
as follows (Schram et al., 2019):
MC
i
=
FP
i
η
i
+
EF
i
η
i
×C P + V OC
i
(1)
where FP is the price of fuel (in C/MWh
t
), η is
the conversion efficiency, EF is the emission factor
of the fuel (in tCO
2
/MWh
t
), CP is the EU Emission
Trading System (ETS) CO
2
price (in C/tCO
2
), and
VOC is the Variable Operational Costs (in C/MWh).
The marginal emissions (ME) (in tCO
2
/MWh) of
facility i which is determined to be at margin are ob-
tained as follows (Schram et al., 2019):
ME
i
=
EF
i
η
i
(2)
For constructing the MEF profile, first, the facility
at the margin is determined by the clearing prices of
the DAM. Then, the MEF profile can be created us-
ing the marginal facility’s emissions. To identify the
marginal power plant, the following assumptions re-
lated to the marginal facilities are made:
• To determine the marginal operating facility, the
power plant with marginal costs closest to the spot
price is assumed to be the marginal operating fa-
cility.
• When the investigated country’s DAM price is
equal to the DAM price of other bidding zones,
we take into account all power plants generating at
the investigated country and other bidding zones
with the exact same DAM price. It is assumed
that there is electricity exchange within the CWE
region at times when the price fully converges.
• When the investigated country’s DAM price is not
equal to any other bidding zones’ DAM prices, we
take only the investigated country’s power plants
into account.
• When the investigated country DAM price is neg-
ative, we assume that renewable resources are at
the margin.
• When the investigated country’s DAM price is
lower than one-third of the lowest MC of con-
sidered power plants, we assume that renewable
resources are at the margin as well. It is assumed
that electricity with lower prices is generated from
renewable sources.
In addition, several other assumptions have been
made to construct the merit order and MEF profiles
which are as follows:
• Hard coal, Natural Gas (NG), Lignite, Nuclear,
and Renewable Energy Sources (RES) are iden-
tified as the marginal energy supply sources based
on their generation capacity in the countries.
• All power plants are assumed to operate at their
maximum efficiency; efficiency losses of operat-
ing at partial load are not considered.
• Coal and natural gas plants with a capacity under
100 MW are excluded from the list due to their
low efficiencies.
• No assumptions about future scenarios are made.
• It is assumed that market participants bid based on
the marginal costs of their power plants.
• Bid strategies of retailers were not considered.
3 CASE STUDY SPECIFICATIONS
AND DATA COLLECTION
The methodology is applied to the Dutch power sys-
tem for the years 2018 to 2022. The countries in CWE
with a high number of hours with full price conver-
gence with the Netherlands are Germany, Belgium,
France, Austria, and Denmark. Table. 1 indicates
the price convergence time percentages that occurred
every year with the above-mentioned countries. In re-
cent years, prices have converged considerably. How-
ever, in 2022, the Russo-Ukrainian War significantly
affected the energy markets, resulting in a decrease in
electricity price convergence.
SMARTGREENS 2023 - 12th International Conference on Smart Cities and Green ICT Systems
52

Table 1: Countries in CWE that have the highest amount of hours with full price convergence in 2018-2022.
Year Germany Belgium France Austria Denmark
2018 36.09% 40.48% 37.07% 33.95% 19.05%
2019 49.28% 46.77% 42.65% 44.55% 37.36%
2020 48.95% 49.75% 44.67% 44.25% 38.64%
2021 53.73% 51.70% 48.64% 48.49% 51.10%
2022 38.89% 36.14% 33.49% 33.60% 38.12%
To construct the MEF profiles, several datasets
are required as input. First, the characteristics
of all generation facilities, namely each unit’s in-
stalled capacity, efficiency, and generation types,
which are obtained using the JRC open power plants
database (JRC, 2019). CO
2
prices in addition to fuel
prices for coal, NG, and uranium are collected from
Investing (Investing, 2022). Lignite price is collected
from Federal Statistical Office of Germany (German
Federal Statistical Office, 2022). VOC is assumed to
be 2.56 C/MWh for NG-fired facilities, 3 C/MWh for
coal-fired power plants, and 6.4 C/MWh for nuclear
power plants (De Vita et al., 2018). The emission
factor of bituminous coal, natural gas, lignite, ura-
nium, and RES are determined as 0.341, 0.202, 0.364,
0.031, and 0.015 tCO
2
/MWh
t
, respectively (Koffi
et al., 2017).
4 RESULTS AND DISCUSSION
4.1 Marginal Emissions Factors of the
Case Study
In Fig. 1 the MEF profiles by the hour of the day and
day of the year, from 2018 to 2022, are illustrated.
The heatmap shows a clear change in the MEF pro-
files over the years. In 2018, during the peak hours
(i.e., 8:00-10:00 and 17:00-19:00), MEFs are rela-
tively low which coincides with high DAM prices,
and MEFs increase outside the peak times. In 2019
and 2020, this trend is reversed, and higher MEFs
are obtained during the morning and afternoon hours
when demand is ramping up, and lower MEFs are ac-
quired in the late evening when the demand decreases.
There are several shifts in trends in 2021 and 2022,
which make the trends seem inconsistent throughout
the year.
The main reasons behind these shifts are the
change in NG and CO
2
prices. As shown in Fig. 2,
marginal costs of NG power plants are higher than
other facilities in 2018 which makes NG frequently
the marginal fuel source. NG prices decreased in
2019 and 2020, explaining the shift in the daily MEF
pattern from 2018 to 2019, when peak hours with
higher prices coincided with higher emission factors
from coal or lignite generators. Later at the end of
2021, a significant rise in NG price as well as the in-
crease in CO
2
price lead to NG power plants being
at the margin during high-demand hours when DAM
price is high. Moreover, the increase in CO
2
price re-
sults in the marginal cost of coal-fired power plants
increasing more than NG plants due to their higher
emission factor.
The MEF profiles of a randomly chosen day e.g.
16 September in both 2018 and 2020 are illustrated in
Fig. 3 to visualize how the MEF pattern changes over
time. In 2018, the MEF profile mostly behaves the op-
posite of the DAM price trend, however, it almost fol-
lows the DAM price behavior in 2020. This demon-
strates that scheduling demand to minimize cost is not
always the best strategy from an environmental point
of view since it could increase the amount of CO
2
pro-
duced by power plants. Fig. 4 shows the daily aver-
age and 7-day rolling average MEFs. As a result of
changes in marginal fuel, MEFs show a trend to de-
cline from 2019 through 2021 and significant rises in
the second half of 2021 and 2022.
Fig. 5 shows how marginal generation sources
have shifted over the last four years. The fraction of
time that different units are at the margin is identified
for each year. The share of NG as the marginal gener-
ator has increased since 2018. This development has
largely been due to NG’s declining price worldwide
in recent years until 2021 along with CO
2
’s sharp
rise in price, resulting in NG replacing coal. It is
shown that the coal power plants started responding
more again to marginal changes in 2021. The price
of coal was significantly low compared to that of NG
after the pandemic in 2021. As a result, NG facilities,
which emit less CO
2
per generated unit of electric-
ity, have been at the margin less in 2021 and 2022
than years earlier. Nuclear, Lignite, and RES genera-
tors are rarely at the margin due to their low marginal
costs and insufficient installed capacity to satisfy the
entire demand.
In addition, a considerable increase in RES gen-
eration and a reduction in load demand in 2019 and
later in 2020 due to the global pandemic lead to a de-
crease in DAM prices which are driven by supply and
demand. DAM price changes as well as a decrease
Marginal Emission Factors in Power Systems: The Case of the Netherlands
53

Figure 1: Hourly marginal emission profile for the Netherlands from 2018 to 2022.
Figure 2: The marginal cost of each type of power plant per half a year. It includes fuel, CO
2
, and variable operational costs
taking into account the average efficiency of each type of power plant.
in NG prices made coal-burning power plants, as the
biggest emitters, be at the margin less than before and
result in less CO
2
emissions.
Even with a 20.85 percentage point (p.p.) increase
in renewable energy generation from 2018 to 2021,
fossil-fueled generation units remained the main
power plants at the margin, whilst producing only
63% of the Netherlands’ electricity in 2021 (CBS,
2022). There were 99.44% of times when fossil fu-
els were marginal in 2018. Despite renewable energy
reducing this share to 96.24% in 2021, the marginal
power plant still relies heavily on fossil fuels. Addi-
tionally, there is a 13.06 p.p. increase in the marginal
generator’s dependency on imports from neighbor-
ing bidding zones in 2021 versus 2018, demonstrat-
ing the improvement in European electricity market
SMARTGREENS 2023 - 12th International Conference on Smart Cities and Green ICT Systems
54

Figure 3: Day-ahead price versus marginal emission factor
for 16 September 2018 and 2020.
Figure 4: Daily average and 7-day rolling average marginal
emission factors over the studied years.
coupling. The Dutch electricity grid appears to be
largely balanced by interconnections with Germany.
The Russo-Ukrainian War negatively affected the en-
ergy market in 2022, resulting in a decrease in the
level of price convergence.
4.2 Performance Evaluation of the
Proposed Method
Fig. 6 shows the range of emission factors for power
plants in the Netherlands and other bidding zones that
take efficiencies into account. Power generated from
lignite and nuclear, along with numerous hard coal
and natural gas power plants with different efficien-
cies located in neighboring countries, would be elim-
inated in case of neglecting power exchange impact.
Figure 5: Percentage of hours for each type of fuel being at
the margin per year.
Figure 6: An overview of the emission factors of power
plants in the Netherlands and other bidding zones.
As a result, marginal generator emissions in the other
bidding zones are not taken into account when calcu-
lating MEFs.
MEF profiles without taking into account electric-
ity exchange with other bidding zones are also con-
structed for comparison of the results of this study.
Fig. 7 illustrates the mismatch between MEFs that are
constructed using the proposed approach and those
that neglect trading in 2018. Observations indicate
that MEFs are underestimated when power exchanges
are neglected, and the proposed approach improves
the accuracy of emission factors for the power sector.
If the model neglects electricity trade among neigh-
boring bidding zones, then only power plants in the
Netherlands are taken into account. This ignores the
emission factors of power plants that do not exist in
the country, i.e., lignite and nuclear. Hence, ignoring
the electricity exchange leads to underestimating the
emission factors by not accounting for electricity gen-
erated from other units, especially units with higher
emissions, such as coal and lignite installed in other
bidding zones.
Marginal Emission Factors in Power Systems: The Case of the Netherlands
55
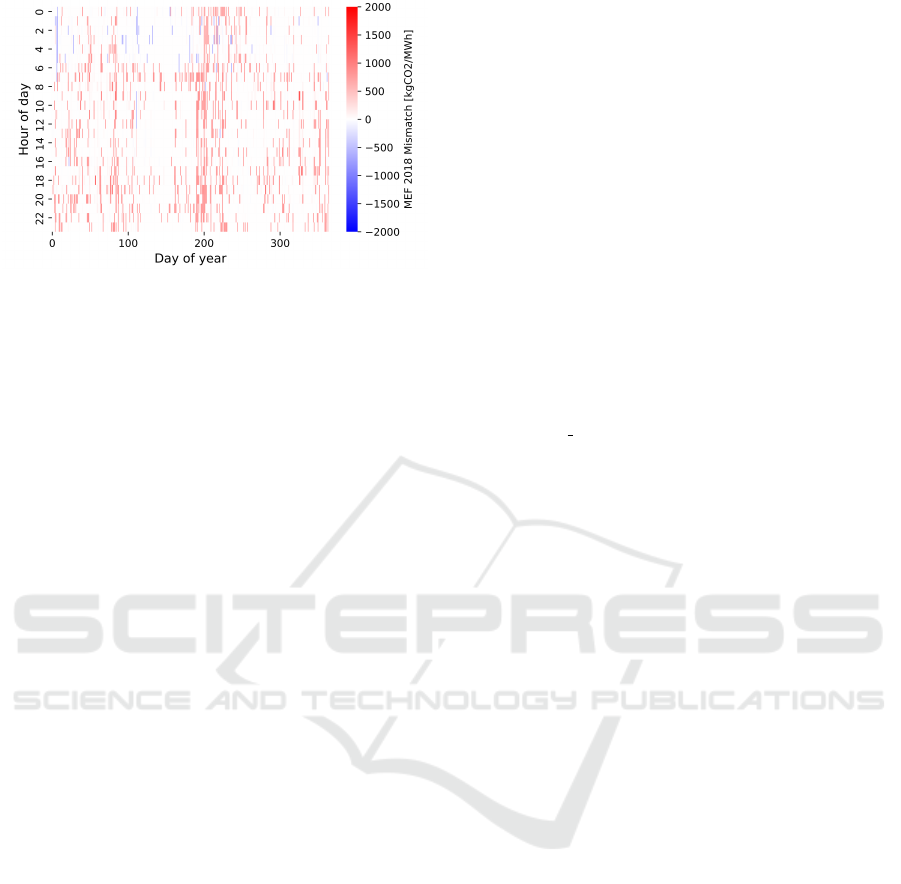
Figure 7: Marginal emission factors differences between
scenarios considering versus ignoring electricity imports.
5 CONCLUSIONS
In this paper, we provide an approach for the deter-
mination of MEF profiles from the electricity sector
and applied the method to the case of the Nether-
lands from 2018 to 2022 via generation facilities merit
order construction. The impact of electricity trade
with other bidding zones is taken into account, lead-
ing to higher accuracy compared to ignoring elec-
tricity trade, which results in underestimating emis-
sion factors. Although the share of electricity gen-
erated from renewable sources has increased substan-
tially over the past few years, electricity prices are still
largely determined by carbon-intensive power plants
at the margin. Variations in MEF profiles and shifts
in marginal power plants are primarily caused by fuel
and CO
2
prices. It is expected that future develop-
ments will increase the share of renewables and in-
crease the variability of marginal generation as a re-
sult. Although the current share of renewable energy
in the electricity mix account for only a small share of
the marginal mix, this is expected to change in the fu-
ture. The consequences of these changes for a future
scenario could be investigated in future work.
In conclusion, the proposed MEF construction ap-
proach is well suited to be used in the emissions opti-
mization of distributed power systems to promote de-
carbonization e.g., scheduling of electricity demand
and evaluating load shifting potentials.
ACKNOWLEDGEMENTS
This study is supported by the Dutch Ministry of
Economic Affairs and Climate Policy and the Dutch
Ministry of the Interior and Kingdom Relations
through the ROBUST project under grant agreement
MOOI32014. This study is also supported by the
Horizon 2020 program and the ARV project under
grant agreement 101036723.
REFERENCES
Biggar, D. R. and Hesamzadeh, M. R. (2014). The eco-
nomics of electricity markets. Wiley Blackwell.
Brinkel, N., Schram, W., AlSkaif, T., Lampropoulos, I.,
and Van Sark, W. (2020). Should we reinforce the
grid? cost and emission optimization of electric ve-
hicle charging under different transformer limits. Ap-
plied Energy, 276:115285.
Brown, M. A. and Chapman, O. (2021). The size, causes,
and equity implications of the demand-response gap.
Energy Policy, 158:112533.
CBS (2022). More electricity from renewable sources,
less from fossil sources. https://www.cbs.nl/en-
gb/news/2022/10/more-electricity-from-renewable-
sources less-from-fossil-sources, Accessed: Decem-
ber 9, 2022.
De Vita, A., Kielichowska, I., Mandatowa, P., Capros,
P., Dimopoulou, E., Evangelopoulou, S., Fotiou, T.,
Kannavou, M., Siskos, P., Zazias, G., et al. (2018).
Technology pathways in decarbonisation scenarios.
Tractebel, Ecofys, E3-Modelling: Brussels, Belgium.
ENTSO-E (2021). Transparency platform; day-ahead
prices. https://transparency.entsoe.eu/transmission-
domain/r2/dayAheadPrices/show, Accessed: January
13, 2023.
German Federal Statistical Office (2022). Preise -
erdgas- und stromdurchschnittspreise. https://www.
destatis.de/, Accessed: January 9, 2023.
Gissey, G. C., Guo, B., Newbery, D., Lipman, G., Mon-
toya, L., Dodds, P., Grubb, M., and Ekins, P. (2019).
The value of international electricity trading. A project
commissioned by Ofgem.
Hawkes, A. (2010). Estimating marginal co2 emissions
rates for national electricity systems. Energy Policy,
38(10):5977–5987.
Hoehne, C. G. and Chester, M. V. (2016). Optimizing plug-
in electric vehicle and vehicle-to-grid charge schedul-
ing to minimize carbon emissions. Energy, 115:646–
657.
Holland, S. P., Kotchen, M. J., Mansur, E. T., and Yates,
A. J. (2022). Why marginal co2 emissions are not
decreasing for us electricity: Estimates and implica-
tions for climate policy. Proceedings of the National
Academy of Sciences, 119(8):e2116632119.
Holland, S. P., Muller, N. Z., Mansur, E. T., and Yates, A. J.
(2015). Environmental benefits from driving electric
vehicles? National Bureau of Economic Research:
Cambridge MA.
Investing (2022). Stock market quotes and financial news.
https://www.investing.com/, Accessed: October 5,
2022.
JRC (2019). European commission open power plants
database(jrc-ppdb-open). http://data.europa.eu/89h/
SMARTGREENS 2023 - 12th International Conference on Smart Cities and Green ICT Systems
56

9810feeb-f062-49cd-8e76-8d8cfd488a, Accessed:
October 5, 2022.
Koffi, B., Cerutti, A., Duerr, M., Iancu, A., Kona, A., and
anssens Maenhout, G. (2017). Com default emission
factors for the member states of the european union -
version 2017. https://data.jrc.ec.europa.eu/dataset/jrc-
com-ef-comw-ef-2017, Accessed: October 5, 2022.
Lampropoulos, I., Kling, W., Ribeiro, P., and van den Berg,
J. (2013). History of demand side management and
classification of demand response control schemes,
ieee power & energy society general meeting. Van-
couver BC.
Schram, W., Lampropoulos, I., AlSkaif, T., and Van Sark,
W. (2019). On the use of average versus
marginal emission factors. In SMARTGREENS 2019-
Proceedings of the 8th International Conference on
Smart Cities and Green ICT Systems, pages 187–193.
SciTePress.
Siler-Evans, K., Azevedo, I. L., and Morgan, M. G. (2012).
Marginal emissions factors for the us electricity sys-
tem. Environmental science & technology, 46:4742–
4748.
TenneT (2021a). Annual market update 2021, elec-
tricity market insights. https://www.tennet.eu/
company/publications/technical-publications/, Ac-
cessed: August 16, 2022.
TenneT (2021b). Market news. https://www.tennet.eu/
market-newsw, Accessed: October 2, 2022.
Thomson, R. C., Harrison, G. P., and Chick, J. P. (2017).
Marginal greenhouse gas emissions displacement of
wind power in great britain. Energy Policy, 101:201–
210.
Tu, R., Gai, Y. J., Farooq, B., Posen, D., and Hatzopoulou,
M. (2020). Electric vehicle charging optimization
to minimize marginal greenhouse gas emissions from
power generation. Applied Energy, 277:115517.
Woody, M., Craig, M. T., Vaishnav, P. T., Lewis, G. M.,
and Keoleian, G. A. (2022). Optimizing future cost
and emissions of electric delivery vehicles. Journal of
Industrial Ecology.
Marginal Emission Factors in Power Systems: The Case of the Netherlands
57
