
An Unsupervised Approach for Study of the Relationship Between
Behavioral Profile and Facial Expressions in Video Interviews
Ana Carolina Conceic¸
˜
ao de Jesus
1
, Richard Vin
´
ıcius Rezende Mariano
1
, Alessandro Garcia Vieira
2
,
J
´
essica da Assunc¸
˜
ao Almeida de Lima
2
, Giulia Zanon de Castro
2
and Wladmir Cardoso Brand
˜
ao
1,2
1
IRIS Research Laboratory, Department of Computer Science,
Pontifical Catholic University of Minas Gerais (PUC Minas), Brazil
2
Data Science Laboratory (SOLAB), S
´
olides S.A. – Belo Horizonte, MG, Brazil
Keywords:
Facial Action Units, Behavioral Profile, Unsupervised Machine Learning, Human Resources.
Abstract:
The use of Behavior Mapping (BM) questionnaires to analyze the Behavioral Profile (BP) of employees can
lead to biased responses, incompleteness, and inaccuracies, especially when information such as reactions,
facial expressions, and body language cannot be captured. Thus, methods with the ability to recognize and
characterize BP automatically and without direct inference of bias can minimize the impact of erroneous
assessments. Intensity clustering of Facial Action Units (AUs) from the Facial Action Coding System (FACS),
extracted from video interviews of PACE BPs, was proposed. Features were extracted from 500 videos and
effort was targeted to profiles whose probability was equal to or greater than 40% of the individual belonging
to the profile. An analysis of the relationship between BPs and intensities throughout the video was presented,
which can be used to support the expert’s decision in the BM.
1 INTRODUCTION
Organizations are complex environments that require
tactical development, meeting deadlines and making
profits. In particular, managers and Human Resources
(HR) professionals are interested in using data vi-
sualization and predictive analysis to make faster
and more efficient decisions about employee perfor-
mance, and profiles (Tursunbayeva et al., 2018). In
this effort, Behavioral Profile Mapping (BPM) can be
used to identify and understand the employee’s be-
havioral profile within the organization. By mapping
the behavior of employees, both during the hiring
process and throughout the employee journey, BPM
helps identify strengths and weaknesses and ensures
that the right people are placed in the right roles.
Two strong BPM models, BigFive and DISC,
stand out and are widely used in the literature (Ng,
2016; Grosbois et al., 2020; Koh
´
ut et al., 2021;
Rengifo and Laham, 2022; Denissen et al., 2022). In
these studies, the primary approach of HR profession-
als in BPM is highly dependent on the individual an-
alyzed. The process consists of capturing information
through reports, questionnaires, and tests developed
by experts in the field, as shown in Figure 1.
This approach is prone to the cognitive biases of
those involved in the process, which can cause differ-
ences in the understanding and interpretation of the
answers, for example, by lack of sincerity or lack of
self-knowledge of the employee when answering the
questionnaire. These can cause inaccuracies and in-
completeness in the BPM experts’ assessment of the
individuals studied. Several studies attempt to capture
information less dependent on individuals’ cognitive
bias (Jerritta et al., 2011; Chernorizov et al., 2016; Al-
Nafjan et al., 2017). Research on facial expressions,
reactions, and body language, can be important clues
about an individual’s behavior profile (BP).
3. receive
Technical and Psychological Tests
1. create
2. realize
4. analize
Employees
Profiles
Expert
Analytical results
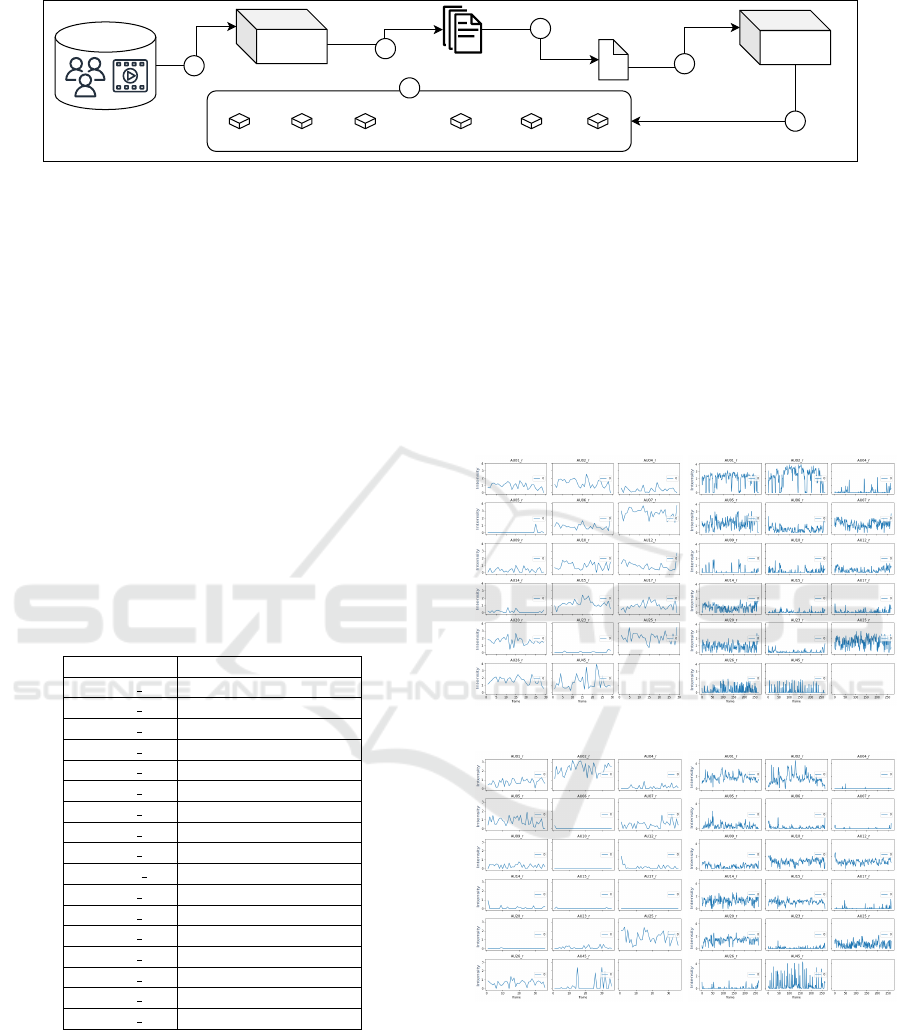
Figure 1: MPB process. The expert prepares questionnaires
based on BP models, characteristics required of the candi-
date to fill the vacancy, and expertise. Candidates are sub-
mitted to the questionnaires and later this same specialist
or others evaluate the answers analytically, outlining the BP
and skills of the individuals.
The premise is that distinct individuals with the
same BP carry similar behaviors and characteristics.
Although BP depends on internal and external factors,
it is changeable due to the complex nature of human
beings. This means that BP can change as a func-
tion of the individual’s experiences. The BP is con-
Conceição de Jesus, A., Mariano, R., Vieira, A., Almeida de Lima, J., Zanon de Castro, G. and Brandão, W.
An Unsupervised Approach for Study of the Relationship Between Behavioral Profile and Facial Expressions in Video Interviews.
DOI: 10.5220/0011856100003467
In Proceedings of the 25th International Conference on Enterprise Information Systems (ICEIS 2023) - Volume 1, pages 493-500
ISBN: 978-989-758-648-4; ISSN: 2184-4992
Copyright
c
2023 by SCITEPRESS – Science and Technology Publications, Lda. Under CC license (CC BY-NC-ND 4.0)
493

sidered to be a state composed of several other stable
states that repeatedly appear over time. A profile does
not change suddenly and tends to stabilize by showing
some statistically significant distribution.
Other types of data can be used to trace the BP of
individuals during recruitment and selection of peo-
ple. Multimedia data includes video interviews, writ-
ten text from candidates, and information from re-
sumes and previous jobs. Another important detail is
that this type of data tends to be little exploited due to
the complexity of manipulation, processing, and stor-
age (Silberschatz et al., 1996; Kumari et al., 2018).
From a candidate’s video interview, it is possible
to capture important information such as facial ex-
pressions, reactions, and body language. This work
focuses on associating the intensity of facial muscle
movements throughout a video with the BP of indi-
viduals. The facial muscle movements are defined
through facial Action Units (AUs) described in the
Facial Action Coding System (FACS). The intensities
of facial actions extracted from different individuals
over videos can be understood as a multivariate time
series that will be modeled in 3.1 object of analysis of
this work.
The main contributions of this work are: (i) Us-
ing data extracted from video interviews, we propose
a BP clustering methodology based on AUs; (ii) We
provide an analysis of the relationship between BP
and AUs, which can be used for decision-making by
HR professionals; (iii) We make the database avail-
able to the community in the hope that it can support
BP and FE related investigations.
The rest of the paper is organized as follows: Sec-
tion 2 (Background) presents an overview of BPM;
Section 3 (Related Work) introduces concepts about
AUs and MTS analysis; In Section 4 (Experimental
Setup) we present the dataset and applied methodol-
ogy. We discuss the Experimental results in Section 5.
Finally, conclusions and future works on this study
are shown in Section 6.
2 BACKGROUND
2.1 Overview of BPM Studies
The first studies to understand personality and BP
date back to before the Judeo-Christian period (Per-
rotta, 2019). Generally, human behavior is divided
into four categories. For example, during ancient
Greece, human behavior was related to the four clas-
sical elements of nature: fire, water, earth, and air.
It was common to associate these elements with hu-
man faculties, such as morality as fire, aesthetics and
soul with water, intellectual with air, and physics with
earth. Hippocrates, the father of medicine, associ-
ated certain temperaments with the balance of body
fluids: blood, black bile, yellow bile, and phlegm.
Later, these temperaments were used by Galean to
create BP nomenclatures choleric, sanguine, phleg-
matic, and melancholic (Yahya et al., 2020).
Carl Gustav Jung refined Galean proposal, advo-
cating the existence of four main psychological func-
tions through which the individual experiences the
environment (Bradway, 1964). These are the func-
tions of sensation perception, intuition, the functions
of feeling judgment, and thought. Jung argued that
only one of these functions was dominant most of the
time and that being a dominant function was charac-
terized as conscious behavior, while the repressed op-
posite was unconscious (Wilsher, 2015).
A large number of psychometric tests have been
developed over time for use in psychological assess-
ments, particularly during the selection and recruit-
ment process. One of the most famous is the Myers-
Briggs Type Indicator (MBTI), which is a self-report
assessment tool that analyzes a person’s personality
and behavior in specific situations (Henderson and
Nutt, 1980; Murray, 1990; Sak, 2004). In the early
20th century, many other methodologies for personal-
ity assessment were also developed.
In 1932, the psychologist McDougall proposed
the BigFive model, which defines five main factors
that influence personality: Neuroticism, Extroversion,
Amiability, Conscientiousness, and Openness to ex-
perience. Several studies present applications of Big-
Five in their assessments of behavioral responses,
such as performance and care preferences (Tapus
et al., 2014), emotions (Koh
´
ut et al., 2021), moral dis-
interest, unethical decision-making (Rengifo and La-
ham, 2022), and pro-social versus antisocial person-
ality traits (Denissen et al., 2022).
The DISC was proposed by psychologist William
Moulton Marston (Weiming, 2011). His approach de-
fines four main types of behavior: (i) Dominance;
which refers to control, power, and assertiveness, (ii)
Influence; related to communication and social re-
lationships, (iii) Stability; which refers to patience
and persistence, and (iv) Conscientiousness; related
to organization and structure. Applications such as
personality assessment of students to send feedback
to counselors and teachers about teaching methods,
motivations, suggestions (Agung and Yuniar, 2016),
assessment of students’ response to videos during
testing (Genc and Hassan, 2019), and assessment of
users’ tweets to determine PCs (Setiawan and Wafi,
2020; Utami et al., 2021) are presented in the litera-
ture. These and other models are widely applied, and
ICEIS 2023 - 25th International Conference on Enterprise Information Systems
494

others arise due to them. This is the case of the PACE
model, which is inspired by DISC and other method-
ologies and which will be presented in Subsection 2.2.
2.2 PACE Behavioral
The PACE is a BPM approach that combines el-
ements from the DISC personality assessment and
other methods. It has gained popularity in Brazil due
to its simplicity and ability to reflect cultural charac-
teristics in profile assessments accurately. It is based
on a questionnaire where the individual is asked to
answer two questions. These questions are designed
to assess the individual’s internal and external self-
perception. The answers to these questions are used
to determine the individual’s BP. The PACE BP are
Planner (P), Analyst (A), Communicator (C), and Per-
former (E) and their combinations. All have four BPs,
and the system assigns the respondent a probability
for each BP. Thus, according to these probability as-
signments, the weighting of the dominance or com-
bination of profiles is done to determine that individ-
ual’s ranking by the system.
Profiles P have marked patience, stability,
thoughtfulness, and persistence. They are calm, quiet,
prudent, and controlled. They like to follow the rules
and routines, interacting with active, dynamic peo-
ple and formal environments. They need stable, se-
cure work environments, support when working in
teams and changing priorities, and develop emotions
related to self-confidence, stubbornness, excessive
worry, and greater flexibility to change.
Profiles A are precise, insightful, responsible, dis-
creet, observant, quiet, concerned, detail-oriented,
and rigid. They are calm, centered, intelligent, and
can be perfectionists (skilled at tasks that require de-
tail and risk management). They need to be stimu-
lated to put their projects into practice, as they suffer
from fears and conflicts when making mistakes and
not thinking through possibilities. They tend to be
quiet or withdraw momentarily when under pressure,
but overcome this by deepening their knowledge.
Profiles C are sociable, enthusiastic, confident,
outgoing, adapt quickly, and dislike monotony. They
have ease of communication and change, with move-
ment and autonomy, work best in teams, are imagi-
native, have artistic feelings, and need interpersonal
contact and a harmonious environment. They don’t
like to go unnoticed, they are festive, lively, relaxed,
travel and go out. They dislike routine, details, and
understatement, and they are agile and quick-witted.
They can be immature, impetuous, and need help to
finish what they start.
E profiles are determined, independent, self-
motivated, active, competitive, dynamic, take risks
and challenges, are hard workers with great physi-
cal dispositions, and demonstrate perseverance. They
have a logical and deductive attitude, obstacles stimu-
late them to act more and more, their imagination and
judgment are balanced. They give priority to execu-
tion rather than thinking about how to do it, they pre-
fer autonomy, independence and know-how to impose
themselves on others. They must learn to be more
flexible, they can be inflexible and authoritarian.
We note that the PACE BPM is not intended to dis-
criminate between employees, but to understand the
BP, due to the obvious differences in behavior, to sup-
port management decisions and thus better manage
the organization’s workforce. In this paper, we build a
dataset whose profile classification follows the PACE
methodology described above. More details about the
dataset will be discussed in the section 4.
3 RELATED WORK
3.1 Facial Expression Analysis
The application of face and action recognition can be
found in many areas, such as biology, neuroscience,
psychology, disease detection, human emotions, se-
curity, learning systems, and surveillance. However,
face recognition is challenging as many variations in
head posture, lighting, and scale can affect the accu-
racy of the results. Facial Expressions (FEs) reveal
intent, affect, and emotion (Baltrusaitis et al., 2018).
It is possible to extract FE features in videos, such
as facial markings, head pose estimation, Action Unit
(AU) recognition, gaze estimation in using e.g., the
OpenFace tool
1
. OpenFace was built on the basis of
the Face Action Coding System (FACS), first pub-
lished in 1978 by Paul Ekman and Wallace V. Friesen.
FACS is useful for identifying and measuring any FE
that a human being might make. It is an anatomi-
cally based system for describing all observable facial
movements in a comprehensive manner. Each observ-
able component of easy movement is called AU and
an EF can be divided into its constituent AUs.
Similar FEs follow the same pattern of relaxation
and contraction of muscles in specific regions of the
face (Lifkooee et al., 2019). For this reason, it is
possible to define some units of action based on the
area of the face whose muscles are contracted and
relaxed. Facial units are defined as the variation of
muscles in different locations of the face, eyes, mouth
and eyebrows. These units follow patterns such as re-
1
https://github.com/TadasBaltrusaitis/OpenFace
An Unsupervised Approach for Study of the Relationship Between Behavioral Profile and Facial Expressions in Video Interviews
495
OpenFace
Features
TICC
5
4
3
2
1
...
Cluster 1
Profile
Cluster 2
Profile
Cluster 3
Profile
Cluster K-2
Profile
Cluster K-1
Profile
Cluster K
Profile
6
Multivariate
Time Series
Video interview
database
Figure 2: Facial Expression Analysis Approach as Multivariate Time Series (FEAA-MTS).
laxation and contraction in different FE. The AUs are
described in Table 1.
This variation in muscle movements is important
temporal information for identifying the AUs pre-
sented according to the dynamics of the face 46 AUs
describe 7000 FE. The advantage of using them is
that they allow for representing a large number of
FEs using a limited number of units. However, it
can sometimes be challenging for classifiers to un-
derstand the spatial relevance of the action units as
a class label since each belongs to a specific region of
the face (Lifkooee et al., 2019). Facial activity is a dy-
namic event where activation and movement of facial
muscles can be expressed as a function of time. AUs
have activation velocities, intensity or magnitude, and
orders of occurrence that are key to distinguishing
movement (Tong and Ji, 2015).
Table 1: Description of AUs (Baltrusaitis et al., 2018).
Action Unit Description
AU01 r Inner Brow Raiser
AU02 r Outer Brow Raiser
AU04 r Brown Lowerer
AU05 r Upper Lid Raiser
AU06 r Cheek Raiser
AU07 r Lid Tightener
AU09 r Nose Wrinkler
AU10 r Upper Lip Raiser
AU12 r Lip Corner Puller
AU014 r Dimpler
AU15 r Lip Corner Depressor
AU17 r Chin Raiser
AU20 r Lip Stretched
AU23 r Lip Tightener
AU25 r Lips Part
AU26 r Jaw Drop
AU45 r Blink
The extraction intensity provided by the Open-
Face tool is always a value between 0 and 5 (low
and high intensity). These features can be modeled as
Multivariate Time Series (MTS), as multiple variables
are being recorded over time from multiple individu-
als with different BP. The AUs have features that are
key to distinguishing movement (Tong and Ji, 2015),
including patterns of relaxation and contraction in dif-
ferent FEs.
A MTS is a set of variables observed and mea-
sured at regular intervals of (Hallac et al., 2017). Each
variable is a function of time, and typically, they are
correlated with each other. This set of variables col-
lected over time form a MTS (Hallac et al., 2017;
Kapp et al., 2020; Gui et al., 2021) that contains a col-
lection of unique series called components, which are
represented by vectors or matrices. Statistical tech-
niques are used to analyze the relationships between
multiple variables over time.
(a) Behavior for BP P (b) Behavior for BP A
(c) Behavior for BP C (d) Behavior for BP E
Figure 3: Behavior MTS for profiles PACE.
These techniques involve identifying patterns,
trends, and correlations in data, which can be used to
make predictions of values of variables. This method-
ology has been used in many fields, including eco-
nomics, finance, meteorology and biology, engineer-
ing (Hallac et al., 2017; Li, 2019). The application
ICEIS 2023 - 25th International Conference on Enterprise Information Systems
496

of MTS is seen in the contexts of analyzing the be-
havior of automotive and synthetic sensor data (Hal-
lac et al., 2017), detecting failure patterns in factory
parts (Kapp et al., 2020), and extracting human ac-
tion (Gui et al., 2021).
Analysis of multivariate distributions makes it
possible to describe the behavior of several vari-
ables simultaneously, investigating the relationship
between them, describing temporal and spatial depen-
dence structures, and also condensing the informa-
tion from several variables into a small number of la-
tent factors (Hallac et al., 2017). Clustering of MTSs
can be useful for identifying patterns and trends in
data that may not be visible when looking at individ-
ual TSs, such as the behavior of the MTS of AUs in
Figure 3. Such clustering can also help identify cor-
relations between different variables, can be used to
identify anomalies in the data, reduce data complex-
ity, reduce the number of variables that need to be
considered, and ultimately predict future values.
4 EXPERIMENTAL SETUP
This section aims to answer the following question:
is it possible to relate the intensity of FE to PACE
BP? The rest of this section describes the experimen-
tal setup used for this investigation.
4.1 Dataset
Candidates were instructed to voluntarily submit a
video presentation and answer a PACE MBP form.
The BP used in this paper are P, A, C, E, and combi-
nations. Asynchronous video interviews of job can-
didates generally present data such as name, address,
past experiences, goals, competencies, image of the
professional, voice, etc. These are personal data pro-
tected by LGPD (Potiguara Carvalho et al., 2020; Ca-
rauta Ribeiro and Dias Canedo, 2020; de Castro et al.,
2022) and therefore is disclosure is forbidden by the
authors. Another implication that justifies the non-
disclosure of the video base is the explosion of Deep-
Fakes (Westerlund, 2019; Yu et al., 2021).
These are fake videos created with free machine
learning-based software whose facial exchanges re-
sult almost perfect or leave little trace of manipula-
tion (G
¨
uera and Delp, 2018), thus individuals could
be targeted by hackers or malicious people. However,
the database of AUs intensity and presence and ab-
sence properly anonymized, as well as the individu-
als’ BP was made available as a contribution.
Also, since these are videos collected from candi-
dates demographic data (age, ethnicity, gender, etc.)
present many incompleteness and therefore were not
the focus of this work, nor were data on this presented
in the results. The Figure 4 shows the distribution of
the videos in relation to the BPs. It is possible to see
that the database adds up to 49% for the EC, CE, PA
and AP profiles, representing a certain bias in relation
to these profiles. One can also observe the presence
of the dominant BPs P, A, C, and E, in much smaller
quantities in relation to the previously mentioned BPs.
79
EC
61
CE
57
PA
50
AP
24
CP
24
E
22
EA
20
EP
18
PE
17
AE
15
PC
12
P
12
C
9
A
9
CEP
8
PEA
7
CA
6
APE
5
APC
4
PCE
4
PCA
4
PAE
4
ECA
3
CPA
3
AEP
3
EPA
3
ECP
3
EAP
2
PAC
2
AC
2
CAP
2
CPE
2
PEC
1
EPC
1
CAE
1
EAC
1
ACP
0 100 200 300 400 500
Number of video-interviews
Figure 4: Distribution of BP from the database PACE.
From the database of 500 video interviews, rang-
ing from 13s to 528s, about 94 were separated using
the criterion of 40% or greater probability of the in-
dividual belonging to one of the profiles. The MTS
were extracted from the intensities of the AUs using
the OpenFace tool, then clustering experiments were
performed using the TICC tool, and finally, compar-
isons with other techniques were performed. The fea-
ture file has about 121.965 lines containing intensity
information of 17 AUs described in 3.1, frame and
instant of extraction. In addition, the BP was incorpo-
rated after clustering for eventual analysis.
4.2 FEAA-MTS Approach
In Figure 2 one observes the FEAA-MTS approach
consisting of 6 steps. They are: (1) Select a sample of
video interviews (in the case of this work the database
has 500 videos), (2) Extract features from the video
interviews using the OpenFace tool (intensity of AUs,
presence, absence frame and instant of extraction), (3)
Filter extractions with 95% confidence and aggregate
the extractions to a single file (MTS-AUs), (4) The
generated MTS-AUs file will be input to the TICC
tool
2
, (5) Aggregation of the BP and clustering result
of the TICC into the MTS-AUs file, and finally (6)
Analyses and visualization of the MTS-AUs file data
2
https://github.com/davidhallac/TICC
An Unsupervised Approach for Study of the Relationship Between Behavioral Profile and Facial Expressions in Video Interviews
497
for understanding the BP of the individuals.
The TICC is an algorithm that combines two
optimization techniques which are Expectation-
Maximization (EM) (Dempster et al., 1977)
and Alternate Direction Method of Multipliers
(ADMM) (Boyd et al., 2011) and has the ability to
learn states and how they are partitioned. The EM
technique is simple to implement and works basically
by performing missing value estimation, updating the
parameters and repeating until convergence. ADMM,
on the other hand, solves convex optimization prob-
lems by dividing the problem into smaller problems,
where at each step the problem is approximated by a
quadratic programming problem.
Each state is a correlation network that is used
to group and segment the MTS. What distinguishes
TICC from other techniques is this correlation net-
work created using covariance, also called a Markov
random field (MRF), which is characterized by in-
dependence between the different observations in a
subclass (Hallac et al., 2017). It is this MRF that is
used by the algorithm to perform clustering, given the
window size information w. This MRF represents the
state that is repeated throughout the analyzed data and
will be used by the algorithm to perform the separa-
tion of the instances. In addition, the Gaussian Mix-
ture Model (GMM) (Xuan et al., 2001) and KMeans
algorithms (Syakur et al., 2018) are used to compare
the clustering performance of TICC. The difference
between them and TICC is the metric that each uses.
While TICC uses covariance, GMM uses mean and
standard deviation and KMeans uses Euclidean dis-
tance.
After processing, we obtain the clustering of the
MTS in relation to the intensity of the facial AUs of
the sample. With this, it is possible to perform the ag-
gregation of the cluster and the profile and then per-
form analysis and visualization of patterns that relate
cluster, with profiles, intensities and instants of occur-
rence in the videos.
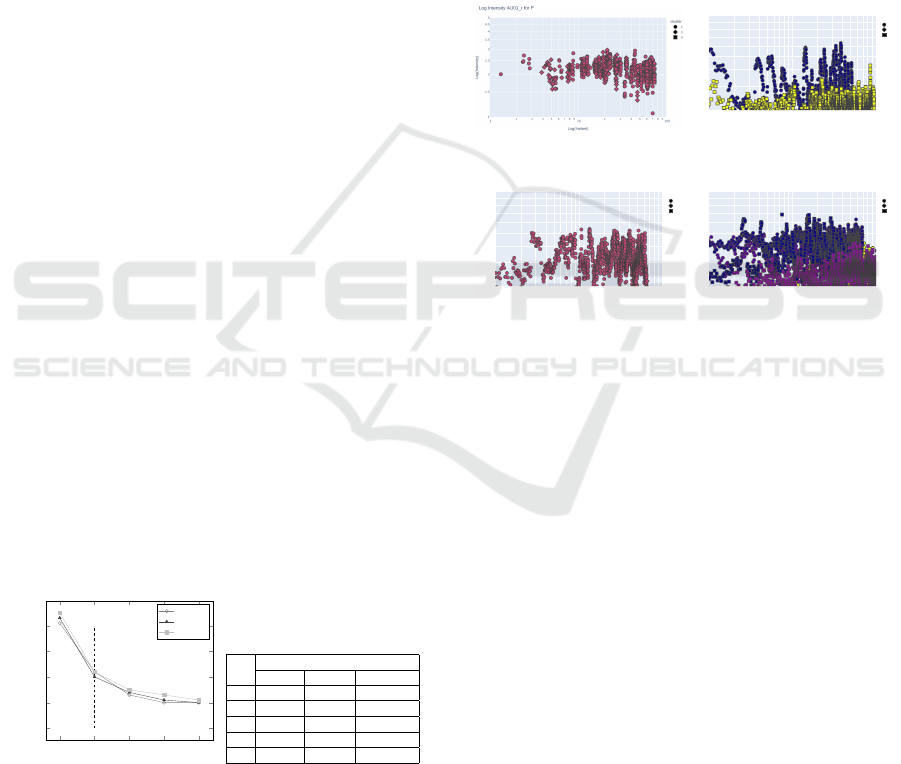
2 4
6
8 10
0
0.1
0.2
0.3
0.4
K
F1-score
TICC
GMM
KMeans
(a) Elbow method
K
F1-score
TICC GMM KMeans
2 0.41 0.43 0.45
4 0.22 0.20 0.22
6 0.13 0.14 0.15
8 0.10 0.11 0.13
10 0.10 0.10 0.11
(b) Clustering results
Figure 5: Comparison of TICC, GMM and KMeans.
5 EXPERIMENTAL RESULTS
An experiment was conducted using basically three
algorithms: TICC, GMM and KMeans. The two
main parameters investigated were the K relative to
the number of clusters and the size of the window
used (followed by the value of K). In Table 5 in (a)
we see the results of the F1-score metric presented by
the three algorithms. It can be noted that TICC did
not behave by presenting a higher value than the oth-
ers, however, we recall here that the purpose of its use
was to investigate the possibility of interpreting states
from the clustering of the multivariate time series of
AUs intensities.
(a) Behavior for BP P
1
2 3 4 5 6 7 8 9
10
2 3 4 5 6 7 8 9
100
1
1.5
2
2.5
3
3.5
4
4.5
5
cluster
3
0
1
Log Intensity AU01_r for A
Log(Instant)
Log(Intensity)
(b) Behavior for BP A
1
2 3 4 5 6 7 8 9
10
2 3 4 5 6 7 8 9
100
1
1.5
2
2.5
3
3.5
4
4.5
5
cluster
3
0
2
Log Intensity AU01_r for C
Log(Instant)
Log(Intensity)
(c) Behavior for BP C
1
2 3 4 5 6 7 8 9
10
2 3 4 5 6 7 8 9
100
1
1.5
2
2.5
3
3.5
4
4.5
5
cluster
2
0
3
Log Intensity AU01_r for E
Log(Instant)
Log(Intensity)
(d) Behavior for BP E
Figure 6: Behavior MTS for profiles PACE.
In Figure 5 in (b) we see that K = 4 is the opti-
mal value in the experiments performed and the per-
formance is very similar. The elbow (Syakur et al.,
2018; Cui et al., 2020) method was used, which basi-
cally tests the variance of the data against the num-
ber of clusters. You can see the elbow when you
plot the results on a graph, and this value indicates
that there is no gain with respect to increasing clus-
ters. It should be noted that only a portion of the data
was used due to limited resources in developing the
research. However, the opportunity was observed to
explore TICC on features extracted from video inter-
views, as a mechanism to understand and relate the
behavior of the studied profiles in a less biased way.
In general, there are differences between frequen-
cies, concentrations, and intensities of AUs among the
PACE BPs throughout the video interviews, as seen in
Figure 3 and one can observe the clustering behavior
in Figure 6, where the states identified by TICC for
AU01 are seen and the colors represent distinct indi-
viduals. It can also be stated that in all the profiles
analyzed, the predominant AUs were of low inten-
sity, except at the end of the video interviews, where
ICEIS 2023 - 25th International Conference on Enterprise Information Systems
498

a more significant increase occurs. A possible justifi-
cation for this may be the need to have an impact at
the end of the presentation, a fairly common mindset
for those who are giving a presentation competing for
a job opportunity.
6 CONCLUSIONS AND FUTURE
WORKS
The study allowed the investigation of the behavior
of AUs in video interviews of candidates, as a way
to characterize the PACE BP of these individuals.
The FEAA-MTS approach was proposed and applied,
which is an attempt to cluster MTS of AUs extracted
from FEs and thus try to identify states and associate
them with profiles. We found evidence of frequen-
cies and concentrations of AU intensities among the
different profiles, but due to the sample size and re-
source limitations we should avoid generalizations.
As future work, we intend to expand the investiga-
tions, using more data, re-evaluate different ways of
visualization to find different patterns and make the
approach more effective and consequently the study
less biased. Verify the impact of video summariza-
tion on the FEAA-MTS approach, since applying this
method can generate processing savings.
ACKNOWLEDGEMENTS
The present work was carried out with the support
of S
´
olides S.A. The authors thank the partial support
of the Pontifical Catholic University of Minas Gerais
(PUC Minas).
REFERENCES
Agung, A. A. G. and Yuniar, I. (2016). Personality assess-
ment website using DISC: A case study in informa-
tion technology school. In Proceedings of the Inter-
national Conference on Information Management and
Technology (ICIMTech), ICIMTech, pages 72–77.
Al-Nafjan, A., Hosny, M., Al-Ohali, Y., and Al-Wabil, A.
(2017). Review and classification of emotion recog-
nition based on eeg brain-computer interface system
research: a systematic review. Applied Sciences,
7(12):1239.
Baltrusaitis, T., Zadeh, A., Lim, Y. C., and Morency, L.-
P. (2018). Openface 2.0: Facial behavior analysis
toolkit. In Proceedings in 2018 13th IEEE interna-
tional conference on automatic face & gesture recog-
nition (FG 2018), pages 59–66. IEEE.
Boyd, S., Parikh, N., Chu, E., Peleato, B., Eckstein, J., et al.
(2011). Distributed optimization and statistical learn-
ing via the alternating direction method of multipli-
ers. Foundations and Trends® in Machine learning,
3(1):1–122.
Bradway, K. (1964). Jung’s psychological types: Classifi-
cation by test versus classification by self. Journal of
Analytical Psychology, 9(2):129–135.
Carauta Ribeiro, R. and Dias Canedo, E. (2020). Using
mcda for selecting criteria of lgpd compliant personal
data security. In The 21st Annual International Con-
ference on Digital Government Research, pages 175–
184.
Chernorizov, A. M., Isaychev, S. A., Zinchenko, Y. P.,
Galatenko, V. V., Znamenskaya, I. A., Zakharov, P. N.,
Khakhalin, A. V., and Gradoboeva, O. N. (2016). Psy-
chophysiological methods for the diagnostics of hu-
man functional states: New approaches and perspec-
tives. Psychology in Russia, 9(4):56.
Cui, M. et al. (2020). Introduction to the k-means clustering
algorithm based on the elbow method. Accounting,
Auditing and Finance, 1(1):5–8.
de Castro, E. T. V., Silva, G. R., and Canedo, E. D. (2022).
Ensuring privacy in the application of the brazilian
general data protection law (lgpd). In Proceedings of
the 37th ACM/SIGAPP Symposium on Applied Com-
puting, pages 1228–1235.
Dempster, A. P., Laird, N. M., and Rubin, D. B. (1977).
Maximum likelihood from incomplete data via the em
algorithm. Journal of the Royal Statistical Society:
Series B (Methodological), 39(1):1–22.
Denissen, J. J., Soto, C. J., Geenen, R., John, O. P., and van
Aken, M. A. (2022). Incorporating prosocial vs. anti-
social trait content in big five measurement: Lessons
from the big five inventory-2 (bfi-2). Journal of Re-
search in Personality, 96:104147.
Genc, P. and Hassan, T. (2019). Analysis of Personality
Dependent Differences in Pupillary Response and its
Relation to Stress Recovery Ability. In Proceedings
of the IEEE International Conference on Pervasive
Computing and Communications Workshops (PerCom
Workshops), pages 505–510.
Grosbois, J., Deffontaines, L. C., Caron, A., Van Berleere,
M., Terc
´
e, G., Le Rouzic, O., and Wallaert, B. (2020).
Influence of disc behavioral profile on the short-and
long-term outcomes of home-based pulmonary re-
habilitation in patients with chronic obstructive pul-
monary disease. Respiratory Medicine and Research,
77:24–30.
G
¨
uera, D. and Delp, E. J. (2018). Deepfake video detection
using recurrent neural networks. In Proceedings of the
2018 15th IEEE international conference on advanced
video and signal based surveillance (AVSS), pages 1–
6. IEEE.
Gui, J., Qin, Z., Jia, D., and Zhu, J. (2021). An approach
based on statistical features for extracting human ac-
tions from multivariate time series. In Proceedings
of the Journal of Physics: Conference Series, volume
1754, page 012198. IOP Publishing.
Hallac, D., Vare, S., Boyd, S., and Leskovec, J. (2017).
Toeplitz inverse covariance-based clustering of mul-
tivariate time series data. In Proceedings of the 23rd
An Unsupervised Approach for Study of the Relationship Between Behavioral Profile and Facial Expressions in Video Interviews
499

ACM SIGKDD International Conference on Knowl-
edge Discovery and Data Mining, pages 215–223.
Henderson, J. C. and Nutt, P. C. (1980). The influence of
decision style on decision making behavior. Manage-
ment science, 26(4):371–386.
Jerritta, S., Murugappan, M., Nagarajan, R., and Wan, K.
(2011). Physiological signals based human emotion
recognition: a review. In 2011 IEEE 7th international
colloquium on signal processing and its applications,
pages 410–415. IEEE.
Kapp, V., May, M. C., Lanza, G., and Wuest, T. (2020). Pat-
tern recognition in multivariate time series: Towards
an automated event detection method for smart manu-
facturing systems. Journal of Manufacturing and Ma-
terials Processing, 4(3):88.
Koh
´
ut, M., Koh
´
utov
´
a, V., and Halama, P. (2021). Big
five predictors of pandemic-related behavior and emo-
tions in the first and second covid-19 pandemic wave
in slovakia. Personality and individual differences,
180:110934.
Kumari, A., Tanwar, S., Tyagi, S., Kumar, N., Maasberg,
M., and Choo, K.-K. R. (2018). Multimedia big data
computing and internet of things applications: A tax-
onomy and process model. Journal of Network and
Computer Applications, 124:169–195.
Li, H. (2019). Multivariate time series clustering based on
common principal component analysis. Neurocom-
puting, 349:239–247.
Lifkooee, M. Z., Soysal,
¨
O. M., and Sekeroglu, K. (2019).
Video mining for facial action unit classification us-
ing statistical spatial–temporal feature image and log
deep convolutional neural network. Machine Vision
and Applications, 30(1):41–57.
Murray, J. B. (1990). Review of research on the myers-
briggs type indicator. Perceptual and Motor skills,
70(3 suppl):1187–1202.
Ng, C. F. (2016). Behavioral mapping and tracking. Re-
search methods for environmental psychology, pages
29–51.
Perrotta, G. (2019). The psychopathological profile of the
biblical god called yhwh (yahweh): a psychological
investigation into the behaviour of the judaic-christian
god described in the biblical old testament. J Neuro-
science and Neurological Surgery, 4.
Potiguara Carvalho, A., Potiguara Carvalho, F.,
Dias Canedo, E., and Potiguara Carvalho, P. H.
(2020). Big data, anonymisation and governance
to personal data protection. In The 21st Annual
International Conference on Digital Government
Research, pages 185–195.
Rengifo, M. and Laham, S. M. (2022). Big five personality
predictors of moral disengagement: A comprehensive
aspect-level approach. Personality and Individual Dif-
ferences, 184:111176.
Sak, U. (2004). A synthesis of research on psychologi-
cal types of gifted adolescents. Journal of Secondary
Gifted Education, 15(2):70–79.
Setiawan, H. and Wafi, A. A. (2020). Classification of Per-
sonality Type Based on Twitter Data Using Machine
Learning Techniques. In Proceedings of the 3rd Inter-
national Conference on Information and Communica-
tions Technology (ICOIACT), pages 94–98.
Silberschatz, A., Stonebraker, M., and Ullman, J. (1996).
Database research: achievements and opportunities
into the 1st century. ACM sIGMOD record, 25(1):52–
63.
Syakur, M., Khotimah, B., Rochman, E., and Satoto, B. D.
(2018). Integration k-means clustering method and
elbow method for identification of the best customer
profile cluster. In IOP conference series: materials
science and engineering, volume 336, page 012017.
IOP Publishing.
Tapus, A. et al. (2014). Towards personality-based as-
sistance in human-machine interaction. In The 23rd
IEEE International Symposium on Robot and Human
Interactive Communication, pages 1018–1023. IEEE.
Tong, Y. and Ji, Q. (2015). Exploiting dynamic dependen-
cies among action units for spontaneous facial action
recognition. Emotion Recognition: A Pattern Analysis
Approach, pages 47–67.
Tursunbayeva, A., Di Lauro, S., and Pagliari, C. (2018).
People analytics—a scoping review of conceptual
boundaries and value propositions. International
Journal of Information Management, 43:224–247.
Utami, E., Iskandar, A. F., Hartanto, A. D., and Raharjo, S.
(2021). DISC Personality Classification using Twit-
ter: Usability Testing. In Proceedings of the 5th Inter-
national Conference on Information Technology, In-
formation Systems and Electrical Engineering (ICI-
TISEE), ICITISEE’21, pages 180–185.
Weiming, G. (2011). Study on the application of disc behav-
ioral style in talent management in banking industry.
In Proceedings of the 8th International Conference on
Innovation & Management.
Westerlund, M. (2019). The emergence of deepfake tech-
nology: A review. Technology Innovation Manage-
ment Review, 9(11).
Wilsher, S. (2015). Behavior profiling: implications for re-
cruitment and team building. Strategic Direction.
Xuan, G., Zhang, W., and Chai, P. (2001). Em algorithms of
gaussian mixture model and hidden markov model. In
Proceedings 2001 international conference on image
processing (Cat. No. 01CH37205), volume 1, pages
145–148. IEEE.
Yahya, F., Ong, W. K., Ghazali, N. M., Yusoff, N. F. M.,
Anuar, A., Aren, M., Bakar, M. A. A., and Ibrahim,
N. H. (2020). The development of psychometric
instrument–lobg+ behavioral scale. PalArch’s Jour-
nal of Archaeology of Egypt/Egyptology, 17(7):4345–
4358.
Yu, P., Xia, Z., Fei, J., and Lu, Y. (2021). A survey on
deepfake video detection. Iet Biometrics, 10(6):607–
624.
APPENDIX
More information, database, details and analysis are
available at https://drive.google.com/drive/folders/
1m4 78jlexsTtiYDuE-cOtnHQ1rQ oh8M?usp=
sharing by permission and approval of the authors.
ICEIS 2023 - 25th International Conference on Enterprise Information Systems
500
