
Empirical Analysis for Investigating the Effect of Machine Learning
Techniques on Malware Prediction
Sanidhya Vijayvargiya
1
, Lov Kumar
2
, Lalita Bhanu Murthy
1
, Sanjay Misra
3
, Aneesh Krishna
4
and Srinivas Padmanabhuni
5
1
BITS-Pilani Hyderabad, India
2
NIT kurukshetra, India
3
Østfold University College, Halden, Norway
4
Curtin University, Australia
5
Testaing.Com, India
A.Krishna@curtin.edu.au
Keywords:
SMOTE, ANOVA, Genetic Algorithm, Ensemble Learning, Malware Family.
Abstract:
Malware is used to attack computer systems and network infrastructure. Therefore, classifying malware is
essential for stopping hostile attacks. From money transactions to personal information, everything is shared
and stored in cyberspace. This has led to increased and more innovative malware attacks. Advanced packing
and obfuscation methods are being used by malware variants to get access to private information for profit.
There is an urgent need for better software security. In this paper, we identify the best ML techniques that can
be used in combination with various ML and ensemble classifiers for malware classification. The goal of this
work is to identify the ideal ML pipeline for detecting the family of malware. The best tools for describing
malware activity are application programming interfaces (APIs). However, creating API call attributes for
classification algorithms to achieve high accuracy is challenging. The experimental results demonstrate that the
proposed ML pipeline may effectively and accurately categorize malware, producing state-of-the-art results.
1 INTRODUCTION
During the COVID-19 pandemic, technological ad-
vancements led to a huge influx of new internet users,
and the virtual world made up a bigger part of one’s
life. This has resulted in a large amount of private in-
formation about individuals and organizations being
shared and stored digitally. The security of this infor-
mation has been continuously tested by an increasing
number of malware attacks. The different varieties
of malware include worms, viruses, Trojan horses,
ransomware, rootkits, etc. Malware variations have
the ability to steal sensitive information, launch dis-
tributed denial of service (DDoS) assaults, and cause
havoc to computer systems.
Due to the varying nature of the malware, it is not
enough to simply detect the presence of the malware
but to deal with it properly, its family also needs to
be identified. For this purpose, to observe the be-
havior of the malware when training malware clas-
sification models, they are often run in virtual envi-
ronments, which do not affect the daily functioning
of the computer. The malware files are analyzed and
static, as well as dynamic features, are extracted from
the files. As malware becomes better at disguising it-
self, the need for better techniques for classification
increases. Machine Learning methods have shown
to be reliable but as the complexity of malware in-
creases, Deep Learning methods are being explored
(Zhang et al., 2019). But these DL methods are still
very new and have not been able to provide the im-
pressive boost in performance they have in other ap-
plications. Ensemble classifiers have still been shown
to outperform DL classifiers (Daeef et al., 2022).
In this work, we attempt to identify the best ML
techniques for malware classification and propose the
ideal ML pipeline for future works. The following is
a list of the research questions (RQs) that will be used
to accomplish the objectives.
• RQ1: Which feature selection or dimensional-
ity reduction technique is best suited for malware
classification?
Vijayvargiya, S., Kumar, L., Mur thy, L., Misra, S., Krishna, A. and Padmanabhuni, S.
Empirical Analysis for Investigating the Effect of Machine Learning Techniques on Malware Prediction.
DOI: 10.5220/0011858200003464
In Proceedings of the 18th International Conference on Evaluation of Novel Approaches to Software Engineering (ENASE 2023), pages 453-460
ISBN: 978-989-758-647-7; ISSN: 2184-4895
Copyright
c
2023 by SCITEPRESS – Science and Technology Publications, Lda. Under CC license (CC BY-NC-ND 4.0)
453

• RQ2: Does using oversampling techniques like
SMOTE result in better classification models than
training the classifiers on imbalanced data?
• RQ3: Since malware classification is a multi-class
problem, does the One vs. One approach or the
One vs. Rest approach work best?
• RQ4: Which ML classifier gives the best results?
The following are the contributions made by this
study:
• An in-depth analysis of how One vs. One and One
vs. Rest classification techniques result in varying
performance.
• The impact on the performance of training with
a balanced dataset using oversampling techniques
is explored.
• Due to a large number of works on this topic,
there is no proper comparison of the numerous
ML techniques available. We compare the most
commonly used classifiers and various feature se-
lection techniques.
• The performance of malware classification mod-
els is assessed and analyzed using key perfor-
mance indicators in the study. In contrast to ear-
lier research, we provide a thorough statistical
analysis to support the findings in this study us-
ing statistical testing.
The remainder of this paper is structured as fol-
lows: Section 2 presents a literature review of vari-
ous methods for previous works on malware classifi-
cation. Section 3 describes the various study design
settings and the experimental dataset collection. In
Section 4, the study design is described using an ar-
chitectural framework. The results of the experiments
are provided in Section 5, along with an analysis
of them. Section 6 compares malware classification
models created using various feature selection strate-
gies, widely used classifiers, and class-balancing al-
gorithms. Section 7 concludes by summarizing the re-
search results and offering suggestions for additional
studies.
2 RELATED WORKS
2.1 Feature Extraction and Selection
Daeef et al. (Daeef et al., 2022) highlighted the im-
portance of selecting the right set of features for mal-
ware family classification-based API calls. Malware
analysis can be conducted in various ways. The static
method does not require the malware to be run. The
features derived from this type of analysis are not suit-
able for malware variants that have frequent changes
in dangerous functions, code, structures, etc. The
benefit of static analysis is that the scope of analy-
sis covers the entire code. In contrast, reverse engi-
neering of malware is not required for dynamic anal-
ysis. The malware is run in an isolated environment
and various metrics, such as API calls, registry ac-
cess, etc., are used to record the behavior of the mal-
ware. The secure environment for such analysis is
provided by Sandbox technology. Jaccard similarity
between the API calls by different malware families,
and the frequency of API calls, among others, are key
features highlighted in this work. In their experimen-
tal results, the authors found that the Random Forest
classifier with the proposed API call features was able
to outperform RNN networks like LSTM and GRU.
2.2 Machine Learning-Based
Classification
Kouliaridis et al. (Kouliaridis and Kambourakis,
2021) conducted a study of machine-learning tech-
niques in android malware detection. The authors
focused on android malware detection due to the
open-source nature of the software which makes it a
prime target for malware writers. The key techniques
highlighted which improve performance include fea-
ture selection and dimensionality reduction to reduce
noise and bias. Ensemble models, which build upon
multiple classifiers, improve the overall classification
performance and can be used together with the above-
mentioned techniques. The survey spans a period
from 2017 to 2021 android malware detection.
Turker et al. (T
¨
urker and Can, 2019) proposed
a framework AndMFC for Android Malware Fam-
ily Classification. The framework extracts API calls
and requested permissions from malware samples and
various machine learning classifiers are trained on this
data. This framework succeeds at detecting unknown
malware, those that the model has not seen before,
with high accuracy. The various classifiers employed
in this framework are AdaBoost, Logistic Regression,
Multi-Layer Perceptron etc.. The framework is evalu-
ated on three datasets. The results show utilizing both
static analysis, and dynamic analysis of the malware
samples helps achieve better performance. Feature
ranking was used to select the top 1000 features from
the original set of features. The framework achieved
93.63% accuracy in recognizing unknown malware in
the AMD dataset. On Drebin and UpDroid datasets,
AdaBoost and SVM achieved the highest accuracies
of 96.79% and 94.66% respectively.
ENASE 2023 - 18th International Conference on Evaluation of Novel Approaches to Software Engineering
454

2.3 Deep Learning-Based Classification
A framework based on a deep learning approach is
proposed by Aslan et al. (Aslan and Yilmaz, 2021).
The study’s primary contribution is the suggestion of
a novel hybrid design that optimally combines two di-
verse pre-trained network models. The malware is vi-
sualized as an image which is then processed through
a ResNet-50 and AlexNet architecture. The results
of the two pre-trained models are combined. On the
Malimg dataset, the framework is able to achieve an
accuracy of 97.78%. The benefits of a DL approach
as highlighted in the paper, among others, are:
• DL reduces the need for feature engineering
• DL increases accuracy
• DL reduces the feature space
A recurrent network-based approach to extract the
API call patterns of malware families was attempted
by Kwon et al. (Kwon and Im, 2017). LSTMs were
trained on 551 representative API call patterns of 9
malware families. On a testing set of 236 samples,
the LSTMs achieved an accuracy of 71%. The au-
thors highlighted a limitation that the malware sam-
ple utilized for analysis may not accurately match the
Kaspersky malware family classification criteria. An
area of improvement that was pointed out was when
collecting patterns for APIs called by malware and as-
sessing them, the authors solely considered the types
and order of the APIs that were invoked. Since the
API is higher level than the computer’s machine code
or assembly, extracting the malware API’s semantic
criteria and semantic differentiation may boost per-
formance. Further, this work did not include pre-
processing for the input to the LSTM. Pre-processed
inputs can also improve the results.
3 STUDY DESIGN
3.1 Dataset
The dataset used to test the various models in this pa-
per is the Malware API Call Histogram Dataset by
Paul Black published in the 13th International Cyber-
security Data Mining Competition (CDMC2022). It
contains 9 malware families that are to be predicted
by the models. The features of the malware are ex-
tracted from malware samples provided by Abuse.ch.
Dynamic analysis was performed in a Cuckoo sand-
box to extract the features. A histogram of API calls
makes up the features. The training set consists of
537 samples and the testing set contains 134 samples.
The label of each sample is stored in the first column
of the dataset.
3.2 Class-Balancing Techniques
An imbalance in samples of malware families in the
training dataset has led to underperforming mod-
els. Synthetic Minority Oversampling Technique
(SMOTE) is an oversampling class balancing tech-
nique that helps get an equal number of instances
of each class in the training set. The classification
models are trained on both the balanced and the im-
balanced datasets, and the variation in performance
is compared between the two sets of models. The
k-nearest neighbors of the data are then found via
SMOTE after sampling data from the minority class.
The chosen k-nearest neighbor is then used to mix the
collected data to produce synthetic data.
3.3 Feature Selection and
Dimensionality Reduction
Techniques
Four sets of features are fed as input to the classifiers.
Multiple previous works could get an improvement in
performance with a better set of features (Kwon and
Im, 2017). These include the set of original features
in the dataset to compare whether there is an improve-
ment in performance or regression due to the new fea-
tures. The feature selection techniques used are Anal-
ysis of Variance (ANOVA), and Genetic Algorithm
(GA). The dimensionality reduction technique used is
Principal Component Analysis (PCA).
• Such datasets can be made less dimensional by
using PCA, which both enhances interpretability
and reduces data loss. We only pick the top pri-
mary components to get lower-dimensional data.
Although some information is lost, accuracy is
sacrificed in favor of simplicity. Sometimes the
connections between the variables are so strong
that redundant data is present.
• ANOVA is a method that assists in separating sys-
temic and random components from observed ag-
gregate variability in a dataset. The dependent
variable is significantly impacted by the systemic
elements but not by the random components. The
significance of the independent factors’ influence
on the dependent variables is examined using the
ANOVA test. These tests either accept the alter-
native hypothesis or reject the null hypothesis.
• Natural selection is simulated by genetic algo-
rithm, which means that only those species that
Empirical Analysis for Investigating the Effect of Machine Learning Techniques on Malware Prediction
455

can adapt to changes in their environment can sur-
vive, procreate, and pass on to the next generation.
To solve an issue, they essentially replicate ”sur-
vival of the fittest” among individuals of succes-
sive generations. Generating a population based
on subsets of the potential features is the first
step in the feature selection process. A predictive
model for the intended task is used to assess the
subgroups from this population. The best subset
is used to create the subsequent generation, with
some mutation(where some features are added or
removed at random) and cross-over (the selected
subset is updated with features from other well-
performing features).
3.4 Classification Techniques
We use 14 different classifiers, namely, Multinomial
Naive-Bayes, Bernoulli Naive-Bayes, Gaussian Naive
Bayes, Complement Naive Bayes, Decision Tree, k-
Nearest Neighbors, Linear Support Vector classifier,
Polynomial kernel Support Vector classifier, Radial
Basis function kernel Support Vector classifier, Extra
Trees classifier, Random Forest, Bagging classifier,
Gradient Boosting classifier, and AdaBoost classifier.
These classifiers are some of the most commonly used
classifiers for malware classification. They contain a
mix of simpler machine-learning classifiers and more
advanced ensemble classifiers. For each of these clas-
sifiers, both One vs One and the One vs Rest approach
is used. 5-fold cross-validation is used to validate the
results from the classification models.
4 RESEARCH METHODOLOGY
The dataset of malware API call histogram for mal-
ware classification, provided in CDMC 2022, is used
to train the various malware family classification
models. The dataset is subjected to two feature se-
lection techniques (genetic algorithm and ANOVA),
and one dimensionality reduction technique(PCA) to
get the best set of features to input into the classifiers.
The original set of features is also preserved. SMOTE
is used to balance the classes in the training set. The
models trained on the imbalanced dataset were used
for comparison.
The resulting data was fed to 2 variants, One vs
One classifier and One vs Rest classifier, of 14 differ-
ent classifiers for malware family prediction. In total,
224[4 sets of features * 2(1 balanced + 1 imbalance
dataset) * 2 multi-class classification approaches * 14
classifiers] distinct models were trained.
5 EXPERIMENTAL RESULTS
AND ANALYSIS
The trained models’ predictive power is evaluated us-
ing AUC values, recall, precision, and accuracy, as
shown in Table 1. The performance of the models
is generally excellent, with the highest accuracy val-
ues being 98%, but for certain models, there is a stark
drop in performance. Thus, it is crucial to select the
right set of ML techniques.
We have utilized box plots for visual comparison
of each performance parameter. Statistical analysis
using the Friedman test for each ML approach is em-
ployed to validate the findings and draw conclusions.
The Friedman test either rejects the null hypothesis
and accepts the alternative hypothesis, or it accepts
the null hypothesis. The Friedman test’s 0.05 signif-
icance cutoff applies to all of the comparisons that
were done.
5.1 RQ1: Which Feature Selection or
Dimensionality Reduction
Technique Is Best Suited for
Malware Classification?
The set of features input to the classifiers greatly im-
pacts the performance as the malware becomes better
at disguising itself. Some features may be redundant
and thus hinder the classification models. Thus, di-
mensionality reduction techniques like PCA are im-
portant. Genetic algorithm is a potent technique for
feature selection where the original set of 208 fea-
tures is reduced to 10. ANOVA is a statistical tech-
nique that reduces the same original features to 163.
PCA, on the other hand, reduces 208 features to 179
features.
The best feature selection technique is the Genetic
algorithm; wherein, even with ten features, it can cap-
ture the most relevant information required for clas-
sification into different malware families, as seen in
Figure 1. The less number of features also make it
computationally efficient to train models. The visual
differences between the box plots of the feature selec-
tion techniques are not easily seen. The Friedman test
helps statistically reject the null hypothesis that the
different feature selection techniques do not signifi-
cantly affect performance. The lower the mean rank
in the Friedman test, the better the performance. The
degree of freedom was taken to be three. The results
of the Friedman test, as seen in Table 2, show that the
genetic algorithm performs better than the other fea-
ture selection techniques. PCA regresses the perfor-
mance of the models compared to the original set of
ENASE 2023 - 18th International Conference on Evaluation of Novel Approaches to Software Engineering
456

Table 1: Performance Parameters.
ORG-DATA SMOTE DATA
ONE-ONE ONE-REST ONE-ONE ONE-REST
Accuracy F-Measure AUC Accuracy F-Measure AUC Accuracy F-Measure AUC Accuracy F-Measure AUC
AF
MNBC 40.60 0.34 0.81 89.66 0.89 0.97 85.70 0.85 0.97 88.38 0.87 0.97
BNBC 93.11 0.93 0.97 95.79 0.96 0.99 93.49 0.94 0.98 95.79 0.96 0.99
GNBC 51.77 0.46 0.88 90.29 0.88 0.96 48.40 0.43 0.88 91.19 0.90 0.96
CNBC 40.60 0.34 0.81 89.66 0.89 0.97 97.06 0.97 0.98 88.51 0.87 0.97
DT 97.39 0.97 0.99 98.08 0.98 0.99 97.83 0.98 0.99 97.32 0.97 0.99
KNN 97.02 0.97 0.99 97.57 0.98 0.99 97.96 0.98 0.99 97.57 0.98 0.99
SVCL 60.34 0.58 0.88 97.06 0.97 0.99 51.47 0.55 0.77 96.68 0.97 0.99
SVCP 33.52 0.33 0.58 74.07 0.75 0.90 23.75 0.26 0.53 60.92 0.61 0.78
SVCR 45.07 0.46 0.86 79.69 0.80 0.96 43.55 0.39 0.79 68.33 0.68 0.87
EXTRC 97.95 0.98 1.00 98.60 0.99 1.00 98.98 0.99 1.00 99.11 0.99 1.00
RFC 97.58 0.98 1.00 98.34 0.98 0.99 98.85 0.99 1.00 98.60 0.99 0.99
BAGC 97.95 0.98 0.99 98.08 0.98 0.99 97.83 0.98 0.99 97.32 0.97 0.99
GRABC 97.21 0.97 0.99 98.21 0.98 0.99 97.70 0.98 0.99 97.57 0.98 0.99
ADABC 97.58 0.98 0.98 98.21 0.98 0.99 98.85 0.99 0.99 97.70 0.98 0.99
ANOVA
MNBC 40.41 0.34 0.81 89.78 0.89 0.97 85.31 0.84 0.96 89.53 0.89 0.94
BNBC 92.74 0.93 0.98 95.02 0.95 0.99 93.49 0.93 0.98 95.79 0.96 0.99
GNBC 52.51 0.46 0.88 97.96 0.98 0.98 51.72 0.46 0.88 97.57 0.98 0.98
CNBC 40.41 0.34 0.81 89.78 0.89 0.97 87.61 0.87 0.98 89.53 0.89 0.94
DT 97.58 0.98 0.99 98.34 0.98 0.99 97.32 0.97 0.99 97.45 0.97 0.99
KNN 97.02 0.97 0.99 97.57 0.98 0.99 74.84 0.72 0.90 73.31 0.70 0.90
SVCL 61.45 0.59 0.87 96.93 0.97 0.99 45.72 0.46 0.75 92.98 0.93 0.98
SVCP 34.45 0.34 0.60 73.82 0.74 0.90 33.33 0.31 0.60 50.32 0.49 0.79
SVCR 44.69 0.47 0.85 79.69 0.80 0.96 42.78 0.42 0.79 61.94 0.62 0.84
EXTRC 97.95 0.98 1.00 98.60 0.99 1.00 98.98 0.99 1.00 99.11 0.99 1.00
RFC 97.58 0.98 1.00 98.60 0.99 0.99 98.60 0.99 1.00 98.72 0.99 1.00
BAGC 97.77 0.98 0.99 98.47 0.98 0.99 98.21 0.98 0.99 97.57 0.98 0.99
GRABC 97.77 0.98 0.99 98.34 0.98 0.99 98.21 0.98 0.99 97.96 0.98 0.99
ADABC 97.58 0.98 0.99 98.08 0.98 0.99 97.96 0.98 0.99 98.34 0.98 0.99
GA
MNBC 60.15 0.54 0.96 59.78 0.54 0.95 47.25 0.52 0.69 89.53 0.89 0.94
BNBC 89.39 0.90 0.97 89.57 0.90 0.98 89.40 0.90 0.96 95.79 0.96 0.99
GNBC 93.11 0.93 0.97 94.04 0.94 0.98 74.58 0.70 0.92 97.57 0.98 0.98
CNBC 95.16 0.95 0.98 95.16 0.95 0.98 88.12 0.88 0.95 89.53 0.89 0.94
DT 96.65 0.97 0.98 96.28 0.96 0.98 95.91 0.96 0.98 97.06 0.97 0.99
KNN 96.65 0.97 0.99 96.83 0.97 1.00 96.81 0.97 1.00 73.31 0.70 0.90
SVCL 97.95 0.98 0.99 97.21 0.97 0.99 97.83 0.98 0.99 88.63 0.88 0.99
SVCP 89.20 0.89 0.95 73.93 0.74 0.90 81.23 0.82 0.92 50.32 0.49 0.79
SVCR 96.46 0.96 1.00 96.09 0.96 1.00 97.19 0.97 1.00 61.94 0.62 0.84
EXTRC 97.21 0.97 1.00 97.39 0.97 1.00 98.47 0.98 1.00 98.85 0.99 1.00
RFC 97.21 0.97 1.00 97.02 0.97 0.99 98.08 0.98 1.00 98.85 0.99 1.00
BAGC 97.39 0.97 0.99 95.90 0.96 0.99 96.93 0.97 0.99 97.06 0.97 1.00
GRABC 97.02 0.97 0.99 96.46 0.96 0.99 96.81 0.97 0.98 97.96 0.98 0.99
ADABC 97.39 0.97 0.99 96.83 0.97 0.99 98.08 0.98 0.99 98.34 0.98 0.99
features. ANOVA test and the original set of features
give very similar results. The genetic algorithm set of
features results in a mean of 0.97 AUC, a minimum
AUC of 0.69, and a maximum AUC of 1.
Table 2: AUC: Statistical and Friedman test results of fea-
ture selection.
AF ANOVA PCA GA Rank
AF 1.00 0.86 0.20 0.22 2.48
ANOVA 0.86 1.00 0.30 0.15 2.49
PCA 0.20 0.30 1.00 0.01 2.85
GA 0.22 0.15 0.01 1.00 2.18
5.2 RQ2: Does Using Oversampling
Techniques like SMOTE Result in
Better Classification Models than
Training the Classifiers on
Imbalanced Data?
Most datasets used to train malware classification
models are imbalanced. Multiple papers have at-
tempted to solve this problem using various tech-
niques. From the visual representation in the box
plot in Figure 2, we can deduce that SMOTE leads
to regression in performance. This is verified by the
Empirical Analysis for Investigating the Effect of Machine Learning Techniques on Malware Prediction
457

AF
ANOVT
PCA
GA
20
30
40
50
60
70
80
90
100
Accuracy
AF
ANOVT
PCA
GA
0.3
0.4
0.5
0.6
0.7
0.8
0.9
1
Precision
AF
ANOVT
PCA
GA
0.3
0.4
0.5
0.6
0.7
0.8
0.9
1
Recall
AF
ANOVT
PCA
GA
0.6
0.7
0.8
0.9
1
AUC
Figure 1: Performance Parameters Boxplots of feature selection.
Friedman test, which has a null hypothesis, “the over-
sampling technique used to balance the dataset does
not have a significant effect on the performance.” As
seen in Table 3, the original, imbalanced dataset has a
mean rank of 1.41, whereas the dataset after SMOTE
was applied gave a mean rank of 1.59. Based on the
descriptive statistics, both sets of models are similar,
with the original dataset having a minimum AUC of
0.58, a maximum AUC of 1, and a mean AUC of 0.95.
The SMOTE dataset has a minimum AUC of 0.53, a
maximum AUC of 1, and a mean AUC of 0.93.
ORGD
SMOTE
20
40
60
80
100
Accuracy
ORGD
SMOTE
0.3
0.4
0.5
0.6
0.7
0.8
0.9
1
Precision
ORGD
SMOTE
0.3
0.4
0.5
0.6
0.7
0.8
0.9
1
Recall
ORGD
SMOTE
0.6
0.7
0.8
0.9
1
AUC
Figure 2: Performance Parameters Boxplots of SMOTE.
Table 3: AUC: Statistical and Friedman test results of
SMOTE.
ORG SMOTE Rank
ORG 1.00 0.57 1.41
SMOTE 0.57 1.00 1.59
5.3 RQ3: Since Malware Classification
Is a Multi-Class Problem, Does the
One vs. One Approach or the One
vs. Rest Approach Work Best?
The classification by the classifiers can be One vs.
One or One vs. Rest. As per the box plots in Figure
4, we can tell that the One vs. One classifier far out-
performs the One vs. Rest classifiers. There is much
less variance in the former. To validate this claim, we
look at the mean ranks in the Friedman test in Table
4. One vs. Rest classifiers has a mean rank of 1.62
compared to the 1.38 mean rank of the One vs. One
classifier. The One vs. One classifier has a minimum
AUC of 0.6, a maximum AUC of 1, and a mean AUC
of 0.96. One vs. Rest classifiers has a minimum AUC
of 0.53, a maximum AUC of 1, and a mean AUC of
0.93. The One vs. One classifier has a Q1 of 0.96 to
0.88 of the One vs. Rest classifiers. The null hypoth-
esis of the Friedman test, carried out with a degree of
freedom equal to 1, is “the different methods of clas-
sification, One vs One, and One vs Rest, do not have a
significant effect on the performance of the models.”
Thus, it is clear that the One vs. One approach should
be preferred for multi-class malware family classifi-
cation.
ENASE 2023 - 18th International Conference on Evaluation of Novel Approaches to Software Engineering
458
ONEVSREST ONEVSONE
20
30
40
50
60
70
80
90
100
Accuracy
ONEVSREST ONEVSONE
0.3
0.4
0.5
0.6
0.7
0.8
0.9
1
Precision
ONEVSREST ONEVSONE
0.3
0.4
0.5
0.6
0.7
0.8
0.9
1
Recall
ONEVSREST ONEVSONE
0.6
0.7
0.8
0.9
1
AUC
Figure 4: Performance Parameters Boxplots of One vs. One
approach or the One vs. Rest.
Table 4: AUC: Statistical and Friedman test results of One
vs. One approach or the One vs. Rest.
ONEONE ONEREST Rank
ONEONE 1.00 0.15 1.62
ONEREST 0.15 1.00 1.38
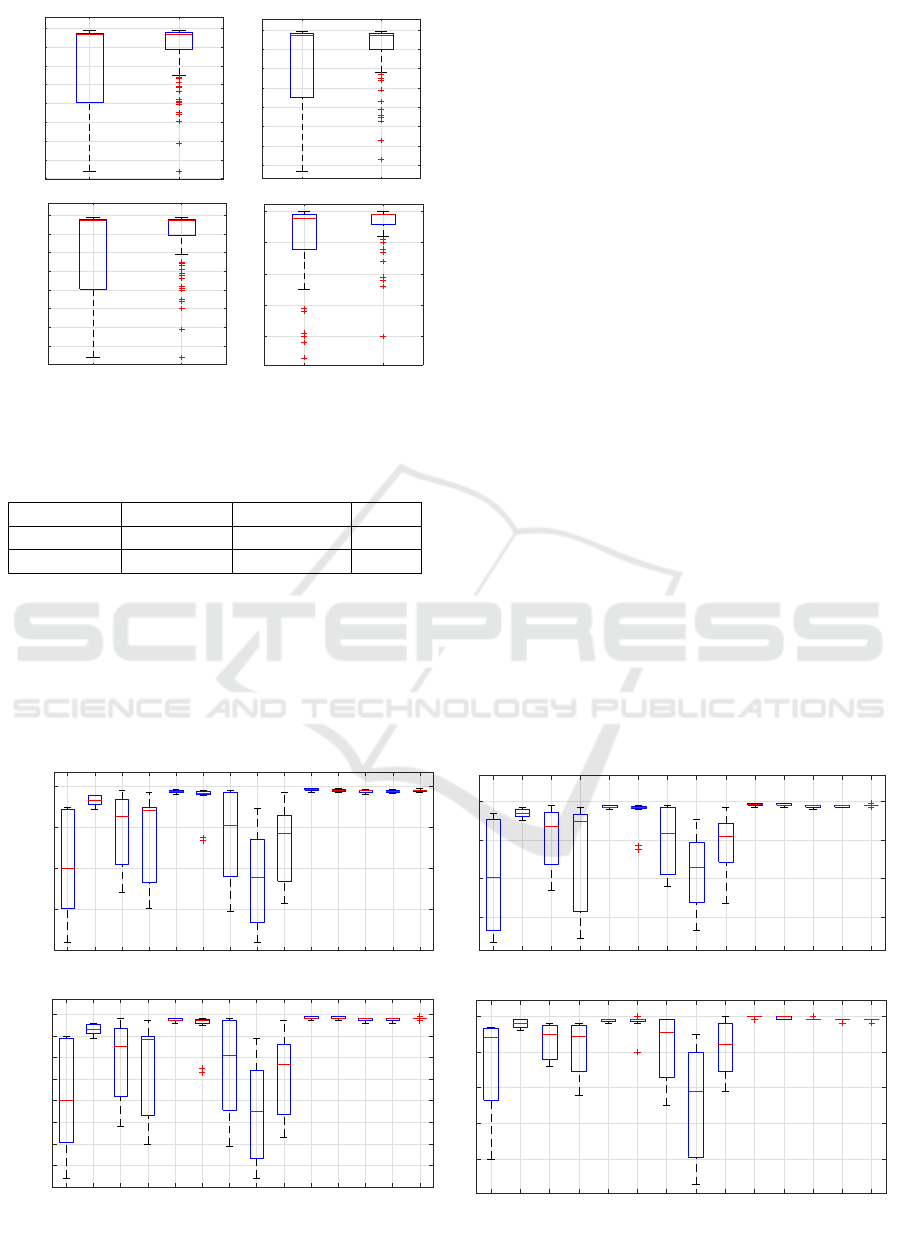
5.4 RQ4: Which ML Classifier Gives
the Best Results?
This work compares many commonly used classi-
fiers– from simple Naive Bayes and SVC classifiers
to more advanced ensemble classifiers. Overall, 14
different classifiers have been compared. In the box
plot shown in Figure 3, even among different variants
of Naive Bayes and SVC, there is a huge variation in
performance. Ensemble classifiers seem to provide
the most reliable performance with less variance. De-
cision Tree and k-Nearest Neighbors classifiers also
give robust results. To discern which classifier per-
formed best, we look at the mean ranks in the Fried-
man test in Table 5. The null hypothesis is “the dif-
ferent classifiers do not cause a significant change in
the performance of the models.” The degree of free-
dom is taken as 13 for the Friedman test. The Ex-
tra Trees classifier, with a mean rank of 1.97, outper-
forms other classifiers by a huge margin. Variants of
Naive Bayes, like multinomial, Gaussian, and com-
plement, have the highest mean ranks. Random Forest
classifier has the second lowest mean rank. The Extra
Trees classifier has a minimum AUC of 0.99, a maxi-
mum AUC of 1, and a mean AUC of 1. This indicates
that Extra Trees is the best choice for the classifier.
Ensemble classifiers, in general, seem to outperform
other types of classifiers.
6 CONCLUSION
Malware family classification is a much-researched
topic with multiple different ML and DL techniques
applied to keep up with the increasing complexity of
the problem. Due to the numerous techniques applied,
there is a lack of clarity about the ideal pipeline for
future research. In this work, we compare the various
MNBC
BNBC
GNBC
CNBC
DT
KNN
SVCL
SVCP
SVCR
EXTRC
RFC
BAGC
GRABC
ADABC
20
40
60
80
100
Accuracy
MNBC
BNBC
GNBC
CNBC
DT
KNN
SVCL
SVCP
SVCR
EXTRC
RFC
BAGC
GRABC
ADABC
0.4
0.6
0.8
1
Precision
MNBC
BNBC
GNBC
CNBC
DT
KNN
SVCL
SVCP
SVCR
EXTRC
RFC
BAGC
GRABC
ADABC
0.3
0.4
0.5
0.6
0.7
0.8
0.9
1
Recall
MNBC
BNBC
GNBC
CNBC
DT
KNN
SVCL
SVCP
SVCR
EXTRC
RFC
BAGC
GRABC
ADABC
0.6
0.7
0.8
0.9
1
AUC
Figure 3: Performance Parameters Boxplots of ML classifier.
Empirical Analysis for Investigating the Effect of Machine Learning Techniques on Malware Prediction
459

Table 5: AUC: Statistical and Friedman test results of ML classifier.
MNBC BNBC GNBC CNBC DT KNN SVCL SVCP SVCR EXTRC RFC BAGC GRABC ADABC Rank
MNBC 1.00 0.00 0.13 0.13 0.00 0.00 0.09 0.03 0.22 0.00 0.00 0.00 0.00 0.00 11.97
BNBC 0.00 1.00 0.00 0.00 0.02 0.10 0.26 0.00 0.02 0.00 0.00 0.00 0.00 0.00 7.44
GNBC 0.13 0.00 1.00 0.86 0.00 0.00 0.62 0.00 0.45 0.00 0.00 0.00 0.00 0.00 10.38
CNBC 0.13 0.00 0.86 1.00 0.00 0.00 0.48 0.00 0.95 0.00 0.00 0.00 0.00 0.00 10.72
DT 0.00 0.02 0.00 0.00 1.00 0.80 0.02 0.00 0.00 0.00 0.00 0.03 0.39 0.16 5.97
KNN 0.00 0.10 0.00 0.00 0.80 1.00 0.02 0.00 0.01 0.00 0.00 0.26 0.82 0.60 6.00
SVCL 0.09 0.26 0.62 0.48 0.02 0.02 1.00 0.00 0.82 0.00 0.00 0.00 0.00 0.00 8.91
SVCP 0.03 0.00 0.00 0.00 0.00 0.00 0.00 1.00 0.00 0.00 0.00 0.00 0.00 0.00 13.66
SVCR 0.22 0.02 0.45 0.95 0.00 0.01 0.82 0.00 1.00 0.00 0.00 0.00 0.00 0.00 9.50
EXTRC 0.00 0.00 0.00 0.00 0.00 0.00 0.00 0.00 0.00 1.00 0.14 0.00 0.00 0.00 1.97
RFC 0.00 0.00 0.00 0.00 0.00 0.00 0.00 0.00 0.00 0.14 1.00 0.00 0.00 0.00 3.06
BAGC 0.00 0.00 0.00 0.00 0.03 0.26 0.00 0.00 0.00 0.00 0.00 1.00 0.09 0.18 4.78
GRABC 0.00 0.00 0.00 0.00 0.39 0.82 0.00 0.00 0.00 0.00 0.00 0.09 1.00 0.58 5.47
ADABC 0.00 0.00 0.00 0.00 0.16 0.60 0.00 0.00 0.00 0.00 0.00 0.18 0.58 1.00 5.19
feature selection and dimensionality reduction tech-
niques and observe what impact class balancing tech-
niques have on the performance of the models. Due
to the various possible combinations of these tech-
niques, we identify the best combination and use sta-
tistical testing to support the claims made. The key
conclusions are:
• Genetic algorithm was the best technique for fea-
ture selection, and dimensionality reduction re-
gressed the performance of the models.
• Oversampling using SMOTE also regressed the
performance of the models, and better results
were obtained using the original imbalance
dataset.
• The Extra Trees classifier was by far the best clas-
sifier out of the 14 classifiers compared in this
study.
• The classifiers performed better with a One vs.
One approach to the multi-class problem than the
One vs. Rest approach.
• The performance of the best combination of the
ML techniques gave very reliable results and per-
formed extremely well on all the metrics used to
measure the performance.
This work can be extended to compare how DL tech-
niques fare against ensemble techniques. A better set
of features and class-balancing techniques can help
boost performance for the existing DL architectures.
ACKNOWLEDGEMENTS
This research is funded by TestAIng Solutions Pvt.
Ltd.
REFERENCES
Aslan,
¨
O. and Yilmaz, A. A. (2021). A new malware classi-
fication framework based on deep learning algorithms.
IEEE Access, 9:87936–87951.
Daeef, A. Y., Al-Naji, A., and Chahl, J. (2022). Features en-
gineering for malware family classification based api
call. Computers, 11(11).
Kouliaridis, V. and Kambourakis, G. (2021). A compre-
hensive survey on machine learning techniques for an-
droid malware detection. Information, 12(5).
Kwon, I. and Im, E. G. (2017). Extracting the representative
api call patterns of malware families using recurrent
neural network. In Proceedings of the International
Conference on Research in Adaptive and Convergent
Systems, RACS ’17, page 202–207, New York, NY,
USA. Association for Computing Machinery.
T
¨
urker, S. and Can, A. B. (2019). Andmfc: Android mal-
ware family classification framework. In 2019 IEEE
30th International Symposium on Personal, Indoor
and Mobile Radio Communications (PIMRC Work-
shops), pages 1–6.
Zhang, H., Xiao, X., Mercaldo, F., Ni, S., Martinelli, F., and
Sangaiah, A. K. (2019). Classification of ransomware
families with machine learning based onn-gram of op-
codes. Future Generation Computer Systems, 90:211–
221.
ENASE 2023 - 18th International Conference on Evaluation of Novel Approaches to Software Engineering
460
