
Approaches to Automatic Road Traffic Incident Detection and Incident
Forecasting
S
¨
oren Striewski
a
, Ingo Thomsen
b
and Sven Tomforde
c
Intelligent Systems, Kiel University, 24118 Kiel, Germany
Keywords:
Automatic Traffic Incident Detection, Traffic Management, Adaptive Traffic Control.
Abstract:
Traditional traffic light controllers are unable to respond to variations in traffic demand as they generally rely
on fixed-time signalisation with predefined sequences. This work presents two algorithms, one for incident de-
tection and one for congestion forecasting. The Extended California Algorithm (ECA), an incident detection
algorithm, addresses flaws in the established California Algorithm. The congestion forecast algorithm detects
occurrences when traffic exceeds the capacity of the accessible roads by comparing the present dynamic road
capacity with the anticipated future traffic flow. Both are then compared with the established California algo-
rithm.
1 INTRODUCTION
Urban road networks are characterised by signalised
intersections and the general lack of highly prioritised
roads. With rising demands, traffic management so-
lutions must make use of the current infrastructures
while enhancing signalisation. Since common traffic
light controllers (TLC) rely on fixed-time signalisa-
tion with predefined sequences, they cannot adapt to
variations in the volume of traffic.
Intelligent Traffic Management systems such as
the Organic Traffic Control system (OTC) (Tomforde,
2012) seek to maximise the traffic flow by chang-
ing the signalisation at run-time with respect to the
current traffic conditions. As OTC is founded on
the design principles of Organic Computing (Proth-
mann et al., 2011b), it has the prerequisites to be
self-organised: It can handle unexpected traffic sce-
narios while adapting to changes in its surroundings
(e.g. accidents). Previously, the OTC system was en-
hanced with a forecasting component to predict fu-
ture traffic patterns (see (Sommer et al., 2013)). With
these projections, traffic jams can be anticipated and,
in the long run, avoided. The benefits of signalisation
adaptation over merely detecting congestions include
faster reaction times, shorter travel durations, fewer
stopping vehicles, and reduced pollutant emissions.
Additionally, traffic congestion also causes stress to
a
https://orcid.org/0000-0002-5773-9266
b
https://orcid.org/0000-0002-0850-4786
c
https://orcid.org/0000-0002-5825-8915
drivers and increases the likelihood of accidents, ac-
cording to (Marchesini and Weijermars, 2010).
This work introduces two algorithms, one for inci-
dent detection and the other for congestion forecast-
ing. The Extended California Algorithm (ECA), an
incident detection algorithm, addresses flaws in the
original California Algorithms. This congestion fore-
cast algorithm evaluates occurrences when traffic ex-
ceeds the capacity of accessible roads by comparing
the present dynamic road capacity with the antici-
pated future traffic flow.
The remainder of this paper is structured as fol-
lows. Section 2 gives a brief overview of the field
of incident detection and forecasting. Section 3 in-
troduces the architecture of the OTC system and its
Automatic Incident Detection component. Section 4
explains the Enhanced California Algorithm. The in-
cident forecast algorithm is described in Section 5 and
Section 6 reports the experimental results. Section 7
concludes with a summary of the work presented and
outlines further research.
2 BACKGROUND
2.1 Incident Detection
Incident detection systems can be divided into many
categories, according to (Guin, 2004) and (Parkany
and Xie, 2005), who also evaluated and compared
the results of the various algorithms. The categories
Striewski, S., Thomsen, I. and Tomforde, S.
Approaches to Automatic Road Traffic Incident Detection and Incident Forecasting.
DOI: 10.5220/0011859200003479
In Proceedings of the 9th International Conference on Vehicle Technology and Intelligent Transport Systems (VEHITS 2023), pages 289-296
ISBN: 978-989-758-652-1; ISSN: 2184-495X
Copyright
c
2023 by SCITEPRESS – Science and Technology Publications, Lda. Under CC license (CC BY-NC-ND 4.0)
289

of smoothing algorithms, artificial intelligence algo-
rithms, and image processing algorithms are men-
tioned in addition to those identified by Guin. In his
thorough review, (ElSahly and Abdelfatah, 2022) lists
examples from these categories.
Comparative algorithms assess tracked traffic
metrics (such as volume or speed) in relation to prede-
termined thresholds. This group includes the 10 Cali-
fornia Algorithms (Payne and Tignor, 1978), of which
number 7 and 8 are the ones most applied and used
for comparison. Statistical algorithms spot deviations
from the norm in traffic patterns by employing statis-
tical methods. The measured traffic data are treated as
time series and are compared to predicted or histori-
cal data for deviations which might indicate incidents.
These traffic theory-based algorithms include e.g. the
McMaster algorithm (A.I. and Hall, 1989). Another
representative is the All-Purpose Incident Detection
(APID) (Masters et al., 1991). As extension of the
California Algorithm 7 it distinguishes between low,
medium, and high volume traffic and checks for com-
pression waves and incident persistence.
Another summary (Rao and Rao, 2012) includes
developments in measuring urban traffic congestions
globally and establishes two primary variables influ-
encing traffic congestion: micro-level (for example,
the phenomena of too many people wanting to travel
on the same road at the same time) and macro-level
factors (relating to the overall demand of road usage
such as land-use patterns or regional economic dy-
namics). The analysis revealed that there are numer-
ous alternative methods for identifying traffic jams in
urban areas. Rao also provides a summary of the com-
mon congestion measuring measures, such as speed,
trip time, delay, and volume, including counter criti-
cism of each of one of those.
2.2 Incident Forecasting
Kurihara (Kurihara, 2013) proposes an approach
based on ant colony optimisation. It uses a model of
ant behaviour and their use of pheromones for com-
munication. In order to calculate and forecast short-
term traffic congestions at one-minute intervals, in-
tersection computers (also known as “road agents”)
collect measured traffic flows from locally positioned
sensors. The the local traffic flow density is calcu-
lated and pheromones for forecasting the congestion
as well as the density are sent to neighbouring road
agents. A simulation based on a Manhattan-style road
network lead to higher accuracy in congestion fore-
casting than a more usual statistical approach em-
ployed by Balaji et al. (Balaji et al., 2007).
An incident detection technique using dynamic
time warping is proposed by Hiri-o-Tappa et al. (Hiri-
O-Tappa et al., 2007). Here, the likelihood of con-
gestion is determined using speed data from loop de-
tectors. They authors acknowledge that their strategy
falls short in terms of false alarm and time to detect.
Another approach (Huang et al., 2010) offers a
distributed traffic and congestion detection for au-
tonomous cars. Their approach focuses on wirelessly
connected intelligent vehicles that can measure the
speed of the surrounding traffic and the distance be-
tween the leading and trailing vehicles in order to de-
tect shock waves in the velocity. Their assessment
was based on a highway simulation that was put to
the test under various conditions, such as when an ac-
cident or a road merge were present.
To make short-term predictions of abrupt speed
declines, Labeeuw et al. (Labeeuw et al., 2009) com-
pared their methods to those employing Gaussian Pro-
cesses and decision trees. They used common ma-
chine learning techniques (such as the Support Vector
Machine) as reference. In their evaluation, the deci-
sion tree has the maximum correctness.
3 ORGANIC TRAFFIC CONTROL
Urban road networks typically consist of numerous
signalised intersections which are close to one an-
other. The resulting complexity of dynamic road
traffic patterns, the autonomous behaviour of traf-
fic participants, and the resulting uncertainty offer a
good application for approaches which are based on
the concept of “Organic Computing” (M
¨
uller-Schloer
and Tomforde, 2017). In earlier research, the Ob-
server/Controller architecture was used for the Or-
ganic Traffic Management system (OTC) (Prothmann
et al., 2011b), a self-improving traffic signal control
system.
The key features of this decentralised system in-
clude the capacity to adjust traffic light signalisation
in real-time based observed traffic flows, the estab-
lishment of progressive signal systems (also known as
“green waves”) by contacting adjacent intersections
(Tomforde et al., 2008), and the ability to determine
the most efficient routes to points of interest in the
network and pass on this information to drivers (e.g.
via variable message signs) (Prothmann et al., 2011a).
The number of network-wide stops and journey dura-
tions can be reduced, together with fuel consumption
and pollutant emissions.
Figure 1 outlines the multi-layer OTC architecture
which extends an existing intersection controller (IC)
of a node, the “System under Observation and Con-
VEHITS 2023 - 9th International Conference on Vehicle Technology and Intelligent Transport Systems
290
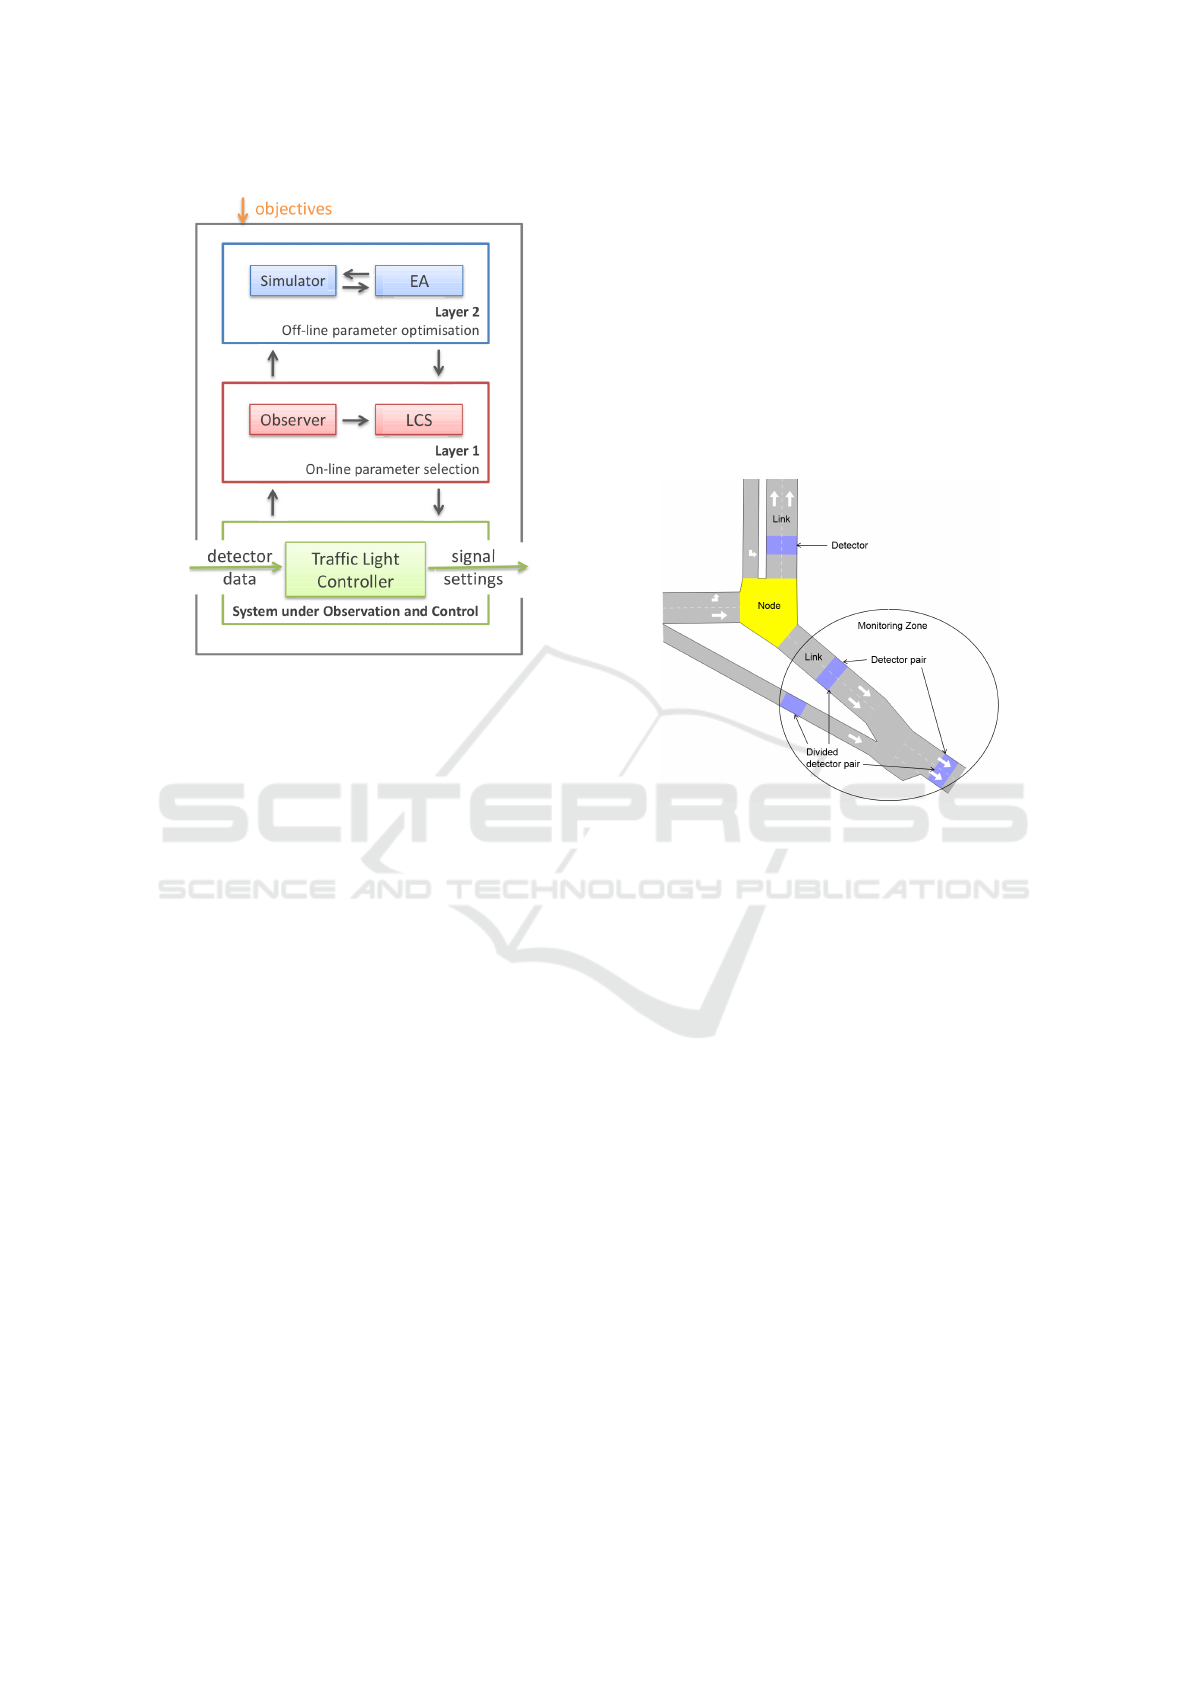
Figure 1: Architecture of the Organic Traffic Control.
trol” (SuOC). Detectors (e.g. loop detectors) measure
the current traffic flows which are handled by Layer 1.
Here, the raw data is preprocessed and combined into
a situation description of intersections which are mon-
itored. The learning classifier system (based on Wil-
son’s XCS (Butz and Wilson, 2002)) then looks for a
matching signalisation plan. In case of a match, sig-
nalisation is adapted accordingly by Layer 0.
The offline learning feature on Layer 2 is enabled
when an unknown circumstance (where no parame-
ter set is known) arises. The classifier system adds
the new signalisation plan to its knowledge base after
an evolutionary algorithm (EA) generates new signal-
isation plans, analyses them, and sends the best one
back to Layer 1. This layer then responds by exe-
cuting the best fitting signalisation, while Layer 2 ex-
amines alternative approaches. By coordinating their
signalisations, a decentralised collaboration mecha-
nism enables intersection controllers to exchange data
with nearby controllers and construct progressive sig-
nal systems.
3.1 AID Component
The Automatic Incident Detection (AID) component
of OTC is situated in the observer at layer 1. It over-
sees the initial creation of the structural components
required for detection (Fig. 2). A “link” consists of
one or more road segments and their respective detec-
tors. It connects two junctions. A detector pair con-
sists of exactly two loop detectors which are placed
20m apart on the same segment. Additionally, a di-
vided detector pair can monitor longer distances of
roadways more accurately and span branching por-
tions. The part of the network an IC can oversee is
called monitoring zone. Exactly one node is assigned
to each zone. This allows for the intersection-centric
execution of various event detection algorithms with
various parameter settings at each junction. Finally,
an online calibration component can modify param-
eters used by the algorithms according to their false
alarm and detection rates. An incident alarm raised
by the AID component has to be confirmed or marked
as a false alarm by a human expert.
Figure 2: Structural components for the AID.
3.2 Prediction Component
The prediction component on Layer 1 of the rele-
vant node forecasts the traffic flows for each inter-
section’s turning and outgoing sections. The compo-
nent consists of a number of predictors that each in-
dependently anticipate the flow during the next time
step or for a future point in time. Past traffic flows
recorded by detectors and processed and transmitted
by the monitoring component serve as the basis for
these projections. The techniques implemented for
the forecasts range from simple moving average to
more sophisticated algorithms such as the Kalman
filter (Okutani and Stephanedes, 1984) and Artifi-
cial Neural Networks as suggested in (Sommer et al.,
2013), which may rely on current traffic data as well
as historical data.
All forecasts are then combined into one compre-
hensive forecast based on the previous performance
of each predictor. Thus, the system learns to produce
algorithms with a higher accuracy (lower forecast er-
ror) as well as more influence on the combined fore-
cast. As seen in Eq. (1), the aggregated forecast is cal-
culated based on the weighted sum of the individual
forecasts F
1
to F
n
. Several approaches to define these
Approaches to Automatic Road Traffic Incident Detection and Incident Forecasting
291

weights as Simple Average (Zhang, 2012), Optimal
Weights (Bates and Granger, 2001), Outperformance
(de Menezes et al., 2000) were implemented.
ˆ
F =
w
1
× F
1
+ w
2
× F
2
+ ··· + w
n
× F
n
∑
w
i
(1)
These aggregated forecasts, along with the current
scenario from the situation analyser and the perfor-
mance analyser, are given to the situation descriptor,
which then creates a description of the situation. The
controller on Layer 1 is then informed of the situation
and uses the description to choose the ensuing signal-
isation scheme.
4 INCIDENT DETECTION
ALGORITHM: EXTENDED
CALIFORNIA ALGORITHM
The Extended California Algorithm for Arterial Envi-
ronments (ECA) aims to extend the existing Califor-
nia Algorithm (CA) whose decision tree can be seen
in Fig. 3. The nodes serve as a platform for various
experiments in which traffic-related data is compared
to predetermined thresholds. Collecting the upstream
and downstream occupancy data requires two detec-
tor pairs on the same network. The occupancy of the
two detector pair differences are calculated in the al-
gorithm’s initial test. The second test is run when it
reaches a specific threshold T1.
The relative difference in percentage between the
prior occupancies is determined by this test. The
last test is conducted if the discrepancy exceeds the
T2 threshold. This distinguishes between incidents
and traffic jams which produce comparable traffic
patterns. Here, the relative temporal difference of
the downstream detector’s occupancy values is com-
puted. An incident alarm is raised if the outcome ex-
ceeds the T3 threshold. It is assumed that no incident
is present. Usually the algorithm is run every 20 to 60
seconds.
The CA performs well, is simple to comprehend,
and is expandable. Furthermore, it frequently out-
performs more advanced methods, even today. How-
ever, because it was designed for incident detection on
highways, it has a number of drawbacks, particularly
for arterial routes. This can be further explained and
solved by the ECA. Given that the downstream occu-
pancy is lower than the upstream occupancy, traffic
departing on side roads in the vicinity of two detector
pairs may lead in more false alarms. A downstream
occupancy increase caused by an approaching road
Figure 3: State tree of the California Algorithm.
between two detector pairs consequently lowers the
detection rate.
These characteristics, along with signalisation
phase impacts, cause occupant values to fluctuate
rapidly. Due to the brevity of the false alerts and
in particular during periods of low traffic, the occur-
rences reported by the CA are very certainly false
alarms. Finally, because it was created for incident
detection on links, the CA is unable to identify oc-
currences on junctions. These short-comings are ad-
dressed by the ECA:
• Side road check: Consider incoming and outgoing
side roads.
• Incident persistence check: Buffer incident
alarms and report only those which occur again
in the next check.
• Traffic condition check: Introduction of a silent
mode during low traffic situations. Traffic data
is still recorded, but no incident detection alarms
will be forwarded.
• Junction monitoring: Extension of the CA to de-
tect incidents on junctions.
As seen in Fig. 4, the ECA extends the decision
tree of the CA with further states. The first state ex-
amines the sudden drop in traffic flow, which is usu-
ally indicative of an accident. The second state is en-
tered if the drop exceeds or is equal to a threshold.
Based on the occupancy difference, this state seeks to
prevent false alarms caused by low traffic density. The
final state checks for a persistent drop in occupancy
during an incident. In case of an positive response, an
incident alert is set off. To achieve higher accuracy,
this final test may be repeated for greater assurance at
the expense of additional detection time.
VEHITS 2023 - 9th International Conference on Vehicle Technology and Intelligent Transport Systems
292

Figure 4: State tree of the ECA.
5 AUTOMATIC INCIDENT
FORECASTING: SUPPORT
VECTOR MACHINE
The limitation of incident detection is that it can only
identify an incident or a congestion if they are already
there. Because congestion is unwanted, it would be
desirable to foresee impending interruptions in the
traffic flow. To this end, an algorithm for the forecast-
ing of traffic jams was created. It relies on short-term
traffic flow projections and the dynamic estimation of
road capacities. The theory behind this method is that
congestions can be anticipated if the current traffic
flow exceeds the capacity of the road. In case of a
bottleneck, it is assumed that the incident has ended
once the flow increases again. This is depicted in in
Fig. 5.
Figure 5: Concept of the incident forecast algorithm.
5.1 Dynamic Capacity Calculation
The dynamic calculation of the capacity of a section
follows the formula provided by the U.S. Department
of Transportation (FHWA (Federal Highway Admin-
istration), 2010) which takes into consideration e.g.
the current speed limit, the number of lanes and the
percentual ratio of heavy vehicles. This formula dis-
tinguishes between highway and urban roads, based
on the speed limit. Equation (2) depicts the formula
for the dynamic capacity calculation in urban areas
where S
0
is the base flow rate, N is the number of
lanes, f
w
is a factor for the lane width, F
HV
is the fac-
tor for heavy vehicles, f
p
is an adjustment factor for
parking activities, f
a
is an adjustment factor for the
area type and PHF is the peak hour factor. Thus, a
closed lane or a higher ratio of heavy vehicles will
lead to a lower capacity.
cap = S
0
∗ N ∗ f
w
∗ f
HV
∗ f
p
∗ f
a
∗ PHF (2)
5.2 Incident Forecast Algorithm
The developed incident forecast algorithm follows the
idea of state-based algorithms. Its decision tree is de-
picted in Fig. 6. State 0 stands for “incident free”,
state 1 for “tentative incident”, state 2 for “incident
confirmed” and state 3 for “incident continuing”.
As before, C
t
holds the occupancy value of a de-
tector, f low
t+∆t
is the traffic flow forecast at ∆t steps
into the future and i is the time until the next algo-
rithm execution. In an “incident free” state, the fore-
casted flow is compared to the dynamic capacity: If
the forecast is higher, the current state is switched to
“tentative incident”. In the next iteration, the algo-
rithm evaluates the left side of the decision tree, run-
ning the same test again; in case of positive feedback,
the state is changed to “incident confirmed”. Finally,
the lower left state is executed, which checks if the
forecasts are again lower than the dynamic capacity
and subsequently raise once more. If this is true, we
assume that the incident is dissolving. Otherwise, the
incident is continuing.
Figure 6: Decision tree of the AID forecast algorithm.
Approaches to Automatic Road Traffic Incident Detection and Incident Forecasting
293

6 EVALUATION
The evaluation was conducted using the OTC soft-
ware with its AID capabilities together with “Aimsun
Next 22.0” (Aimsun, 2022), a professional traffic sim-
ulator employed in the field of traffic engineering. It
was used to simulate parts of a real-world network.
6.1 Network Model
Figure 7 depicts the simulated roads of an urban net-
work in Hamburg, Germany. It consists of 10 junc-
tions which are each equipped with a fixed-time TLC.
The simulated traffic demand is based on traffic states
which describe the hourly flow per road. Here, a
work-day morning from 6:00 to 12:00 is modelled,
to emulate a rush-hour with a varying and increased
traffic demand of 62840 vehicles per hour. The inci-
dents simulated for the evaluation are located on the
section from junction K5 to junction K10 (see Fig. 8).
As K10 is not controlled by a TLC, the monitoring
zone according to Section 3.1 encompasses the links
with all sections from K5 westward to K6.
Figure 7: The simulated part of the road network in Billst-
edt, an urban district of Hamburg, Germany.
6.2 Experiments
Metrics such as the detection rate (DR), the false
alarm rate (FAR) and the average time to detection
(ATTD) were used for the evaluation:
DR =
Number of detected incidents
Real number of incidents
(3)
FAR =
Number of false alarms
Number of reported incidents
(4)
AT T D =
1
n
n
∑
i=1
t
i
detection
−t
i
occurence
(5)
The ATTD is the average over the sum of the
differences between the detection time and the real
starting time of the incident. FAR and DR are met-
rics which measure the effectiveness of an algorithm,
whereas ATTD reflects the efficiency of an algorithm.
To emulate typical situations, these metrics are ap-
plied in the context of two experimental scenarios:
1. “Section closure”: Sudden blockage of a whole
section, by closing all lanes for 20m at some loca-
tion within the section.
2. “Partial lane closure”: Sudden blockage of one or
more lanes of a section (but not all), again not for
the whole section length, but for 20m
Every hour (starting with 7:00–7:15), the inci-
dents are each simulated at the 4 different loca-
tions depicted in Fig. 8. With varying random seeds
these simulations are each repeated 5 times to obtain
pseudo-randomised replications. Finally, this is done
for each of the algorithms.
6.3 Results
The overall goal is to increase FAR and ATTD while
increasing DR. Unfortunately, these goals interfere
with each other. A higher DR comes a the price of
a higher FAR while a reduced DR leads to a lower
FAR. The tuning of the parameters (time between
algorithm executions, specific configuration parame-
ters, etc.) of each incident detection algorithm is im-
portant to achieve a good performance.
For the first scenario, Table 1 outlines some find-
ings. The California 7 algorithm has difficulties to
detect the fairly pronounced effects of the section clo-
sures of this setting and reports false alarms (mainly
due to false locations). California 8 fares better due to
its analysis of compression waves. The detection for
both is quick. The ECA is slower, but shows no prob-
lems concerning correct detections or false alarms.
This is valid for the faster forecast algorithm.
Table 1: Results of the first scenario “section closures” as
means over 5 replications.
DR FAR ATTD [s]
California 7 50% 70% 60
California 8 100% 33% 60
ECA 100% 0% 120
Forecast 100% 0% 72
In the second scenario (Table 2), the overall de-
tection declines. This is somewhat expected as the
traffic flow in sections with single-lane incidents is
not substantially different from free-flowing condi-
tions. Still, all algorithms detect some incidents cor-
VEHITS 2023 - 9th International Conference on Vehicle Technology and Intelligent Transport Systems
294

Figure 8: Part of the network in Fig. 7 which features the simulated detector pairs A,B and C,D as well as E,F. The locations
of the simulated incidents are labelled a, b, c and d.
rectly, although with low detection rates and in the
case of the California algorithms, which also show
high false positive rates. Again, the forecast algorithm
performs better in terms of detection, although it takes
the longest.
Table 2: Results of the first scenario “partial lane closures”
as means over 5 replications.
DR FAR ATTD [s]
California 7 20% 40% 192
California 8 25% 80% 135
ECA 20% 0% 210
Forecast 75% 0% 242
7 CONCLUSION
In this paper, two algorithms for the detection and pre-
diction of incidents were presented. The Enhanced
California algorithm was evaluated for different sce-
narios and performed better when compared with the
other California Algorithm 7 and 8 algorithms. For
the less pronounced congestions of partial lane clo-
sure, the capacity-based forecast algorithm outper-
forms the others, as they show insufficient detection
rates. Future work could include extended test sce-
narios with additional types of incidents and traffic
demands to consolidate these findings.
Further research aims to use the incident informa-
tion in the routing component of the OTC. It would
then be able to issue optimised routing recommen-
dations for the drivers to prevent congestions and
to accelerate the breakup of the congestion. An
incident-aware adaptation of the traffic light signalisa-
tion could also benefit the overall goal of a proactive
prevention of congestion.
REFERENCES
A.I., G. and Hall, F. (1989). Distinguishing between inci-
dent congestion and recurrent congestion: A proposed
logic. Transportation Research Record 1232, pages
1–8.
Aimsun (2022). Aimsun Next 22 User’s Manual. Barcelona,
Spain, Aimsun Next 22.0.1 edition.
Balaji, P. G., Sachdeva, G., Srinivasan, D., and Tham, C.-K.
(2007). Multi-agent system based urban traffic man-
agement. IEEE Congress on Evolutionary Computa-
tion, pages 1740 – 1747.
Bates, J. M. and Granger, C. W. J. (2001). The Combination
of Forecasts, page 391–410. Cambridge University
Press, USA.
Butz, M. and Wilson, S. (2002). An algorithmic description
of XCS. Soft Computing - A Fusion of Foundations,
Methodologies and Applications, 6:144 – 153.
de Menezes, L. M., Bunn, D. W., and Taylor, J. W. (2000).
Review of guidelines for the use of combined fore-
casts. European Journal of Operational Research,
120(1):190–204.
ElSahly, O. and Abdelfatah, A. (2022). A systematic review
of traffic incident detection algorithms. Sustainability,
14(22).
FHWA (Federal Highway Administration) (2010). High-
way performance monitoring system field manual.
Guin, A. (2004). An Incident Detection Algorithm based on
a Discrete State Propagation Model of Traffic Flow.
PhD thesis, Georgia Institute of Technology.
Hiri-O-Tappa, K., Narupiti, S., Pan-Ngum, S., and Pattara-
Atikom, W. (2007). Development of real-time short-
term traffic congestion prediction method. Journal of
Society for Transportation and Traffic Studies, 2.
Huang, D., Shere, S., and Ahn, S. (2010). Dynamic high-
way congestion detection and prediction based on
shock waves. In Proc. of Inte. Works. on Veh. Inter-
NETworking, VANET ’10, pages 11–20, New York,
NY, USA. ACM.
Kurihara, S. (2013). Traffic-congestion forecasting algo-
rithm based on pheromone communication model. In
Approaches to Automatic Road Traffic Incident Detection and Incident Forecasting
295

Barbosa, H. J., editor, Ant Colony Optimization, chap-
ter 7. IntechOpen, Rijeka.
Labeeuw, W., Driessens, K., Weyns, D., Holvoet, T., and
Deconinck, G. (2009). Prediction of Congested Traffic
on the Critical Density Point Using Machine Learning
and Decentralised Collaborating Cameras. In Proc. of
EPIA’09, pages 15–26. Universidade de Aveiro.
Marchesini, P. and Weijermars, W. A. M. (2010). The re-
lationship between road safety and congestion on mo-
torways. SWOV Institute for Road Safety Research
Leidschendam.
Masters, P., Lam, J., and Wong, K. (1991). Incident de-
tection algorithms for compass - an advanced traffic
management system. In Vehicle Navigation and In-
formation Systems Conference, 1991, volume 2, pages
295–310.
M
¨
uller-Schloer, C. and Tomforde, S. (2017). Organic Com-
puting - Technical Systems for Survival in the Real
World. Birkh
¨
auser.
Okutani, I. and Stephanedes, Y. J. (1984). Dynamic pre-
diction of traffic volume through kalman filtering the-
ory. Transportation Research Part B: Methodological,
18(1):1–11.
Parkany, E. and Xie, P. C. (2005). A complete review of in-
cident detection algorithms & their deployment: What
works and what doesn’t. Technical report, Fall River,
MA: New England Transp. Consortium.
Payne, H. and Tignor, S. (1978). Freeway incident-
detection algorithms based on decision trees with
states. Transportation Research Record, No. 682,
pages 30–37.
Prothmann, H., Schmeck, H., Tomforde, S., Lyda, J.,
H
¨
ahner, J., M
¨
uller-Schloer, C., and Branke, J. (2011a).
Decentralised route guidance in organic traffic con-
trol. In Proc. of SASO 2011, pages 219–220. IEEE
Computer Society.
Prothmann, H., Tomforde, S., Branke, J., H
¨
ahner, J.,
M
¨
uller-Schloer, C., and Schmeck, H. (2011b). Or-
ganic traffic control. In Organic Computing – A
Paradigm Shift for Complex Systems, chapter 5.1,
pages 431–446. Birkh
¨
auser Verlag.
Rao, A. M. and Rao, K. (2012). Measuring urban traffic
congestion – a review. Int. J. for Traffic and Transport
Engineering, 2(4):286–305.
Sommer, M., Tomforde, S., and H
¨
ahner, J. (2013). Using
a neural network for forecasting in an organic traffic
control management system. In Proc. of ESOS ’13.
Tomforde, S. (2012). Runtime adaptation of tech-
nical systems: An architectural framework for
self-configuration and self-improvement at runtime.
S
¨
udwestdeutscher Verlag f
¨
ur Hochschulschriften.
Tomforde, S., Prothmann, H., Rochner, F., Branke, J.,
H
¨
ahner, J., M
¨
uller-Schloer, C., and Schmeck, H.
(2008). Decentralised progressive signal systems for
organic traffic control. In Proc. of SASO 2008, pages
413–422. IEEE Computer Society.
Zhang, Y. (2012). How to provide accurate and robust traf-
fic forecasts practically? In Abdel-Rahim, A., edi-
tor, Intelligent Transportation Systems, chapter 8. In-
techOpen, Rijeka.
VEHITS 2023 - 9th International Conference on Vehicle Technology and Intelligent Transport Systems
296
