
A Comparison of Source Code Representation Methods to Predict
Vulnerability Inducing Code Changes
Rusen Halepmollası
1,2 a
, Khadija Hanifi
3 b
, Ramin F. Fouladi
3 c
and Ayse Tosun
1 d
1
Istanbul Technical University, Istanbul, Turkey
2
T
¨
UB
˙
ITAK Informatics and Information Security Research Center, Kocaeli, Turkey
3
Ericsson Security Research, Istanbul, Turkey
fi
Keywords:
Software Vulnerabilities, Software Metrics, Embeddings, Abstract Syntax Tree.
Abstract:
Vulnerability prediction is a data-driven process that utilizes previous vulnerability records and their associated
fixes in software development projects. Vulnerability records are rarely observed compared to other defects,
even in large projects, and are usually not directly linked to the related code changes in the bug tracking sys-
tem. Thus, preparing a vulnerability dataset and building a predicting model is quite challenging. There exist
many studies proposing software metrics-based or embedding/token-based approaches to predict software vul-
nerabilities over code changes. In this study, we aim to compare the performance of two different approaches
in predicting code changes that induce vulnerabilities. While the first approach is based on an aggregation
of software metrics, the second approach is based on embedding representation of the source code using an
Abstract Syntax Tree and skip-gram techniques. We employed Deep Learning and popular Machine Learning
algorithms to predict vulnerability-inducing code changes. We report our empirical analysis over code changes
on the publicly available SmartSHARK dataset that we extended by adding real vulnerability data. Software
metrics-based code representation method shows a better classification performance than embedding-based
code representation method in terms of recall, precision and F1-Score.
1 INTRODUCTION
Software security is a significant characteristic of
software quality (ISO, 2011). Software profession-
als monitor and check potential attacks on software
systems after development with the help of detection
systems and testing approaches. Still, it is practically
more useful and easier to maintain vulnerability-free
software systems that are designed and built consider-
ing security practices (McGraw, 2006). Software vul-
nerabilities are weaknesses in the protection effort of
an asset in a system that an attacker can exploit to gain
access to a computer system and negatively affect its
security (McGraw, 2008). Although vulnerabilities
are rarely observed compared to other software de-
fects, they are inevitable for some software systems
and require more effort to address. Therefore, it is
critical to detect and mitigate risks of vulnerabilities
a
https://orcid.org/0000-0002-9941-2712
b
https://orcid.org/0000-0001-7044-3315
c
https://orcid.org/0000-0003-4142-1293
d
https://orcid.org/0000-0003-1859-7872
in the early stage of the life cycle before a software
system is released (McGraw, 2006).
Building a vulnerability prediction model is a
data-driven process that utilizes historical vulnerabil-
ity data to classify vulnerable modules at different
granularity levels. However, extracting real vulnera-
bility data is challenging as vulnerabilities are usually
not directly linked to the related bug reports or as-
sociated code changes. Except for studies in which
curated labels for vulnerabilities are manually gen-
erated by security experts (S¸ahin et al., 2022), there
are also studies that use static code analyzers (Scan-
dariato et al., 2014) or synthetic vulnerability data
(Ghaffarian and Shahriari, 2021) to evaluate the per-
formance of vulnerability prediction models. Fur-
thermore, previous studies study at different granu-
larity levels, such as file-component level (Shin and
Williams, 2013), release level (Smith and Williams,
2011), or function/method level (Cao et al., 2020;
Chakraborty et al., 2021). Although method level is
the lowest granularity that pinpoints the location, it
can produce many false positives. File level can also
be too big to cover if files are large in size.
Halepmollası, R., Hanifi, K., Fouladi, R. and Tosun, A.
A Comparison of Source Code Representation Methods to Predict Vulnerability Inducing Code Changes.
DOI: 10.5220/0011859300003464
In Proceedings of the 18th International Conference on Evaluation of Novel Approaches to Software Engineering (ENASE 2023), pages 469-478
ISBN: 978-989-758-647-7; ISSN: 2184-4895
Copyright
c
2023 by SCITEPRESS – Science and Technology Publications, Lda. Under CC license (CC BY-NC-ND 4.0)
469

In this study, we employ various ML and DL al-
gorithms to classify vulnerable code changes of sev-
eral projects with real vulnerability data, and compare
two different source code representations in predic-
tion. We identify our research question as follows: To
what extent do different kinds of source code represen-
tations predict vulnerability inducing code changes?
The contributions of our study are summarized as fol-
lows:
• We utilize two different source code representa-
tion techniques that are software metrics and AST
based embeddings to compare their effects on pre-
dicting vulnerable code changes.
• We use SmartSHARK dataset(Trautsch et al.,
2021) that is quite comprehensive in terms of
commits and software metrics. However, the
dataset does not contain the projects’ vulnera-
bilities. We mined vulnerabilities from National
Vulnerability Database (NVD)
1
and linked them
to their associated fixing commits from project-
specific issue tracking systems. We also identified
vulnerability-inducing changes using SZZ. Even-
tually, we propose an extended SmartSHARK in
terms of reported vulnerabilities.
• We perform predictions at code change-level in-
stead of file-component or method level, as it
gives instant feedback. The proposed method can
analyse code changes and predict vulnerabilities
after each commit. With this model, we contin-
uously check only code changes, thus, the com-
plexity and the analysing time are reduced.
2 RELATED WORK
To predict vulnerabilities through source code re-
quires some kind of modeling of the code, either in
the form of metrics, or other (token, embedding or
graphical) representations. Traditional software met-
rics such as size, complexity, coupling, code churn,
and fault history are widely used to predict software
defects and results in promising performance (Li and
Shao, 2019; Tosun and Bener, 2009). Several studies
also investigate the use of software metrics for vul-
nerability prediction: Shin and Williams (Shin and
Williams, 2008) investigate the validity of a hypothe-
sis that asserts software complexity is the enemy of
software security. They explore the usage of nine
different complexity metrics, commonly utilized in
software defect prediction, to predict security issues.
Their analysis on Mozilla JavaScript Engine to iden-
tify vulnerability-prone code parts report that those
1
National Vulnerability Database. https://nvd.nist.gov
nine metrics have a weak correlation with vulnerabil-
ities. Later, Shin and Williams (Shin and Williams,
2013) also validate the aforementioned hypothesis.
They observe that the correlations between complex-
ity metrics and vulnerabilities are weak but statisti-
cally significant.
Chowdhury and Zulkernine (Chowdhury and
Zulkernine, 2011) investigate whether code complex-
ity, coupling and cohesion, i.e., structural metrics, can
be used for vulnerability prediction. They built vari-
ous classifiers using these metrics for 52 Mozilla Fire-
fox releases, and conclude that structural metrics are
useful to predict vulnerabilities.
With the growing success of natural language
processing models, text-mining-based methods have
emerged as an alternative approach for extracting
source code features. Alon et al. (Alon et al., 2019)
propose code2vec as a neural network-based model
to represent source code as a continuous distributed
vector. First, the Abstract Syntax Tree (AST) of the
code is broken down into a set of paths, and then, the
method learns the atomic representation of each path
while trying to aggregate them as a set. Lozoya et
al. (Lozoya et al., 2021) propose a code embedding
technique called comit2vec, based on code2vec. In-
stead of embedding representation of the code itself,
this technique focuses on code change representation
to classify security-relevant commits.
Furthermore, word embedding techniques have
also been used to transfer the source code into the nu-
merical vector. Harer et al. (Harer et al., 2018) gener-
ated popular word2vec embeddings for C/C++ tokens
and utilized these for vulnerability prediction. Henkel
et al. (Henkel et al., 2018) applied the GloVe model
to extract word embeddings from the AST of the C
source code. Fang et al. (Fang et al., 2020) propose
the FastEmbed technique for vulnerability prediction
based on an ensemble of ML models.
Hanifi et al. (Hanifi et al., 2023) proposed 1D
CNN based method for vulnerability prediction on
function level. While preserving the structural and
semantic information in the source code, the method
transforms the AST of the source code into a numer-
ical vector. Sahin et al. (S¸ahin et al., 2022) pro-
pose a vulnerability prediction model using different
code representations to explore whether a function at
a specific code change is vulnerable or not. They
represent the function versions as node embeddings
learned from their AST, and build models using two
Graph Neural Networks with node embeddings and
Convolutional Neural Network (CNN) and Support
Vector Machine (SVM) with token representations.
Moreover, there exist studies that compare the per-
formance of software metrics-based and text mining-
ENASE 2023 - 18th International Conference on Evaluation of Novel Approaches to Software Engineering
470

based vulnerability prediction models. In an early
study, two kinds of vulnerability prediction mod-
els are proposed using text mining based and soft-
ware metrics on PHP web applications (Walden et al.,
2014). Also, Kalouptsoglou et al.(Kalouptsoglou
et al., 2022) trained an ensemble model using soft-
ware metrics and Bag of Words (BoW) to detect vul-
nerabilities in JavaScript codes. According to these
studies, text mining-based models outperform soft-
ware metrics-based models. Although our aim is
similar, we differ from these studies in terms of ap-
plied source code representation techniques (BoW vs
deep learning based embeddings) and software met-
rics (static vs structural metrics). Additionally, both
studies report at function level whereas we predict at
code change level.
3 DATASET
To perform empirical analysis, we utilize the
SmartSHARK dataset MongoDB Release 2.1
2
.
SmartSHARK enables to conduct a comprehensive
empirical study and consists of 77 projects belong-
ing to Apache Software Foundation repository which
is a well-known ecosystem developed in Java. In
the dataset, the projects include between 1,000 and
20,000 commits. SmartSHARK contains 47,303
pull requests, 163,057 issues, and 366,322 commits.
Moreover, it has data including refactoring activities,
developer information, code changes, clone instance,
and bug-fixing activities.
The size of the complete dataset stored in Mon-
goDB is 1.2 TB and some of which is not relevant
to our study. Therefore, we created custom Mon-
goDB scripts in the source dataset and converted out-
put from bson format to csv format for analysis. We
first determined the collections we need to use. We
extracted commit collection to generate the labelled
data and project and vcs system collections to fil-
ter the projects we determined. We also extracted
code group state collection, which contains the re-
sults of the static analysis run on the repository at
each commit, to use in the software metrics-based ap-
proach. When obtaining the issue tracking data of the
projects, we extracted issue collection that contains
the data about the issue itself and issue system collec-
tion that stores the issue tracking system id.
We extracted the changed files in each project’s
commits using git commands and parsed those to fil-
ter the changed Java files as selected projects were
developed in Java language. Also, we filtered out the
2
https://SmartSHARK.github.io/dbreleases/
merged commits during the analysis as they have two
parent commits and those commits could lead us to
compute the same metric twice.
3.1 Creating the Vulnerability Dataset
To create a suitable dataset for building vulnerability
prediction models, we applied the following steps:
Extracting the Vulnerability Information.
SmartSHARK dataset does not include the vul-
nerabilities of projects. Therefore, we extended
the dataset by adding the vulnerabilities and their
associated fixing commits. To this end, we manually
curated the real vulnerability dataset that consists of
vulnerabilities analyzed from NVD for 77 projects.
Vulnerabilities published in NVD are indexed ac-
cording to Common Vulnerabilities and Exposures
Identifier (CVE ID). After extracting all the CVE
IDs, we filtered four projects, namely, Active-MQ,
Nifi, Struts, and Tika. Including projects with a few
real vulnerability data in the analysis can make the
dataset more imbalanced. Thus, we selected the
projects with the largest number of real vulnerability
data. The filtered dataset includes 154 vulnerability
reports as of Nov 2021.
Linking Vulnerabilities to Commits. It is a criti-
cal and toilsome problem to link vulnerabilities with
classes or packages of the source code of the de-
veloped software project as software organizations
usually do not well-report those (Croft et al., 2022).
Moreover, Apache Software projects do not often
have specific templates for security advisories, and
vulnerability description reports may not contain ref-
erences to CVE ID details. Therefore, we manu-
ally linked vulnerabilities, which were obtained from
NVD, with the fixing commits, which were obtained
from project-specific web resources and projects’ is-
sue tracking systems. In other words, we review the
available information for each vulnerability and try to
find the associated fix commit(s) in the issue tracking
system for the impacted open-source component. As
a result of this pursuit, we identified 75 commits for
which vulnerability records were fixed. Furthermore,
we utilized the MSR2019 dataset (Ponta et al., 2019)
as the ground truth and validated the correctness of
our mapping.
Extracting Vulnerability Inducing Commits. Af-
ter vulnerabilities are linked to their fixing commits,
we obtained commits in which these vulnerabilities
A Comparison of Source Code Representation Methods to Predict Vulnerability Inducing Code Changes
471

Table 1: Descriptive statistics for the projects.
Projects Commits Inducing Commits Fixing Commits Unique CWE ID Time Period
Tika 4,933 17 9 3 31/03/07-09/07/18
Nifi 5,376 24 7 6 09/12/14-24/10/18
Struts 6,092 100 35 38 23/03/06-03/06/18
ActiveMQ 12,523 261 24 18 12/12/05-03/12/20
were induced in order to build a vulnerability predic-
tion model. To this end, we performed the SZZ al-
gorithm that is widely used for identifying bug induc-
ing changes(
´
Sliwerski et al., 2005; Sahal and Tosun,
2018). SZZ algorithm analyzes the bug-fixing com-
mits, i.e., commits in which a bug reported on an is-
sue tracking system is fixed, to trace back to their bug-
inducing commits, i.e., commits that include the code
changes inducing a bug into the system. We matched
75 out of 154 vulnerability fixing commits with 402
vulnerability inducing commits. Table 1 is a summary
of the collected vulnerability dataset.
4 METHODOLOGY
In this section, as illustrated in Figure 1, we report our
experimental steps for learning source code represen-
tations and training vulnerability prediction models.
We refer to Software Metric Based Code Representa-
tion as Approach1 and Embedding Based Code Rep-
resentation as Approach2.
4.1 Source Code Representation
Considering that the features used to train the classi-
fication model have an essential effect on the classi-
fication performance, we employed different feature
extraction techniques and compared their outcomes.
We considered two feature types both of which are
extracted from the projects’ source codes: (i)software
metric-based, (ii)code embedding-based.
4.1.1 Metric Based Code Representation
We leverage software metrics, which are provided in
SmartSHARK dataset, to understand and explore the
impact of the metrics on vulnerability prediction. In
other words, we investigate the ability of various de-
fect prediction metrics to be used in vulnerability pre-
diction. We utilized complexity, coverage, and depen-
dency metrics of the projects for predicting real vul-
nerabilities. SmartSHARK dataset utilizes OpenStat-
icAnalizer as part of a plugin for the SmartSHARK
infrastructure in conjunction with an HPC-Cluster to
obtain the metrics for each file in each commit of a
project. OpenStaticAnaylzer is an open-sourced ver-
sion of the commercial tool SourceMeter that perform
deep static program analysis of the source code of
projects by constructing an Abstract Semantic Graph
(ASG) from the source code to calculate the code met-
rics. The summary of the metrics is shown in Table 2.
For detailed descriptions of the computed metrics, we
refer to the websites and user guides of the tools. Un-
fortunately, the documentation of tools, libraries and
API descriptions of tools published by researchers are
insufficient. Thus we cannot provide a fully detailed
description or long forms of abbreviations.
Table 2: The categorization of software metrics.
Category SourceMeter Metrics
Coupling TNOI, NF, TNF,NIR, NOR
Documentation
CD, CLOC, DLOC,TCD,
TCLOC, TDLOC
Complexity NL, NLE, McCC
Size
LLOC, LOC, NOS,NUMPAR,
TLLOC,TLOC,TNOS, TNPC,
TNSR,NNC, TNNC, NDS, TNDS
Source-meter proposes the software metrics at
various granularities such as method level, file level,
package level. We aggregated the metrics from the
file level to the commit level in the dataset to com-
pare against the embedding based code representation
and to predict vulnerability-inducing code changes.
In other words, our model is at commit level indicat-
ing that many files exist in a single commit and their
metrics must be somehow aggregated to represent the
code quality at commit level. We investigated various
aggregation techniques (Dixit and Kumar, 2018) and
decided to use the following aggregation approach:
Over all files in a single commit, we take the sum,
mean, median, and standard deviation of each metric
and generate in total of 324 metrics for each commit.
4.1.2 Embedding Based Code Representation
To extract embedding features, we utilized natural
language processing techniques. Nevertheless, since
the structure of source code varies from ordinary
texts, we transform the source code into its AST. Sub-
ENASE 2023 - 18th International Conference on Evaluation of Novel Approaches to Software Engineering
472
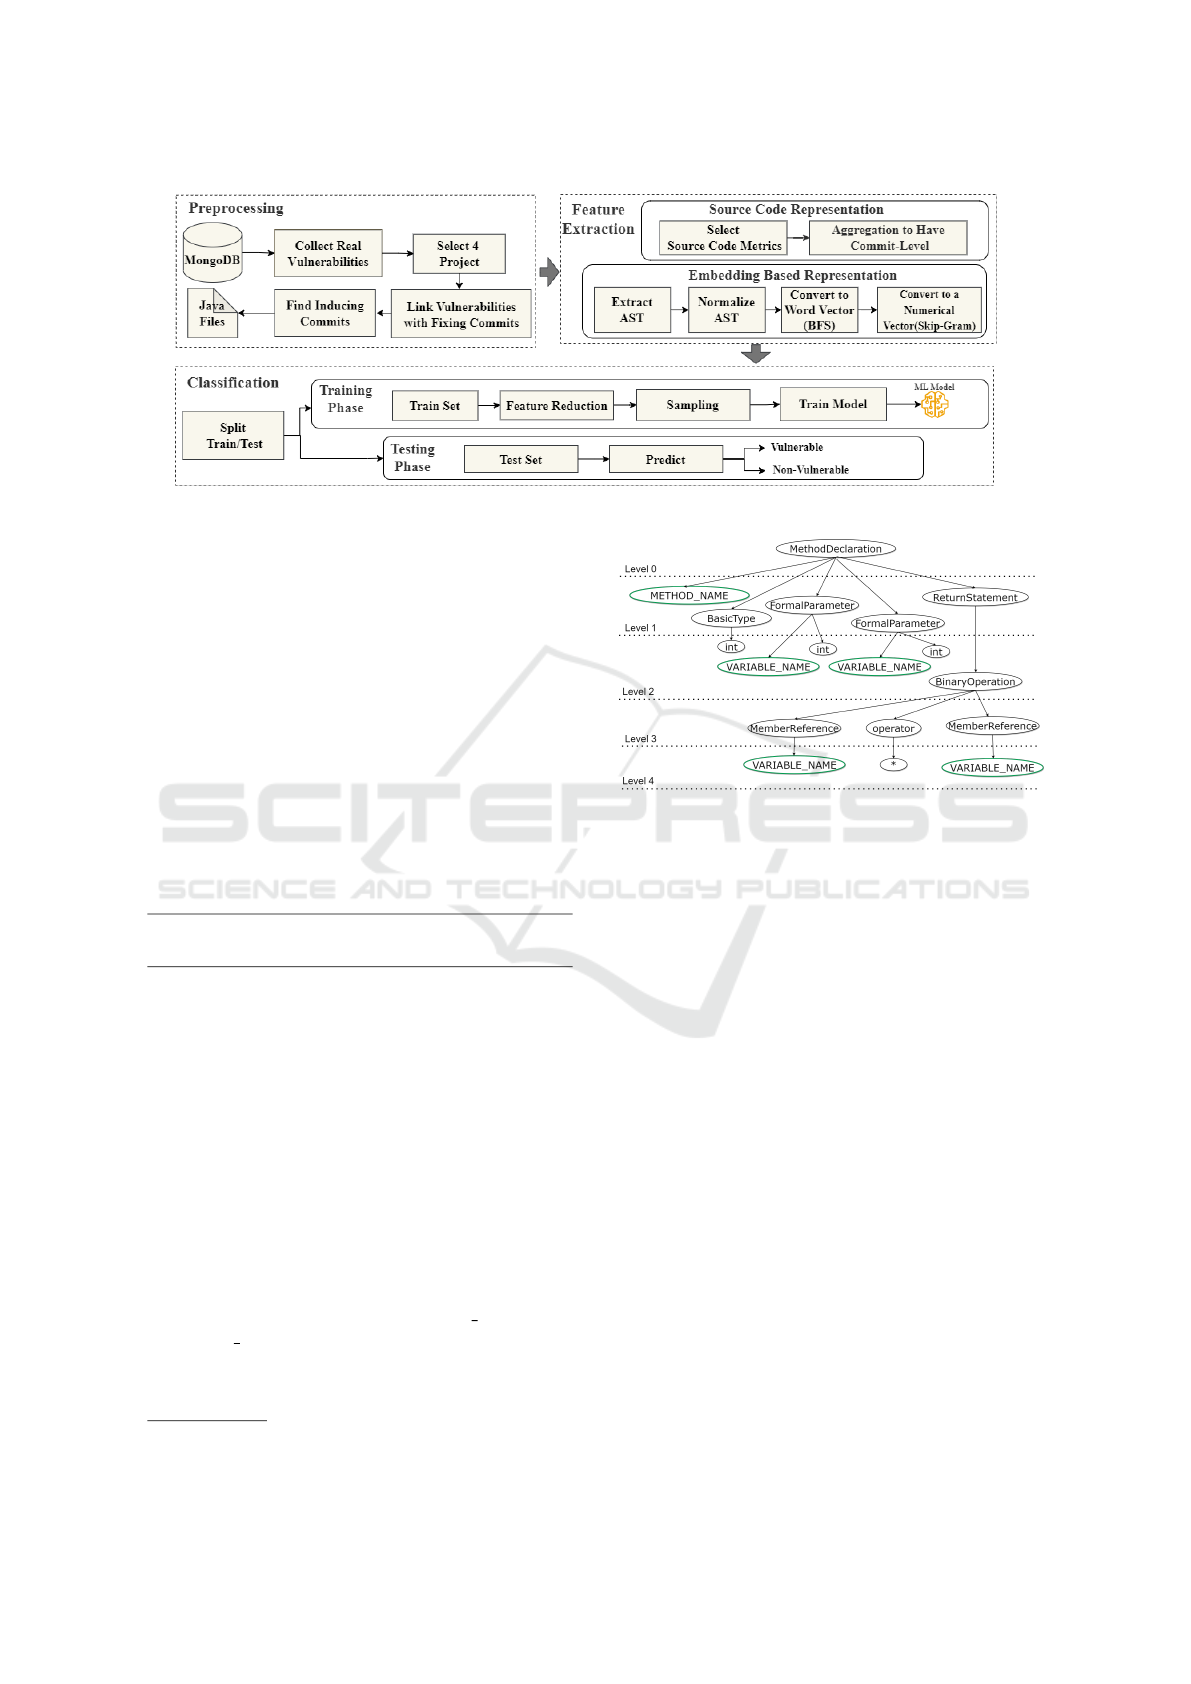
Figure 1: Illustration of proposed experimental setup.
sequently, we utilized Breadth-First Search (BFS) to
convert the AST into a vector retaining the location
of each node. Next, we employed Skip-Gram, a word
embedding technique, to transform it into a numerical
vector. The process steps are detailed below:
Step 1. Extracting AST of Source Code. We used
AST representation to extract the syntactic structure
of the source code. For this, we applied Javalang
3
, a third-party open source library designed to ana-
lyze Java source codes. Javalang is a pure Python li-
brary that provides Java-oriented lexical analyzer and
parser. With Javalang, the source code can be trans-
lated into an AST that contain several types of nodes.
Each node in the AST denotes a construct occurring
in the code. Figure 2 shows the AST for the function
multiply in the code example below:
public int multiply(int a,int b){
return a*b;}
Step 2. Normalizing AST Nodes Names. Each node
of the AST denotes a construct occurring in the source
code. AST represents only structural and content-
related details and discards other details, for example,
grouping parentheses are implicit in the tree struc-
ture, and they are not represented as separate nodes in
the AST. However, some of the structural nodes like
method names are out of our interest and do not hold
information related to vulnerabilities. Thus, before
using AST nodes we applied a normalization step in
which the nodes that are not essential for vulnerability
prediction are replaced with unique predefined names.
For example, since the variable and method names
are not important in our case, they are all replaced
by unique names, such as VARIABLE NAME and
METHOD NAME. The normalized nodes in the AST
of method multiply are highlighted as green nodes in
Figure 2.
3
https://github.com/c2nes/javalang
Figure 2: Extracted and Normalized AST of multiply func.
Step 3. Convert to Word Vector. In order to con-
vert the normalized AST to a one dimensional array
without losing the relations between AST nodes, we
used the BFS technique. Yet, the leaf nodes are kept
attached to their parent nodes as they are considered
features rather than separated nodes. Finally, the ex-
tracted array is used as an input to the embedding
model to extract the feature matrix.
Step 4. Convert to Numerical Vector (Skip-Gram).
We used the Skip-Gram method to convert the for-
merly mentioned word vector into a numerical vector.
Skip-Gram extracts numerical features by considering
the relation between the neighbor nodes. Therefore,
the context information is preserved and mapped into
the numerical vector (Bamler and Mandt, 2017). We
transformed each word in code into a numerical vec-
tor that captures its features and context through two
steps. Firstly, we generated a feature matrix (dictio-
nary) using the Skip-Gram method on SmartSHARK
projects during preprocessing. This resulted in an em-
bedding feature matrix that represents each word as
a numerical vector based on its location in the code.
During model training and testing, we utilized this
dictionary to convert code arrays into numerical vec-
tors for processing.
A Comparison of Source Code Representation Methods to Predict Vulnerability Inducing Code Changes
473

During training and test phases, changed code
lines at commit level were extracted, preprocessed,
and converted to a numerical vector, where each word
was represented with a numerical vector ∈ R
20×1
.
Furthermore, it is more practical to use a fixed vec-
tor size as an input to the ML model. To decide the
best vector size with the least information lost, we an-
alyzed cumulative distribution function (CDF) of the
code vectors’ sizes, and set the size that captures the
maximum information. Vectors with sizes of 6000
(equivalent to 300 words) cover 99.24% of the data.
Thus, the vector size was fixed to be 6000 for each
commit. The vectors whose sizes are above 6000
were cut, and only the first 6000 tokens were pro-
cessed. On the other hand, vectors whose sizes are
less than 6000 were padded with zeros.
4.2 Sampling
We have an imbalanced dataset in which the instances
labelled as vulnerable commits only account for a
very small portion of the whole dataset (0.014%).
Thus, we applied an elimination approach to address
the problem of a serious imbalance between vulner-
able and non-vulnerable classes. We selected com-
mits that have files labelled as vulnerable at least once
in entire change histories. Meanwhile, we filtered
out commits according to the number of their files
when selecting. Afterwards, we performed hybrid-
sampling, that is, we implemented under-sampling to
reduce the number of instances of the major class up
to three times that of the minor class, and then we im-
plemented over-sampling until the number of major-
ity class instances is equal to those of minority class
instances.
4.3 Dimensionality Reduction Methods
Dimensionality reduction methods are performed
when ML algorithms can be adversely affected by an
extreme number of features or the correlation between
features. We used Principal Component Analysis
(PCA) and Independent Component Analysis (ICA)
dimensionality reduction methods to evaluate their
impact on the performance of classifiers. PCA cal-
culates the eigenvectors of the covariance matrix of
the original feature set, linearly transforming a high-
dimensional feature vector into a low-dimensional
vector with uncorrelated components. ICA aims to
obtain statistically independent components in the
transformed vectors, instead of transforming unre-
lated components. We reduced the number of features
to fifteen when implementing both PCA and ICA.
4.4 Classification Algorithms
We built the vulnerability prediction model using ML
and DL classifiers, namely, SVM, eXtreme Gradient
Boosting (XGBoost), Gradient Boosted Tree (GBT),
and 1D CNN. We used SVM algorithm with poly
kernel hence it outperformed other kernels in pre-
dicting vulnerabilities. The optimal parameter set of
SVM is identified through k-fold cross-validation. We
also employed GBT and XGBoost by tuning the hy-
perparameters through the grid search. Tuning XG-
Boost is a difficult task as it has various hyperparam-
eters. Therefore, we implemented the grid search for
a limited parameter combination, namely, colsample
bytree, gamma, max depth, and min child weight. We
also used 1D CNN that consists of two convolutional
layers, a max-pooling layer, dropout layers, a fully
connected layer, and a softmax layer. Also, a dropout
layer is applied to avoid over-fitting the training data.
5 EXPERIMENTAL RESULTS
We obtained different vulnerability prediction mod-
els and compare the impact of the two code represen-
tation methods (software metrics and embedding) in
predicting vulnerabilities. We analyze recall, preci-
sion, F1-Score, and inspection ratio of classification
results. Even though we have sampled and balanced
the training dataset, we conducted our test experi-
ments using the original ratio of positive and nega-
tive samples. We split 70% of the data for training
and 30% for testing. We repeated the experiments 10
times each with a different random seed on the or-
der of instances and took the average of the overall
performance scores. We ensure that the data is split
with stratification. Additionally, we applied Friedman
and Nemenyi tests to conclude that the differences be-
tween the models in terms of each performance eval-
uation metric are statistically significant (p < 0.05).
During our experiments, we first evaluated the
performance of vulnerability prediction models using
SVM, GBT, XGBoost, and CNN classifiers. Then, to
increase the robustness of the prediction model, we
assessed feature selection and dimensional reduction
methods. Table 3 summarizes the results obtained
from the experiments of all vulnerability prediction
models built with both Approach 1 and Approach
2. To closely examine the models’ performances,
we measured their results for predicting vulnerable
and non-vulnerable commits separately (shown as:
vulnerable commits prediction result/non-vulnerable
commits prediction result). In particular, we provide
comparisons of the best model using Approach 1 and
ENASE 2023 - 18th International Conference on Evaluation of Novel Approaches to Software Engineering
474

Table 3: Software Vulnerability Prediction results of different code representation approaches and classification models.
Approach 1 (Vulnerable/Non-vulnerable) Approach 2 (Vulnerable/Non-vulnerable)
Model Name R(%) P(%) F1(%) IR(%) R(%) P(%) F1(%) IR(%)
XGB 47.0/76.9 11.0/96.0 17.8/85.4 24.5/75.5 24.9/80.8 7.6/94.7 11.5/87.1 19.5/80.5
GBT 69.6/48.4 6.9/96.9 12.3/61.9 52.6/47.4 46.2/56.3 7.2/94.4 10.3/65.4 43.9/56.1
SVM 84.1/38.8 7.3/97.1 13.3/54.4 62.2/37.8 88.8/23.0 5.5/92.9 10.1/26.0 76.9/23.1
CNN
63.2/51.2 8.0/96.5 14.2/65.4 45.2/50.2 34.2/69.7 6.2/94.4 10.3/79.7 31.9/69.6
XGB+PCA 52.1/70.5 9.6/96.1 16.2/81.3 30.8/69.2 39.8/65.6 6.5/94.7 11.2/77.4 34.8/65.2
GBT+PCA 77.7/40.1 7.3/96.8 13.4/56.2 60.9/39.1 53.6/46.7 7.3/84.6 8.0/50.7 53.3/46.7
SVM+PCA 83.7/38.3 7.2/97.0 13.2/53.9 62.7/37.3 77/25.2 4.5/93.5 8.4/29.5 74.7/25.3
CNN+PCA 71.7/51.8 7.8/96.4 14.0/67.2 52.7/50.7 39.1/68.0 5.9/94.3 10.1/78.7 38.1/68.0
XGB+ICA 53.2/71.7 10.3/96.2 17.3/82.2 29.5/70.3 37.2/66.9 6.6/94.7 11.1/78.4 32.7/66.6
GBT+ICA 76.0/42.9 6.8/97.4 12.5/57.3 57.6/41.8 50.0/48.9 4.7/94.2 8.0/56.8 50.5/49.0
SVM+ICA 86.5/39.8 7.6/97.3 13.9/56.4 61.4/38.6 77.1/26.3 5.7/93.5 8.8/31.3 73.6/26.4
CNN+ICA 79.4/52.8 7.5/96.3 13.7/66.8 60.5/51.8 53.4/42.9 6.5/93.5 9.8/55.5 54.2/43.1
XGB+k-best 47.5/75.5 10.5/96.0 17.2/84.5 25.8/74.2 33.6/68.0 6.7/94.3 9.9/75.2 32.1/67.9
GBT+k-best 50.0/70.2 9.2/95.9 15.6/81.0 31.0/69.0 34.3/67.3 6.5/94.3 9.8/74.9 32.8/67.2
SVM+k-best 92.5/33.3 7.1/97.7 13.2/48.0 67.7/32.3 64.5/44.8 5.9/94.0 10.3/57.7 55.2/44.8
CNN+k-best 69.8/37.6 7.5/97.2 13.4/53.7 53.5/36.6 40.4/50.8 5.7/94.0 9.2/62.9 39.5/50.8
XGB+PCA+k-best 49.4/76.3 11.2/96.1 18.3/85.1 25.2/74.8 36.0/70.6 6.9/94.8 11.6/80.9 29.8/70.2
GBT+PCA+k-best 58.7/65.8 9.4/96.3 16.2/78.2 35.6/64.4 40.8/65.4 6.7/94.8 11.5/77.3 35.0/65.0
SVM+PCA+k-best 84.4/38.3 7.4/97.2 13.4/53.9 66.8/37.2 62.6/33.8 5.8/93.6 8.8/42.6 66.0/34.0
CNN+PCA+k-best 72.3/51.6 7.9/96.6 14.2/67.0 52.5/50.4 40.0/54.6 6.0/94.2 10.3/67.7 39.4/54.6
XGB+ICA+k-best 49.4/77.0 11.5/96.3 18.6/85.5 24.5/75.4 35.7/71.7 7.0/94.8 11.7/81.6 29.0/71.3
GBT+ICA+k-best 60.4/66.7 10.0/96.7 17.1/78.9 34.5/65.1 45.5/63.0 7.0/94.7 12.0/75.6 37.3/62.8
SVM+ICA+k-best 84.6/37.1 7.3/97.2 13.4/53.3 62.7/36.0 56.6/44.7 5.6/93.5 9.9/57.6 53.0/44.9
CNN+ICA+k-best 76.0/43.5 7.4/97.0 13.4/59.9 58.9/42.3 65.3/48.4 5.5/93.3 9.3/59.0 69.0/48.6
the best model using Approach 2 when predicting vul-
nerable and non-vulnerable commits in Figures 3 and
4, respectively. We publish our source codes that con-
sists of entire steps of model training and testing and
also includes additional real vulnerability dataset.
Approach 1 - Software Metric Based Vulnerabil-
ity Prediction. It can be seen that the combination
SVM+k-best utilizing Approach 1 has the highest re-
call rate (92.5%) in predicting vulnerable commits.
However, when achieving this recall rate, inspection
ratio is high (67.7%). It means that effort is required
to review 67.7% of all commits to detect 92.5% of
vulnerable commits. In terms of precision and F1-
Score, XGBoost+ICA+k-best outperformed the other
classifiers. The model achieves 11.5% precision rate
and 18.6% F1-Score rates. Also, inspection ratio is
more acceptable with 24.5%. When predicting non-
vulnerable commits XGB+ICA+k-best utilizing Ap-
proach 1 outperformed the other classifiers with recall
rate of 77%. This combination has also the highest
F1-Score rate (85.5%) and the lowest inspection ra-
tio (24.5%). Meanwhile, SVM+k-best achieve high
precision (97.7%).
Approach 2 - Embedding Based Vulnerability Pre-
diction. Results of vulnerability prediction models
trained with embedding metrics are also shown in
Table 3. Unlike SW metrics based models, embed-
ding based models showed similar performance in
both classifying vulnerable and non-vulnerable sam-
ples. XGB classifier has the highest Precision rate
(7.6%),GBT+ICA+k-best F1-Score rate (12%), and
SVM has the highest recall rate (88.8%).
Approach 1 vs. Approach 2. We observed that
the outperforming models developed with both ap-
proaches achieved high recall rates for the predic-
tion of both vulnerable and non-vulnerable commits.
On the other hand, in respect of precision and F1-
Score rates, models achieved high rates in predict-
ing non-vulnerable commits, but low rates in predict-
ing vulnerable commits. This variance between re-
call and precision indicates higher false positive rate
in the models predictions. However, this could not
be a totally wrong case, as the commits are manually
labeled by expert developers and new vulnerability
types and continuously discovered. So, some of the
vulnerable commits that are now considered as non-
vulnerable commits could actually contain vulnerable
parts but have not been discovered yet. Moreover, we
applied sampling techniques to balance the training
set whereas we used the original ratios in the test set.
The conducting the experiments on such highly im-
balanced test set is another reason to have different
A Comparison of Source Code Representation Methods to Predict Vulnerability Inducing Code Changes
475

prediction rates for samples with different distribu-
tions. Figure 3 shows the results (in terms of recall,
precision and F1-Score) of the outperforming models
in predicting vulnerable commits for both approaches.
Also, Figure 4 shows the results of the outperforming
models in predicting non-vulnerable commits for both
code representation approaches.
As illustrated in Figures 3 and 4, Approach
1, namely, software metrics based code representa-
tion, is better at distinguishing vulnerable and non-
vulnerable classes as it has better prediction perfor-
mance in terms of recall, precision and F1-Score. In
contrast to prior research, our findings demonstrate
that software metrics outperformed text mining meth-
ods in detecting vulnerabilities. This deviation can
be attributed to the fact that we processed codes at
the code change (commit) level, whereas text mining
methods have been shown to be most effective when
applied to complete texts, such as entire functions in
previous studies. Based on these results, we con-
clude that working at the code change level may be
a more cost-effective and flexible option for real-time
projects and using software metrics could provide a
better measurement attribute in such cases.
Moreover, the projects are heterogeneous in terms
of the number of all commits and vulnerability in-
ducing commits. Therefore, to analyse the overall
results for each project, we performed additional ex-
periments on each project’s test set separately. Figure
5 shows that the performance of the SVM+ICA+k-
best model with Approach 1 is better than the perfor-
mance of the GBT+PCA prediction using Approach
2 over ActiveMQ and Struts. On the other hand, ac-
cording to the results of Tika, Approach 2 has a bet-
ter recall rate than Approach 1 (Figure 5a), while has
worse precision and F1-Score rates (Figure 5b and
Figure 5c). Besides, the results of the experiments
on Nifi show that both approaches have similar recall
rates while Approach 1 has better precision and F1-
Score rates than Approach 2. Our findings show that
the performance of software vulnerability prediction
models can vary depending on the analyzed project in
the dataset.
6 THREATS TO VALIDITY
This study is limited to open source Java projects se-
lected from the public SmartSHARK dataset. Hence,
we cannot prove the generalization of our results
to industrial projects, other open-source projects or
projects implemented in other languages. Neverthe-
less, the dataset used in our study offers a comprehen-
sive data source with 47,303 pull requests, 163,057
issues, 2,987,591 emails, and 366,322 commits. And
we selected four projects with the largest number
of real vulnerability data. Thus, we can safely ar-
gue that our research question have so far been ad-
dressed on the largest and most diverse dataset in
this field. The dataset includes software metrics col-
lected by SourceMeter tool, and hence metrics that
the tool could not identify are excluded. Neverthe-
less, SourceMeter is able to extract the majority of
the most popular metrics. Our conclusions are lim-
ited to 4 projects implemented Java, but the prediction
results are statistically compared among several rep-
resentations and models, and validated through non-
parametric significance tests.
7 CONCLUSION
We intent to investigate vulnerability-inducing code
changes and source code representations that explain
those. However, extracting embedding features of
changed parts of the code only might have led to
missing some of the contextual details, and thus, em-
bedding based models might have underperformed
compared to software metrics based models in vul-
nerability prediction task. To overcome this prob-
lem, file based embedding features could be extracted
to double check the vulnerability existence in the
source code as a whole. Also, pre–trained source
code models could be used to generate the embed-
ding matrix/dictionary. Moreover, to improve the per-
formance of vulnerability prediction model, the im-
pact of other code features, such as technical debt,
code smell, and refactoring related features could be
investigated. Furthermore, our approaches could be
evaluated on other projects for increasing the valid-
ity of our conclusions. Furthermore, in this study,
to extract vulnerability-inducing commits, we used
the SZZ algorithm. Vulnerabilities are different from
common bugs and a lot of vulnerabilities are founda-
tional, i.e., they are introduced at their initial time.
Therefore, to identify vulnerability-inducing com-
mits, vulnerability-specific SZZ algorithm (Bao et al.,
2022) could be considered.
ACKNOWLEDGEMENTS
This work was funded by The Scientific and Techno-
logical Research Council of Turkey, under 1515 Fron-
tier R&D Laboratories Support Program with project
no: 5169902.
ENASE 2023 - 18th International Conference on Evaluation of Novel Approaches to Software Engineering
476

(a) SVM+k-best Recall (b) XGBoost+ICA+k-best Precision (c) XGBoost+ICA+k-best F1-Score
Figure 3: Boxplots of feature representation approaches using models that outperformed in predicting vulnerable commits.
(a) XGBoost+ICA+k-best Recall (b) SVM+ICA Precision (c) XGBoost+ICA+k-best F1-Score
Figure 4: Boxplots of feature representation approaches using models that outperformed in predicting nonvulnerable commits.
(a) Recall (b) Precision (c) F1-Score
Figure 5: Evaluation results of each project.
REFERENCES
Alon, U., Zilberstein, M., Levy, O., and Yahav, E. (2019).
code2vec:learning distributed representations of code.
Proc. ACM Program. Lang., 3(POPL):40:1–40:29.
Bamler, R. and Mandt, S. (2017). Dynamic word embed-
dings. In ICML, pages 380–389. PMLR.
Bao, L., Xia, X., Hassan, A. E., and Yang, X. (2022). V-szz:
automatic identification of version ranges affected by
cve vulnerabilities. In ICSE, page 2352.
Cao, D., Huang, J., Zhang, X., and Liu, X. (2020). Ftclnet:
Convolutional lstm with fourier transform for vulner-
ability detection. In TrustCom, pages 539–546. IEEE.
Chakraborty, S., Krishna, R., Ding, Y., and Ray, B. (2021).
Deep learning based vulnerability detection: Are we
there yet. IEEE Transactions on Software Engineer-
ing.
Chowdhury, I. and Zulkernine, M. (2011). Using complex-
ity, coupling, and cohesion metrics as early indicators
of vulnerabilities. Journal of Systems Architecture,
57(3):294–313.
Croft, R., Xie, Y., and Babar, M. A. (2022). Data prepara-
tion for software vulnerability prediction: A system-
atic literature review. IEEE Transactions on Software
Engineering.
Dixit, D. and Kumar, S. (2018). Investigating the effect of
software metrics aggregation on software fault predic-
tion. In ICSOFT, pages 338–345.
Fang, Y., Liu, Y., Huang, C., and Liu, L. (2020). Fastembed:
Predicting vulnerability exploitation possibility based
on ensemble machine learning algorithm. Plos one,
15(2):e0228439.
Ghaffarian, S. M. and Shahriari, H. R. (2021). Neural
software vulnerability analysis using rich intermedi-
ate graph representations of programs. Information
Sciences, 553:189–207.
Hanifi, K., Fouladi, R. F., Gencer Unsalver, B., and
Karadag, G. (2023). Vulnerability prediction knowl-
edge transferring of software vulnerabilities. In
ENASE, page In Press.
Harer, J. A., Kim, L. Y., Russell, R. L., et al. (2018). Auto-
mated software vulnerability detection with machine
learning. arXiv preprint arXiv:1803.04497.
Henkel, J., Lahiri, S. K., Liblit, B., and Reps, T. W. (2018).
Code vectors: understanding programs through em-
bedded abstracted symbolic traces. In ACM Joint
Meeting on, ESEC/SIGSOFT FSE, pages 163–174.
Kalouptsoglou, I., Siavvas, M., Kehagias, D., Chatzigeor-
giou, A., and Ampatzoglou, A. (2022). Examining
the capacity of text mining and soft. metrics in vulner-
ability prediction. Entropy, 24(5):651.
Li, Z. and Shao, Y. (2019). A survey of feature selection for
vulnerability prediction using feature-based machine
learning. In ICMLC, pages 36–42.
Lozoya, R. C., Baumann, A., Sabetta, A., and Bezzi, M.
(2021). Commit2vec: Learning distributed represen-
tations of code changes. SN Comput. Sci., 2(3):150.
McGraw, G. (2006). Software security: building security
in, volume 1. Addison-Wesley.
A Comparison of Source Code Representation Methods to Predict Vulnerability Inducing Code Changes
477

McGraw, G. (2008). Automated code review tools for secu-
rity. IEEE Computer, 41(12):108–111.
Ponta, S. E., Plate, H., Sabetta, A., Bezzi, M., and Dangre-
mont, C. (2019). A manually-curated dataset of fixes
to vulnerabilities of open-source software. In MSR,
pages 383–387. IEEE.
Sahal, E. and Tosun, A. (2018). Identifying bug-inducing
changes for code additions. In ESEM, pages 1–2.
S¸ahin, S. E.,
¨
Ozyedierler, E. M., and Tosun, A. (2022). Pre-
dicting vulnerability inducing function versions using
node embeddings and graph neural networks. Infor-
mation and Software Technology, page 106822.
Scandariato, R., Walden, J., Hovsepyan, A., and Joosen, W.
(2014). Predicting vulnerable software components
via text mining. IEEE Transactions on Software En-
gineering, 40(10):993–1006.
Shin, Y. and Williams, L. (2008). An empirical model to
predict security vulnerabilities using code complexity
metrics. In ESEM, pages 315–317.
Shin, Y. and Williams, L. (2013). Can traditional fault pre-
diction models be used for vulnerability prediction?
Empirical Software Engineering, 18(1):25–59.
´
Sliwerski, J., Zimmermann, T., and Zeller, A. (2005). When
do changes induce fixes? ACM sigsoft software engi-
neering notes, 30(4):1–5.
Smith, B. and Williams, L. (2011). Using sql hotspots in
a prioritization heuristic for detecting all types of web
application vulnerabilities. In ICST, pages 220–229.
IEEE.
Tosun, A. and Bener, A. (2009). Reducing false alarms in
software defect prediction by decision threshold opti-
mization. In ESEM, pages 477–480. IEEE.
Trautsch, A., Trautsch, F., and Herbold, S. (2021). Msr
mining challenge: The smartshark repository mining
data. arXiv preprint arXiv:2102.11540.
Walden, J., Stuckman, J., and Scandariato, R. (2014). Pre-
dicting vulnerable components: Software metrics vs
text mining. In ISSRE, pages 23–33. IEEE.
ENASE 2023 - 18th International Conference on Evaluation of Novel Approaches to Software Engineering
478
