
Anomaly Detection for Multivariate Industrial Sensor Data via
Decoupled Generative Adversarial Network
Chien Wei-Chin and Wang Sheng-De
Department of Electrical Engineering, National Taiwan University, Taipei, Taiwan
Keywords:
Anomaly Detection, Time Series, Deep Learning, Autoencoder, Generative Adversarial Network.
Abstract:
Industrial control systems often contain sensor and actuator devices, which provide monitoring data in the
form of time series, such as bridge vibrations, water distribution systems, and human physiological data. This
paper proposes an anomaly detection model based on autoencoders that can consider time-series relations
of the data. Moreover, the quality of the decoder output is further improved by adding a residual produced
by an extra generator and discriminator. The proposed autoencoder-GAN model and detection algorithm not
only improved the performance but also made the training process of GAN easier. The proposed deep learning
model with the anomaly detection algorithm has been shown to achieve better results on the SWaT, BATADAL,
and Rare Event Classification datasets over existing methods.
1 INTRODUCTION
Anomaly detection, i.e outlier detection, has been
an active research area in recent years. The goal
of anomaly detection is to identify the data instance
which is significantly different from the majority of
data instances. These data may come in different
forms, for example, image, text or numeric data...etc.
Anomaly detection also has various kinds of applica-
tions, such as Fraud Detection, Cyber-Intrusion De-
tection, Industrial Damage Detection, or even Video
Surveillance.
In recent years, Industrial Control Systems and
IoT applications have been widely deployed in man-
ufacturing factories and our daily lives because of
the advances of hardware technology and computing
power. These devices often contain sensors that keep
track of the monitoring object. For example, a pa-
per manufacturing machine may have sensors moni-
toring the amount of pulp fiber or chemicals; power
plants(Zhang et al., 2018a) may have sensors moni-
toring the temperature and pressure; human body may
have smartwatch monitoring functions, such as ECG
or body temperature. These sensors or actuators pro-
duce data in the same period of time continuously.
Consequently, it has become an important issue to de-
tect abnormalities in these data. When abnormalities
occurred in these devices, the corresponding applica-
tions are often accompanied by serious consequences.
For instance, an anomaly occurred in manufacturing
machines can cause the machine to break down, an
ECG anomaly may indicate heart problems of the
smartwatch wearer. Therefore, monitoring or pro-
cessing time series data has been an active research
topic in the past few decades.
In this paper, we mainly focus on anomaly detec-
tion for multivariate time series data. Conventionally,
many domain experts might use hand-crafted rules
to determine a threshold for the monitoring metric
(e.g. temperature, transaction amount). However,
these kinds of methods may be labor-intensive, since
the amount of data keeps growing from time to time.
To deal with this problem, many univariate anomaly
detection methods have been developed, where the
anomalies are determined based on only one metric.
However, a real-world complex system contains lots
of sensors, and these sensors often interact with each
other. Thus, it is often unreasonable to describe a sys-
tem with merely univariate time series data.
This paper focus on MTS data, which can be seen
as a group of univarite times eries data, since MTS
data are more suitable for the real-world complex sys-
tem. We proposed a novel architecture and training
algorithm to predict anomalies in those data. In sum-
mary, our main contributions are:
• We proposed a novel framework to detect anoma-
lies in multi-variate time series (MTS) data, which
uses an LSTM-autoencoder to reconstruct the data
and a generator to produce residuals. The use of
residuals further improves the reconstruction er-
1028
Wei-Chin, C. and Sheng-De, W.
Anomaly Detection for Multivariate Industrial Sensor Data via Decoupled Generative Adversarial Network.
DOI: 10.5220/0011894100003393
In Proceedings of the 15th International Conference on Agents and Artificial Intelligence (ICAART 2023) - Volume 3, pages 1028-1035
ISBN: 978-989-758-623-1; ISSN: 2184-433X
Copyright
c
2023 by SCITEPRESS – Science and Technology Publications, Lda. Under CC license (CC BY-NC-ND 4.0)

ror. This model can successfully capture the time-
series dependencies of the data.
• We use a discriminator to calculate anomaly
score, further improving our prediction accuracy.
• GANs are very hard to train. We designed a novel
training algorithm to ease the training of GAN.
• We conduct experiments and evaluation on several
real-world datasets. The proposed method outper-
forms previous autoencoder methods, showing the
effectiveness of our 2 stage training and anomaly
score calculation.
2 RELATED WORK
Anomaly detection is actively and heavily researched
in recent years. Due to the increasing demand and
applications in broad domains, such as risk man-
agement, compliance, security, financial surveillance,
health and medical risk, and AI safety, anomaly de-
tection plays increasingly important roles. In anomaly
detection fields, data can be roughly divided into point
data and time series data. We will discuss which algo-
rithm is suitable for which kind of data type later. In
this chapter, we will divide these algorithms into two
parts, traditional method and deep learning method.
The discussion will be including but not limit to time
series datasets.
2.1 Traditional Method
k-Nearest Neighbor(k-NN) is a machine learning al-
gorithm frequently used for classification problems
in data science. It is one of the simplest yet widely
used algorithms with good use cases such as build-
ing recommend systems, face detection applications
and so. Consequently, it has also been widely used in
anomaly detection(Hautamaki et al., 2004). It calcu-
lates the average distance between each samples and
their k nearest neighbors, and uses the average dis-
tance as an anomaly score. However, KNN has the
drawback of its high computation cost and it is often
a challenging problem to determine the value k.
Another common traditional method is Support
Vector Machine(SVM)(Hearst et al., 1998). The ob-
jective of the SVM algorithm is to find a decision
boundary that distinctly classifies the data points.
One-Class SVM(Wang et al., 2004) is specifically
used in anomaly detection. It is a modification of
SVM, where algorithm captures the density of the ma-
jority class and classifies examples on the extremes of
the density function as outliers. However, it is often
time consuming for training SVMs on large dataset.
The above mentioned methods do perform well on
point data. However, when it comes to time series
data, those traditional method often lack the ability to
extract temporal dependencies between the data. Fur-
ther experiments have also conducted in this paper to
show that traditional method has relatively low per-
formance.
2.2 Deep Learning Method
In recent years, deep learning has achieved great suc-
cess on many fields. It has drawn many applications
because of its ability to learn representations from dif-
ferent type of data, such as Image(He et al., 2015),
text(Devlin et al., 2019) or video(Mao et al., 2021)
without hand-coded rules or human domain knowl-
edge. Deep learning also played important roles in
various anomaly detection fields.
A simple and heuristic way of using deep learning
models for point anomaly detection is by classifica-
tion(Lee et al., 2018). Starting by training the model
on normal data, the model tries to classify each data
to its own class. Later in the testing stage, the abnor-
mal data appears, given that the class has not appeared
in training data, the model tends to produce very low
confidence in every class. Therefore, a threshold can
be set to define which data is an anomaly. In time
eries data, another simple way is to see this prob-
lem as a forecasting problem. For example, Deep-
AnT (Munir et al., 2019) uses convolutional neural
network (CNN)(Krizhevsky et al., 2012) and history
windows to predict the value of next timestamp. The
data are seen as an anomaly if the Euclidean distance
between the predicted value and the data exceeds a
certain threshold. However, in multivariate time se-
ries data, forecasting may become difficult since there
are multiple variables to predict.
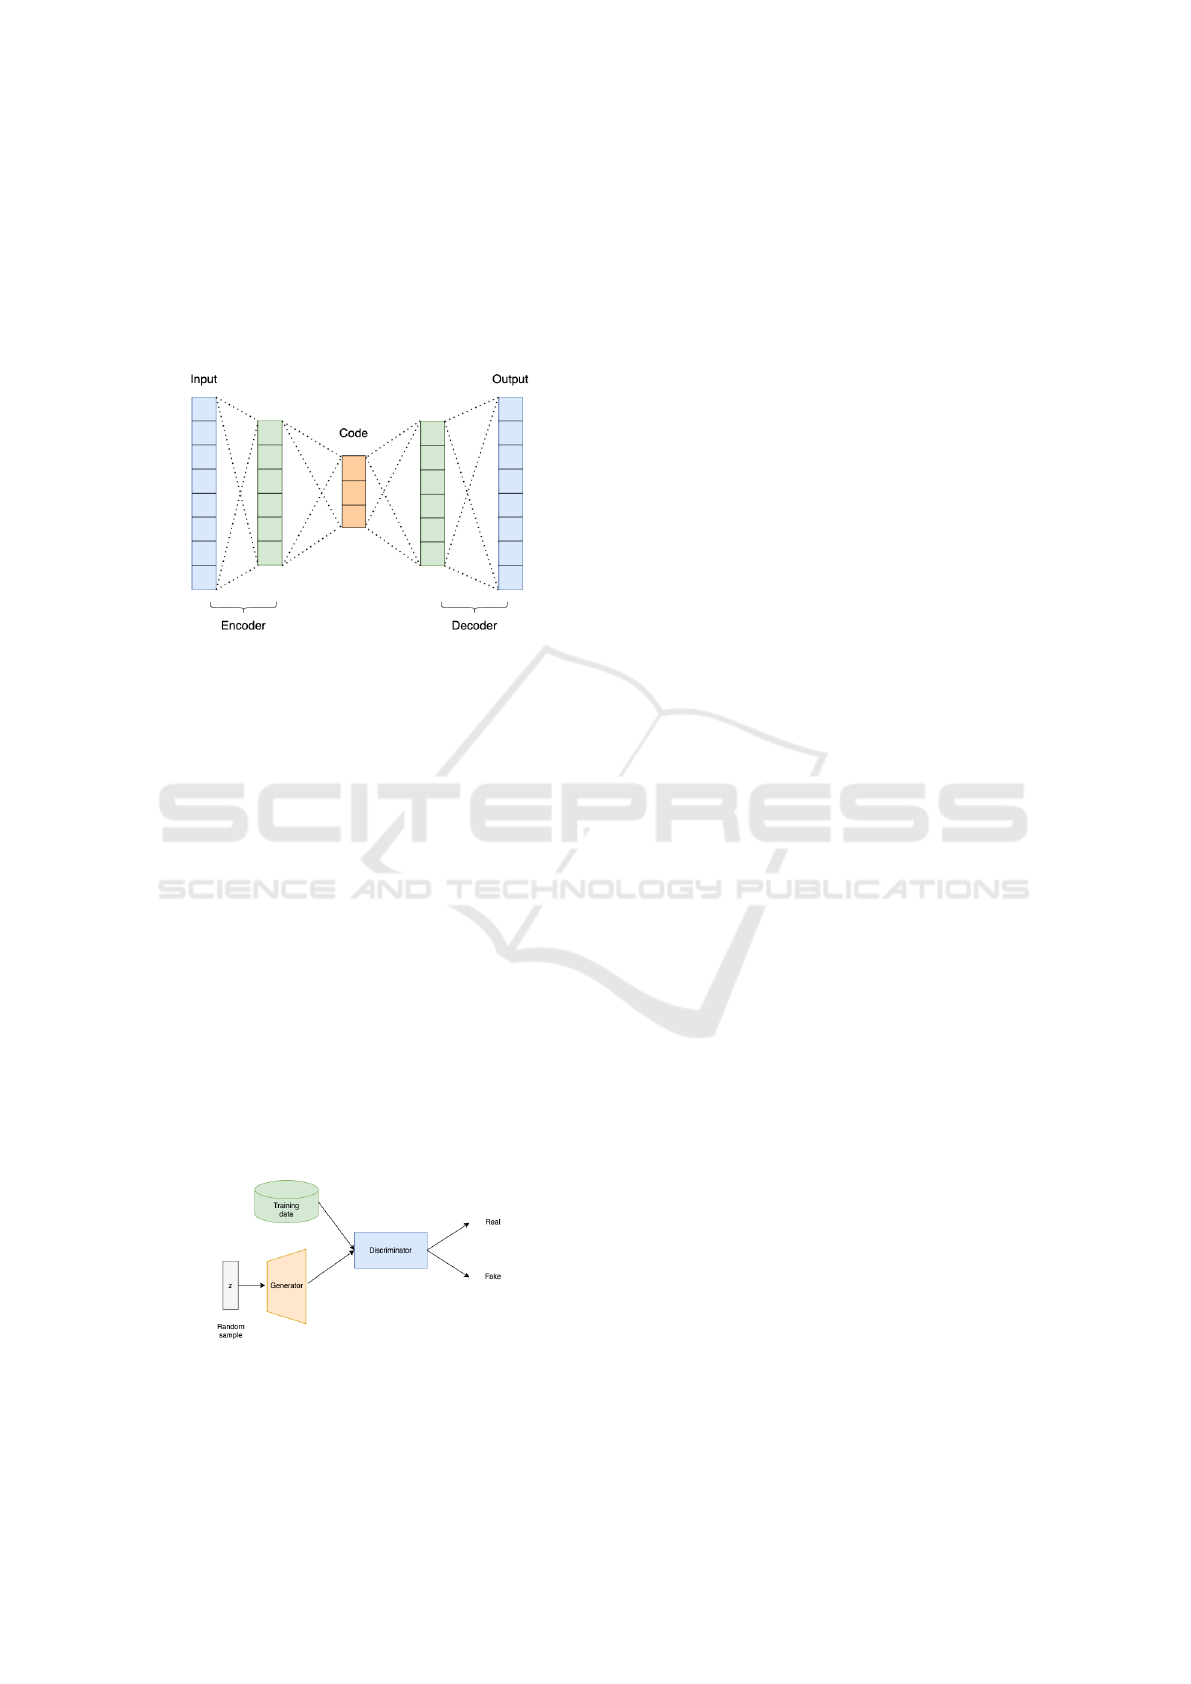
In addition, autoencoder-based deep learning
models(Baldi, 2012) (Bank D., 2021) are widely used
in anomaly detection. The autoencoder model is
trained on normal data and encode input samples to
a smaller dimension. The input is squeezed down to
a lower encoded representation using an encoder net-
work, and then a decoder network decodes the encod-
ing to recreate back the input. Figure 1 shows a sim-
ple illustration of an autoencoder. The aim of an au-
toencoder is to learn a lower-dimensional representa-
tion for higher-dimensional data, typically for dimen-
sional reduction, by training the network to capture
the most important parts of the input data. The target
of this model is such that the Input is equivalent to the
reconstructed output. To achieve this, we minimize
a loss function, namely reconstruction loss, which is
given by the error between the input and the recon-
Anomaly Detection for Multivariate Industrial Sensor Data via Decoupled Generative Adversarial Network
1029
structed output. During an anomaly detection task,
the reconstruction loss is often seen as the anomaly
score. For example, Tung Kieu et.al.(Kieu et al.,
2019) showed the ability of LSTM based autoencoder
models in time series anomaly detection. However,
their work mainly focused on univariate time series
data, which does not consider multivariate data.
Figure 1: A simple illustration of autoencoder.
Generative adversarial networks
(GANs)(Goodfellow et al., 2014) have been driving
significant progress in deep learning in recent years.
GANs are neural networks that take random noise as
input and generate outputs that appear to be a sample
from the distribution of the training set. Figure 2
shows a simple structure of GAN. It has also been
used in anomaly detection tasks. AnoGAN(Schlegl
et al., 2017) uses a standard GAN, which trains
only on positive samples. The generator can learn
a mapping from the latent space representation z to
the realistic sample x
′
= G(z) and this learned repre-
sentation is used to map new, unseen, samples back
to the latent space. After training GAN on normal
samples, the generator may learn the distribution
X, which is the normal data. Since the generator
only learns how to generate normal samples, when
an anomalous image is encoded, the reconstruction
can be non-anomalous. During testing time, the
difference between the input and reconstruction data
will be detected as an anomaly.
Figure 2: A simple structure of GAN.
3 PROPOSED APPROACH
3.1 Overview
In this section, we will introduce our proposed
method. The method contains two parts; the first part
is the model architecture whereas the second part is
our training and testing algorithm. Before introduc-
ing our method, we’ll first describe our problem in
detail in the next section.
3.2 Problem Formulation
The input of multivariate time series data can be for-
mulated as follows:
W
t
= [X
t−K
, X
t−K+1
, ..., X
t−1
, X
t
]
where t is the current timestamp and K is the win-
dow size that we want to look back at from the cur-
rent timestamp. More specifically, if the sensor pro-
duces a single data every 1 minute and K = 10, that
means we want to consider the data from the previous
10 minutes. X ∈ R
m
, where m is the dimension of the
data, depending on how many sensors and actuators
the system has.
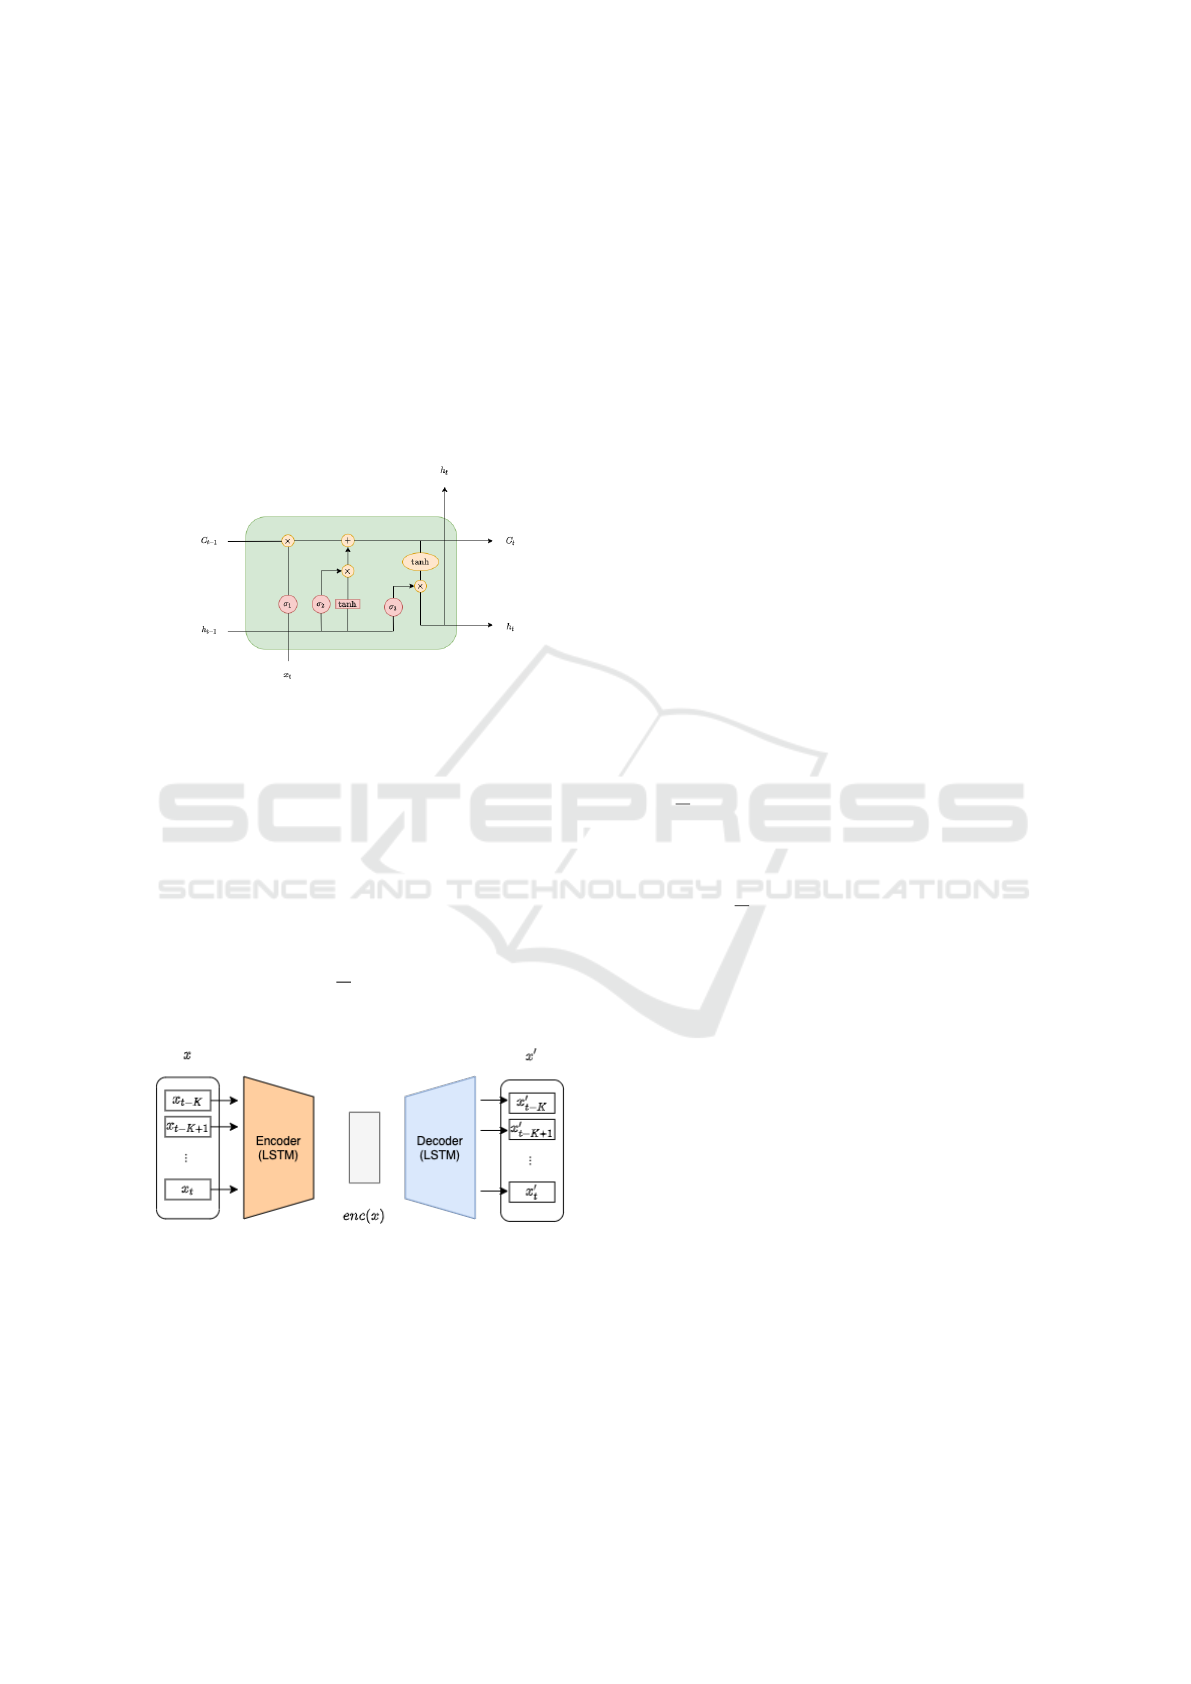
3.3 Stage 1: Autoencoder
Autoencoders have achieved great performance in the
research of anomaly detection. Therefore, we use
an autoencoder as our backbone model. To further
capture the relation between each timestep, we use
LSTM(Hochreiter and Schmidhuber, 1997) as our en-
coder and decoder model. LSTM network is a vari-
ant of Recurrent Neural Network (RNN). RNN is de-
veloped to deal with complex sequential problems.
LSTM can effectively extracts the long-term tempo-
ral dependencies along with the short-term ones for
time series data by using nonlinear gates. Figure 3 il-
lustrates the typical LSTM structure consisting with a
number of cells. The cell computes the hidden state
h
t
∈ R
dh
and the updated cell state c
t
∈ R
dh
based on
the previous state (c
t−1
, h
t−1
) and the sequential in-
put x
t
at time step t. Note that the first cell uses the
initial states (c
0
, h
0
). For each element in the input se-
quence, each layer computes the following function:
f
t
= σ(W
i f
x
t
+ b
i f
+W
h f
h
t−1
+ b
h f
)
where f
t
is the forget gate, a number between 0 and 1
to decide to forget the previous state or not.
The next step is to calculate the current sate. We
first calculate the scalar i
t
to decide the ratio of the
current and previous sate.
i
t
= σ(W
ii
x
t
+ b
ii
+W
hi
h
t−1
+ b
hi
)
ICAART 2023 - 15th International Conference on Agents and Artificial Intelligence
1030
Then we combine them to get the final state:
c
t
= f
t
⊙ c
t−1
+ i
t
⊙ c
t
Finally, we can get the output h
t
, which also uses
a scalar o
t
as an adjusting factor:
o
t
= σ(W
io
x
t
+ b
io
+W
ho
h
t−1
+ b
ho
)
h
t
= o
t
⊙ tanh(c
t
)
The above W and b are the weight matrices and
the biases.
Figure 3: A module of LSTM cell.
Consider the input sequence of a multivariate
time series (X
t−K
, X
t−K+1
, ..., X
t−1
, X
t
) the sequence
is passed into the LSTM encoder, which then is pro-
jected to a low dimension latent vector z. The latent
vector z is then passed to the decoder model to gener-
ate X
′
, which is the reconstructed counterpart of X.
As for the loss function, we use Mean Squared
Error (MSE), where the autoencoder tries to minimize
the objective function:
MSE =
1
N
m
∑
i=1
(x
i
− x
′
i
)
2
(1)
Figure 4: First stage with autoencoder.
4 STAGE 2: GAN
To further improve the reconstruct precision of the
model, in stage 2, we add another pair of generator
and discriminator to guide the output to be more close
to the input. Based on the concept of decoupled learn-
ing(Zhang et al., 2018b), which stabilizes GAN train-
ing by decoupling decoder and generator, we train an-
other generator separately by taking the output of the
encoder as the input of generator. The generator gen-
erates the residual of the data x
′′
as equation (2).
x
′′
= x
′
+ G(enc(x)) (2)
The parameters of the encoder and the decoder are
fixed in this training stage, which stabilizes the train-
ing process. There are several advantages to doing so.
First, GAN is notoriously hard to train, and the gen-
erator is also hard to learn the reconstruction x
′
from
scratch. With our method, the generator only has to
learn the residual of the reconstruction, which is much
easier. Second, traditional GAN also has the problem
of mode collapse(Thanh-Tung and Tran, 2020). How-
ever, in our training algorithm, the GAN input comes
from the encoder output, which is uniformly sampled
from the data. Further, the generator is trained with a
discriminator in an adversarial network. This discrim-
inator is trained to distinguish whether an input se-
quence, x
′′
, is real or generated by the machine, where
the discriminator tries to minimize function (3):
1
m
m
∑
i=1
[log(D(x
(i)
)) + log(1 − D(G(z
(i)
)] (3)
And the generator minimize the loss function (4)
1
m
m
∑
i=1
[log(1 − D(G(z
(i)
)] (4)
During training, the discriminator will output a like-
lihood of real data in the interval [0, 1]. If D(x
i
) is
close to 1, it means that the discriminator considers
the input data is real. On the other hand, if D(x
i
) is
close to 0, the discriminator considers that x is fake
data. The loss of discriminator will be a binary cross-
entropy loss, which is defined as follows:
L = −(y
n
· log(x
n
) + (1 − y
n
) · log(1 − x
n
) (5)
where y
n
is the ground-truth answer, with 1 being real
and 0 being fake. Figure 4 and Figure 5 are a sim-
ple illustration of our GAN model, where we use an
LSTM-based autoencoder in the first stage and enc(x)
and x
′
are inputs to a GAN in the sencond stage.
5 ANOMALY
DETECTION-TESTING STAGE
At the anomaly detection stage, we use both the au-
toencoder and generator to generate our final output.
Anomaly Detection for Multivariate Industrial Sensor Data via Decoupled Generative Adversarial Network
1031

Figure 5: Second stage with autoencoder and GAN.
The time series for anomaly detection is first divided
into sub-sequences by a sliding window in the same
step size as the training stage X(x
t−w+1
, ..., x
t
), which
are input into the encoder. The encoder then trans-
forms the inputs into the latent space and passes the
latent vector to the decoder and generator. The de-
coder outputs the main reconstruction, whereas the
generator outputs the residual. The discriminator out-
puts the possibility of inputs being normal.
The anomaly score utilizes the encoder, the gener-
ator, and the discriminator simultaneously. The score
is composed of reconstruction difference and discrim-
ination results. Since anomalies do not conform to the
distribution of normal data, their anomaly scores will
be relatively high.
Anomaly Score =
1
N
n
∑
i=1
(x
i
− x
′
i
) − αDis(x
′
i
) (6)
Finally, if the anomaly score is larger than a cer-
tain threshold γ, the input is then seen as an anomaly.
We use the validation set to calculate the best thresh-
old for the highest f1 score and apply this threshold at
the testing stage. The equation of the f1 score will be
described in the next section.
6 EXPERIMENTS
6.1 Setup
Dataset: To evaluate our proposed autoencoder-GAN
architecture and the corresponding training algorithm,
we use three different real-world multivariate time se-
ries datasets, as will be reviewed in the following sec-
tion.
6.1.1 SWaT (Secure Water Treatment)
The SWaT(Mathur and Tippenhauer, 2016) dataset is
a small version of a real-world water treatment plant
Algorithm 1: Training and testing algorithm.
Input Time series data (x
(1)
, ..., x
(n)
)
At training Stage 1:
for k training epochs do
sample batch of m examples (x
(1)
, ..., x
(m)
)
from data
Generate z from encoder z = Enc(X)
Generate reconstruction X
′
from decoder X
′
=
Dec(z)
Update Autoencoder by loss
1
m
∑
m
i=1
(x
i
− x
′
i
)
2
end for
At training Stage 2:
for n training epochs do
sample batch of m examples (x
(1)
, ..., x
(m)
)
from data
Generate z from encoder z = Enc(X)
Generate reconstruction X
′
from decoder X
′
=
Dec(z)
Generate residual R from generator R = G(z)
Update generator by loss
1
m
∑
m
i=1
[log(1 −
D(X
′
+ R)]
Update discriminator loss
1
m
∑
m
i=1
[log(D(x
(i)
)) + log(1 − D(X
′
+ R)]
end for
At anomaly detection testing stage
Calculate reconstruction X
′
= Enc(Dec(X
test
))
calculate reconstruction residual R =
G(Enc(X
test
)
Calculate discrimination results Dis = Dis(X
′
+
R)
Calculate anomaly score = MSE(X
test
, (X
′
+
R)) − αDis(X
′
+ R)
if (score > threshold) then
return anomaly
else
return normal
end if
that produced filtered water. The dataset contains
11 days of continuous operation measured every sec-
ond, where 7 days are collected under normal con-
ditions, and 4 days are collected containing cyber-
attacks. There are a total of 51 variables in the SWaT
dataset, which contains 26 sensors and 25 actuators,
respectively. There are a total of 495000 samples in
the training set (Normal data) and 449919 samples of
testing data (Data with Attack).
6.1.2 BATADAL (BATtle of the Attack Detection
ALgorithms)
BATADAL(Taormina et al., 2018) is a dataset con-
taining hourly measurements of a medium-sized real
ICAART 2023 - 15th International Conference on Agents and Artificial Intelligence
1032

network, named C-Town. C-Town consists of 388
nodes linked with 429 pipes. There are a total of 43
variables in the dataset, 7 of them are tank water lev-
els, 12 of them are inlet and outlet pressure for actu-
ated valves and pumps.
6.1.3 Rare Event Classification
Rare Event Classification Dataset (Ranjan et al.,
2019) is a real-world dataset generated from a
pulp-and-paper manufacturing industry. The dataset
records the rare event of paper break 61 sensors ev-
ery two seconds. The dataset starts on May 1st and
ends on May 29th, 1999. Each input sample is la-
beled as “normal” or “break” at each timestamp. For
the data preprocessing, we split the dataset with 80%
of training data with consists of all normal data, 10%
of validation, and 10% of testing data consisting of
data with ”break”.
6.2 Evaluation Metrics
To evaluate our method, we use f1-score as our met-
ric, which is a commonly-used metric in anomaly de-
tection. Since the normal and abnormal might be un-
balanced, it is unnecessary to use accuracy in anomaly
detection. The F1-score is defined as the following:
F1 − Score = 2 ∗
Precision ∗ Recall
Precision + Recall
where Precision is calculated as:
Precision =
T P
T P + FP
and Recall:
Recall =
T P
T P + FN
6.3 Baseline Models for Comparison
OC-SVM. Scholkopf et al.(Sch
¨
olkopf et al., 1999)
propose the kernel-based One-class support vector
machine (OC-SVM) method for outlier detection, the
kernel of the SVM model we use is rbf. We use the
python scikit-learn library to train our model.
FC Autoencoder. Fully connected autoencoder,
which consists of several dense encoding and decod-
ing layer.
Conv 1d Autoencoder. 1d convolution autoencoder
has also been an important method in anomaly detec-
tion(Russo et al., 2020). We expect to use the convo-
lution filters to capture the time series dependencies.
LSTM Autoencoder. It is also used as our back-
bone model, details are described in section 3. We use
LSTM cells to encode the temporal relation between
the data time sequence.
6.4 Result
In this section, we consider F1 score in comparing
anomaly detection performance. The results of our
proposed anomaly detection of SWaT and BATADAL
are showed in Table 2. As shown in the table, our
proposed method outperforms the LSTM autoencoder
model. The Convolution and vallina autoencoder got
similar results, but not as good as the LSTM autoen-
coder. The One-Class SVM got the worst perfor-
mance. The above result will be further discussed in
the next section.
Table 3 showed our result on the Rare event clas-
sification dataset. Our propose method also got the
best performance among all compared methods. The
first result was provided by the original paper(Ranjan
et al., 2019), which used XGBoost and AdaBoost
models. This method together with OC-SVM didn’t
perform as good as the deep learning based result.
Also, the f1 score is relatively low compared to the
previous two datasets, the reason will also be dis-
cussed in the next section.
6.5 Analysis
As mentioned in the previous section, our proposed
method outperforms other methods. Table 2 shows
the f1 score on SWaT and BATADAL dataset. It can
be seen that the residual generated by generator and
the extra anomaly score calculated by the discrimi-
nator do help in the anomaly detection. The fully-
connected and Conv1d autoencoders have a small per-
formance gap of the LSTM autoencoder. The rea-
son is probably because that the RNN based model
can capture the time series dependencies better than
the convolution and fully-connected models. And
since the fully-connected and convolutional autoen-
coder models have similar results, we assume that the
convolution filters cannot capture the temporal depen-
dencies of the time series as well as the RNN based
model.
Also, traditional methods such as OC-SVM did
not perform well compared to the DL-based methods.
Moreover, it even took us several times longer to train
OC-SVM models on the SWaT dataset. This showed
that deep learning based models have their advantages
with these kind of data, especially when the data is
large.
Lastly, the performance on Rare Event dataset is
relatively low compared to the other two datasets. Ta-
ble 3 shows the visualization result. The possible rea-
son may be that the dataset is hard to predict, since
the result from the original paper(Ranjan et al., 2019)
also got very low score (with only 0.114 of f1 score).
Anomaly Detection for Multivariate Industrial Sensor Data via Decoupled Generative Adversarial Network
1033

Table 1: Hyperparameters of different methods.
Method Hyperparameter Value
FC AE
Architecture 3 Encoding Layers , 3 Decoding Layers
ReLU for Encoding and Decoding,
Tanh for output
Optimizer, Loss Adam, MSE
Conv AE
Architecture 3 Conv1d Encoding Layers with
max-pooling and ReLU,
3 Conv1d Decoding Layers with
upsampling and ReLU,
Optimizer, Loss Adam, MSE
LSTM AE
Architecture 1 LSTM encoding Layers,
1 LSTM Decoding Layers
1 Dense layer for output projection
Optimizer, Loss Adam, MSE
Proposed
Architecture Same with LSTM AE
Generator 1 LSTM layer,
1 Dense layer for output projection
Discriminator 1 LSTM layer,
1 Dense layer for classifier
Optimizer, Loss Adam, MSE
Table 2: The f1 score on SWaT and BATADAL dataset.
Model SWaT BATADAL
OC-SVM 0.2169 0.163
FC Autoencoder 0.6737 0.425
Conv 1d Autoencoder 0.6771 0.422
LSTM Autoencoder 0.6943 0.435
Proposed Method 0.7182 0.447
Table 3: The f1 score on Rare Event classification dataset.
Model Rare Event Classification
C. Ranjan et al. 0.114
OC-SVM 0.199
FC Autoencoder 0.2522
Conv 1d Autoencoder 0.2535
LSTM Autoencoder 0.2652
Proposed Method 0.2773
Table 4: Statistics of the datasets.
Dataset Training
size
Testing
size
Anomaly
ratio
SWaT 495000 449919 12%
BATADAL 8756 4177 11%
Rare Event 14718 3680 3.3%
Another possible reason is that the anomaly ratio is
relatively low in the dataset (with only 3 %), com-
pared to SWaT and BATADAL, which has 12% and
11%, respectively, as shown in Table 4. Which makes
the prediction much harder.
7 CONCLUSION
In this paper, we present a novel method combining
autoencoder and generative adversarial network as the
anomaly detection model for multivariate time series,
which use a generator to add residual and discrim-
inator to add an anomaly score. We evaluated our
method on three different datasets with different data
sizes or anomaly ratios. Compared to the LSTM au-
toencoder, our experiments showed that the proposed
method can surely improve the performance on the
multivariate time series datasets. Also, our training al-
gorithms successfully stabilize the GAN training pro-
cess, which made the GAN training process easier. In
the future, we plan to try more complicated models in
our experiments to further improve our performance.
For example, more layers of LSTM encoder and de-
coders, or even Transformer layers (Vaswani et al.,
2017). Also, we expect to examine our method on
more kinds of MTS datasets in the future.
REFERENCES
Baldi, P. (2012). Autoencoders, unsupervised learning, and
deep architectures. In Guyon, I., Dror, G., Lemaire,
V., Taylor, G., and Silver, D., editors, Proceed-
ings of ICML Workshop on Unsupervised and Trans-
fer Learning, volume 27 of Proceedings of Machine
Learning Research, pages 37–49, Bellevue, Washing-
ton, USA. PMLR.
ICAART 2023 - 15th International Conference on Agents and Artificial Intelligence
1034

Bank D., Koenigstein N., G. R. (2021). Autoencoders. [On-
line]. Available: https://arxiv.org/abs/2003.05991
Devlin, J., Chang, M.-W., Lee, K., and Toutanova, K.
(2019). Bert: Pre-training of deep bidirectional trans-
formers for language understanding. [Online]. Avail-
able: https://arxiv.org/abs/1810.04805
Goodfellow, I. J., Pouget-Abadie, J., Mirza, M., Xu, B.,
Warde-Farley, D., Ozair, S., Courville, A., and Ben-
gio, Y. (2014). Generative adversarial networks. [On-
line]. Available: https://arxiv.org/abs/1406.2661
Hautamaki, V., Karkkainen, I., and Franti, P. (2004). Out-
lier detection using k-nearest neighbour graph. In Pro-
ceedings of the 17th International Conference on Pat-
tern Recognition, 2004. ICPR 2004., volume 3, pages
430–433 Vol.3.
He, K., Zhang, X., Ren, S., and Sun, J. (2015). Deep resid-
ual learning for image recognition. [Online]. Avail-
able: https://arxiv.org/abs/1512.03385
Hearst, M., Dumais, S., Osuna, E., Platt, J., and Scholkopf,
B. (1998). Support vector machines. IEEE Intelligent
Systems and their Applications, 13(4):18–28.
Hochreiter, S. and Schmidhuber, J. (1997). Long short-term
memory. Neural computation, 9(8):1735–1780.
Kieu, T., Yang, B., Guo, C., and Jensen, C. S. (2019).
Outlier detection for time series with recurrent au-
toencoder ensembles. In Proceedings of the Twenty-
Eighth International Joint Conference on Artificial In-
telligence, IJCAI-19, pages 2725–2732. International
Joint Conferences on Artificial Intelligence Organiza-
tion.
Krizhevsky, A., Sutskever, I., and Hinton, G. E. (2012).
Imagenet classification with deep convolutional neu-
ral networks. In Pereira, F., Burges, C. J. C., Bottou,
L., and Weinberger, K. Q., editors, Advances in Neu-
ral Information Processing Systems 25, pages 1097–
1105. Curran Associates, Inc.
Lee, K., Lee, H., Lee, K., and Shin, J. (2018). Train-
ing confidence-calibrated classifiers for detecting
out-of-distribution samples. [Online]. Available:
https://arxiv.org/abs/1711.09325
Mao, F., Wu, X., Xue, H., and Zhang, R. (2021). Hi-
erarchical video frame sequence representation with
deep convolutional graph network. Computer Vision
– ECCV 2018 Workshops, page 262–270.
Mathur, A. P. and Tippenhauer, N. O. (2016). Swat: a wa-
ter treatment testbed for research and training on ics
security. In 2016 International Workshop on Cyber-
physical Systems for Smart Water Networks (CySWa-
ter), pages 31–36.
Munir, M., Siddiqui, S. A., Dengel, A., and Ahmed, S.
(2019). Deepant: A deep learning approach for un-
supervised anomaly detection in time series. IEEE
Access, 7:1991–2005.
Ranjan, C., Reddy, M., Mustonen, M., Paynabar, K., and
Pourak, K. (2019). Dataset: Rare event classifica-
tion in multivariate time series. [Online]. Available:
https://arxiv.org/abs/1809.10717
Russo, S., Disch, A., Blumensaat, F., and Villez, K. (2020).
Anomaly detection using deep autoencoders for in-
situ wastewater systems monitoring data. [Online].
Available: https://arxiv.org/abs/2002.03843
Schlegl, T., Seeb
¨
ock, P., Waldstein, S. M., Schmidt-
Erfurth, U., and Langs, G. (2017). Unsupervised
anomaly detection with generative adversarial net-
works to guide marker discovery. [Online]. Available:
https://arxiv.org/abs/1703.05921
Sch
¨
olkopf, B., Williamson, R. C., Smola, A. J., Shawe-
Taylor, J., Platt, J. C., et al. (1999). Support vector
method for novelty detection. In NIPS, volume 12,
pages 582–588. Citeseer.
Taormina, R., Galelli, S., Tippenhauer, N. O., Salomons,
E., Ostfeld, A., Eliades, D. G., Aghashahi, M., Sun-
dararajan, R., Pourahmadi, M., Banks, M. K., et al.
(2018). Battle of the attack detection algorithms: Dis-
closing cyber attacks on water distribution networks.
Journal of Water Resources Planning and Manage-
ment, 144(8):04018048.
Thanh-Tung, H. and Tran, T. (2020). On catas-
trophic forgetting and mode collapse in genera-
tive adversarial networks. [Online]. Available:
https://arxiv.org/abs/1807.04015
Vaswani, A., Shazeer, N., Parmar, N., Uszkoreit, J., Jones,
L., Gomez, A. N., Kaiser, L., and Polosukhin, I.
(2017). Attention is all you need. [Online]. Available:
https://arxiv.org/abs/1706.03762
Wang, Y., Wong, J., and Miner, A. (2004). Anomaly in-
trusion detection using one class svm. In Proceedings
from the Fifth Annual IEEE SMC Information Assur-
ance Workshop, 2004., pages 358–364.
Zhang, C., Song, D., Chen, Y., Feng, X., Lumezanu,
C., Cheng, W., Ni, J., Zong, B., Chen, H., and
Chawla, N. V. (2018a). A deep neural network
for unsupervised anomaly detection and diagnosis in
multivariate time series data. [Online]. Available:
https://arxiv.org/abs/1811.08055
Zhang, Z., Song, Y., and Qi, H. (2018b). Decoupled learn-
ing for conditional adversarial networks. [Online].
Available: https://arxiv.org/abs/1801.06790
Anomaly Detection for Multivariate Industrial Sensor Data via Decoupled Generative Adversarial Network
1035
