
Happy or Sad, Smiling or Drawing: Multimodal Search and
Visualisation of Movies Based on Emotions Along Time
Francisco Caldeira, João Lourenço and Teresa Chambel
a
LASIGE, Faculdade de Ciências, Universidade de Lisboa, Portugal
Keywords: Interactive Media Access, Movies, Music, Time, Emotions, Emotional Trajectories, Search,
Recommendation, Viewing, Visualization, Serendipity.
Abstract: Movies are a powerful vehicle for culture and education and one of the most important and impactful forms
of entertainment, largely due to the significant emotional impact they have on the viewers, in our lives.
Technology has been playing an important role, by making a huge amount of movies more accessible in
pervasive services and devices, and helping in emotion recognition and classification. As such, it is becoming
more pertinent the ability to search, visualize and access movies based on their emotional impact, although
emotions are seldom taken into account in these systems. In this paper, we characterize the challenges and
approaches in this scenario, then present and evaluate interactive means to visualize and search movies based
on their dominant and actual emotional impact along the movie, with different models and modalities. In
particular through emotional highlights in words, colors, emojis and trajectories, by drawing emotional
blueprints or through users’ emotional states, with the ability to get us into a movie in serendipitous moments.
1 INTRODUCTION
Movies have always had a very important role in
society, and have become a powerful vehicle for
culture, education, leisure and even propaganda
(Shah, 2011). One of the main reasons is their ability
to awaken the emotions of their viewers, to influence
our moods, attitudes and consequently our health and
wellbeing, making a difference in our lives. The
success of each movie depends on the emotions that
are perceived and felt by the audience (Aurier &
Guintcheva, 2015); and the emotional information
related to this experience that viewers have is actually
considered an important factor when searching or
seeking a film to watch, also determining its success
(Arriaga et al., 2019; Zhang et al., 2009). Of
particular importance is the safe environment
provided to experience roles and emotions we might
not otherwise be free to experience (Uhrig, 2005), and
film has gained a uniquely powerful ubiquity within
human culture (Shah, 2011), supported by pervasive
services and devices.
In this context, the huge amount of movies or
films we can access, and the important role of
emotions, make more pertinent the ability to access,
visualize and search movies based on their emotional
a
https://orcid.org/0000-0002-0306-3352
impact. As a whole and along time: “As the frames
move and tell a story, it is that movement which
emotionally connects you” (Shah, 2011), and this is
the journey, the path or emotional story, we want to
capture and support. On the other hand, rich content
of movies appeals to different senses, and the ubiquity
in their access creates opportunities to use different
devices, even in casual situations and environments,
suggesting a multimodal access. Such situations may
be when we want our current emotion taken into
account, or want to draw an emotional path to search
for in movies; possibly triggered by a music we are
listening to, that moves us and reminds us of movies
we like and how they made us feel; with the ability to
get us into a movie in serendipitous moments.
In this paper, we characterize and discuss main
motivation, challenges and approaches in this
scenario, then present and evaluate interactive means
to visualize and search movies based on their
emotional impact, dominant as a whole or along the
movie, with different models and modalities. In
particular through emotional highlights in words,
colors, emojis and trajectories, by drawing emotional
blueprints or through users’ emotional states in their
facial expressions, with the ability to get us into a
movie in serendipitous ways.
Caldeira, F., Lourenço, J. and Chambel, T.
Happy or Sad, Smiling or Drawing: Multimodal Search and Visualisation of Movies Based on Emotions Along Time.
DOI: 10.5220/0011896400003417
In Proceedings of the 18th International Joint Conference on Computer Vision, Imaging and Computer Graphics Theory and Applications (VISIGRAPP 2023) - Volume 2: HUCAPP, pages
85-97
ISBN: 978-989-758-634-7; ISSN: 2184-4321
Copyright
c
2023 by SCITEPRESS – Science and Technology Publications, Lda. Under CC license (CC BY-NC-ND 4.0)
85
2 BACKGROUND
In this section, we presents the most relevant concepts
and related work, as a background and framework for
our own work and contributions.
Emotions are complex sets of chemical and
neural reactions that form a pattern and play a
regulatory role, helping organisms to conserve life
(Damásio, 2021). The study of emotion is complex
and each emotional experience is personal and can
involve several emotions (Cabanac 2002, Plutchik,
2001). Scientists have been trying to understand and
explain their dynamics and arriving at several
different models and definitions (Kleinginna &
Kleinginna, 1981), with two main branches standing
out: Dimensional; and Categorical, with discrete
states that can also be represented in the dimensional
models. Among the most adopted: Russell’s
Circumplex represents emotions in a two-
dimensional space (VA) based on: Valence
(pleasantness, x-axis); and Arousal (intensity &
energy, y-axis) (Russell, 1980). Ekman’s (1992)
categorical model, based on the emotional facial
expressions recognized across cultures, has
happiness/joy, anger, fear, sadness, disgust and
surprise as its basic emotions. Plutchik’s (1980) 3D
model is both categorical and dimensional (polarity,
similarity, intensity), with 8 primary emotions:
Ekman’s 6, plus: anticipation, and trust, represented
around the center, in colors, with the intensity as the
vertical dimension (in 3 levels), that may also be
represented in 2D as external levels going outwards,
resembling a flower. The Geneva Emotion Wheel
(Sacharin et al., 2012) is an appraisal based model
(Scherer, 2009) organizing a set of 12 colored
emotions around a circle with valence (x-axis) and
control (y-axis) dimensions, and intensity decreasing
towards the circle center. As a way to represent and
express emotions, emojis have also become
increasingly popular, in computer-mediated
communication, and can be classified in valence and
arousal (Fischer & Herbert, 2021).
Besides representing and visualizing emotions,
doing so along time as movies progress and users
experience different emotional impact comes with
additional complexity and challenges. Timelines can
help, but do not capture the dimensions of the
emotion models; and these do not tend to support
time. In dimensional models like Russel’s, emotions
can be represented on the wheel along time (with dots
or small circles, drawing lines or painting), but in the
end it is not easy to distinguish the trajectory
followed, and it is not obvious to know if a long time
was spent on the same emotion. Related work on
trajectories and clustering can be of some help here.
Trajectories represent events over time and allow
to highlight fundamental information (Dodge et al.,
2008) like the path, speed, time at a certain point and,
through colors, how it evolved over time, e.g. through
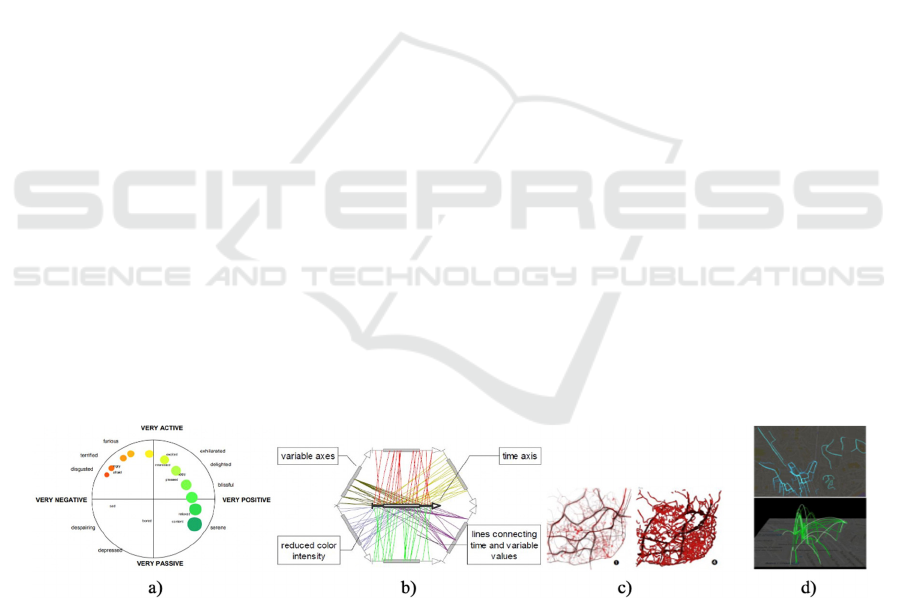
fading. FeelTrace (Cowie et al., 2000) (Fig.1a) lets
users track perceived emotional content of speech in
realtime, using an activation-evaluation space (similar
to arousal-valence), naturally circular, with neutrality
at the center. TimeWheel (Tominski, 2004) (Fig.1b)
also repesents time within a circular shape, though not
a wheel of emotions. In (Cruz & Machado, 2016)
(Fig.1c), the authors adopt a semantic figurative
metaphor of pulsing blood vessels to visualize Lisbon
traffic, seeking a provocative perspectives and trying
to invoke emotional responses. In (Jorge et al., 2014)
(Fig.1d), georeferenced videos were represented in
space
and time by their trajectories on maps,
Figure 1: Temporal representations: a) FeelTrace (Cowie et al., 2000): Plutchik’s colors used for axes extremes, and emotions
in circles with color interpolated by those on the axes. Time is represented as circles shrink gradually over time, providing a
visual indication of the way ratings changed. Interesting, but conflicts if circles’ size has another meaning; b) TimeWheel
(Tominski, 2004): Instead of a time wheel, it represents a central axis for time, and organizes around it the dependent axes or
variables (as multidimensional data), connecting by colored lines the variable with its corresponding time, for an intuitive
perception of time dependencies; c) Pulsing Blood Vessels (Cruz & Machado, 2016): Clots represent slow traffic and blood
vessels represent number of vehicles (making vessels thicker) and average speed circulating in the city (faster, shorter); d)
Video trajectories (Jorge et al., 2014): georeferenced videos were represented in space & time by their trajectories on maps,
emphasizing amount of videos in the different routes (by brighter & thicker blue lines), as well as the speed the trajectories
were filmed (higher arcs: more video shooting, thus slower pace), and their age (fading bright green of trajectories over time).
HUCAPP 2023 - 7th International Conference on Human Computer Interaction Theory and Applications
86

emphasizing amount of videos in the different routes,
speed the trajectories were filmed), and their age.
The ability to Search is paramount especially in
large information systems; it is usually based on
properties or keywords, and it is often possible to
browse the results in search, exploratory and
serendipity browsing (Chambel et al., 2013; Chen,
2010). Information Visualization (IV) may help to
deal with data complexity in intuitive and effective
ways to express meaningful information (Aigner et
al., 2011; Tufte, 1983). As such, IV goes hand in hand
with search, to provide good representations for the
results and browsing. Although this emotional
perspective has been gaining attention, most websites
and movie search and recommendation systems like
IMDB, Netflix or HBO, do not support emotions.
Instead, they search for films by actors, directors,
ratings, genre, etc; and recommend based on
popularity, most watched movies, and genre
similarities. We present both commercial and
research-based search systems with more
representative goals, as well as emotion-based search,
access and visualization interfaces.
MovieWall (Nefkens, 2017) is an interactive
browsing interface placing movies in a cluster of
posters and highlighting them according to search
criteria like genre, actor, producers or keywords.
Search by color is also relevant, especially when
mapping the colors to emotions. Multicolr (https://
labs.tineye.com/multicolr) searches images by up to
five color percentages, that the user can adjust.
ColorsInMotion (Martinho & Chambel, 2009)
explores and views videos based on dominant color
and movement (rhythm), with different visualization
and summarization approaches. As for movement and
trajectories, in SightSurfers (Serra et al., 2014) we
proposed multimodal interactive mobile interfaces to
search and access georeferenced videos based on
trajectories’ shape and speed, and by time. No
emotional dimension was explicitly supported for
these videos, but a potential for emotional impact
through increased engagement, sense of presence and
immersion (Ramalho & Chambel, 2013); and this
approach might inspire the search for movies with
specific emotional trajectories in a wheel. Movie
Clouds (Chambel et al., 2013) on the other hand used
color to index or associate tag clouds with content
(subtitles, emotions expressed in the subtitles, audio
events and music mood), or emotional impact (based
on sensors and Ekman’s emotions with Plutchik’s
colors, as in iFelt (Oliveira et al., 2011)) on the movie
timeline; and allowed painting a timeline to search for
2
AWESOME Project: Awareness While Experiencing and
Surfing On Movies based on Emotions
movies with that sequence or trajectory of content or
impact. MEMOSE (MEdia EMOtion SEarch) is
specialized in emotional search (based on tagging
pictures with eighteen emotions), along with content
tags (e.g. love and dogs) (Jorge et al., 2014). Movie
Emotion Map (Fig.2) goes further and aims to better
understand the emotional space of films along with
additional information (Cohen-Kalaf et al., 2021).
Figure 2: Movie Emotion Map overview (left) and search
by emotions filter (right) (Cohen-Kalaf et al., 2021): It
creates emotional signatures for each movie, based on the
words in IMDB reviews, and the Plutchik’s model (Bader
et al, 2017). Glyphs of different colors and intensities for
emotional values are mapped onto a 2D graph, allowing
users to search, view and interact with films according to
the % of desired emotion and criteria like rating, genre, etc.
Results: highlighted on map with title in red and movies
with most similar emotional signatures.
3 SEARCHING AND
VISUALIZING MOVIES
BASED ON EMOTIONS
This section presents main features to search and
visualize movies based on emotions being designed
and developed for the main web application of the
AWESOME
2
project. The emotional impact on
viewers is being assessed while they watch the
movies, to provide feedback and to catalog the
movies: based on biosensors like EEG, EDA, and a
webcam for facial expressions; and by having users
engaging in self-assessment and annotation of the
movies, using different models or interfaces like
categorical emotions, maniken and emotional wheel
(both based on the VA dimensions) (Nunes et al.,
2022); and articulating with other project tasks where
video content-based features are extracted mostly in
audio, subtitles and image.
This application is also integrating our previous
As Music Goes By (Moreira & Chambel, 2018;
2019), allowing users to search, visualize and
explore music and movies from complementary
perspectives of music versions, artists, quotes &
Happy or Sad, Smiling or Drawing: Multimodal Search and Visualisation of Movies Based on Emotions Along Time
87

movie soundtracks. In this paper, we emphasize a
perspective driven by Movies, by the name of As
Movies Go By. In the following sections, we present
and discuss our emotional model approach, that we
aim to keep rich and expressive, though effective,
flexible and easy to understand; and (by the order
they were evaluated by users) the movie search and
visualization features, based on their emotional
impact, as a whole and along time, with multimodal
interfaces for different contexts of use.
3.1 Emotion Models and
Representations
We are adopting Russel’s VA circumplex, or wheel,
as the central model, where we color the wheel and
also place categorical emotions (in words or emojis)
to help convey more meaning. When using EEG,
ECG or EDA sensors, the emotions are classified in
VA by our classifiers; when using the webcam, users’
facial expressions are recognized in relation to the
Ekman’s 6 basic emotions, and are most naturally
expressed by emojis. In any case, as long as the
categorical emotions are associated with a VA, and a
color map is defined for the wheel, representations
can be converted among each other (only rounded up
when the output precision is lower: e.g. VA to the
nearest categorical emotion). We provide some
default mappings (e.g. Plutchik or Geneva) to choose
from; and, for flexibility and personalization, are
developing an interface for customizable wheels,
defining: the categorical emotions, their VA, colors
(by individual emotion, or the whole wheel color map
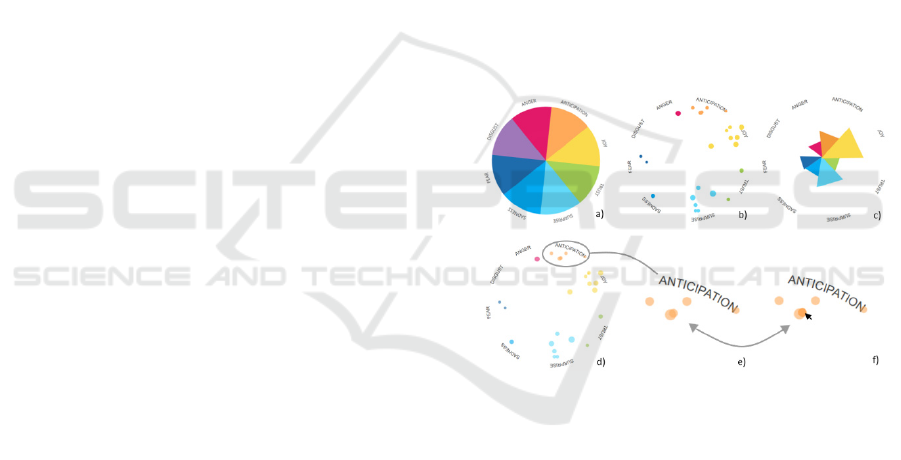
or image) and emojis. In Fig.5a), we exemplify the
wheel created for the VA and colors of the main 8
emotions in the Plutchik Model: 6 from Ekman, plus
Anticipation and Trust.
3.2 Multimodal Searching of Movies by
Emotional Impact
Several views were designed, for Search by
Dominant Emotion or by Emotional Trajectory, with
the output representation matching the input, in
different modalities; and giving access to the
individual movies in the results, where they can be
explored and watched along with their emotional
visualizations, as described in section 3.3.
The search menu is presented at the top of the
Homepage (Fig. 3 a), where the user can visualize the
trailer and information about a random movie, that
can be changed, also at random, by button click. The
objective of this feature is to introduce the users to
movies that they may not know or may want to revisit
and watch, as a flavour of surprise and serendipity.
The search methods based on emotions are available
in a menu and they trigger popup windows (Fig.3 b1-
c1, Fig.4 a1-b1).
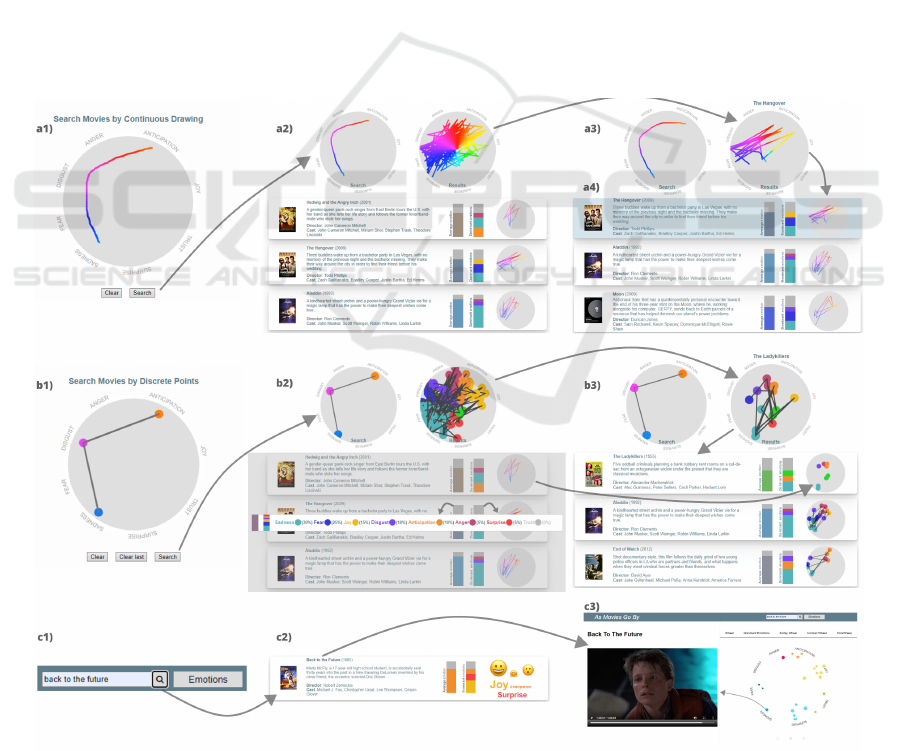
Search by Dominant Emotion can be done in
three ways: by categorical emotion words (Fig. 3 b1),
by emojis or facial expressions on camera (c1) and
by colors in wheel (d1). In all of them, the user
can choose up to five emotions by clicking (in
words, emojis or wheel) making them colorful,
and the emotion bar filled with colors (if words
and wheel) or emojis; the user can then adjust
the bar to the % amount desired for each
chosen emotion, working similarly to Multicolr
(https://labs.tineye.com/multicolr) that allows an
image search based on color where users can select up
to
five colors and adjust their respective percentages
Figure 3: As Movies Go By - Homepage (a) and Movie Search by Dominant Emotions: Search Queries: b1) Categorical
emotions in words, c1) Emojis and Camera, d1) Colors in Wheel; Search Results: b2) Categorical emotions in words with
complete movie information, dominant emotion with emojis, dominant emotion on wheel.
HUCAPP 2023 - 7th International Conference on Human Computer Interaction Theory and Applications
88
by dragging the borders. The emojis and categorical
emotion words chosen also change their size based on
the % they have.
For the emojis (Fig.3 c1) if a camera is available,
users may also click on the camera icon to turn it on,
and have their facial expressions analyzed in real time
and presented on the bar as %s of the emojis
representing Ekman’s emotions [12], a well-accepted
model, one explicitly associated with universal
emotional facial expressions, recognized across
cultures. In the wheel, circle size reflects the amount
of time it was clicked, and the % time the emotion
was felt, and can be adjusted in the bar. In this view,
the circles represent the nearest categorical emotion,
represented by colored sectors in the emotional model
in Fig. 5.1 (but could be customized differently (sec.
3.1)).
Search by Trajectory can be made in two ways:
by free drawing (continuous trajectory) (Fig.4 a1); or
by discrete points (Fig.4 b1). In the free drawing
search method, the user can draw a line on the wheel
with colors and VA associated with the emotions
along the wheel. This line represents a segment of
emotions which are searched, starting from the
beginning of each movie stored in the database. The
discrete points are very similar, but instead of
drawing a continuous line, users click on the wheel at
several points to create circles representing the
corresponding emotions’ VA, and connected by
straight lines to create a path.
Search Results (Fig.3 b2-d2 and Fig.4 a2-c2) by
default are represented in a format that matches the
input. When the user searches by emojis or categorial
emotions, the user input is displayed followed by a
list of the resulting movies (Fig.3 c2), with common
information (like title, synopsis, director and cast) and
emotional information, including: the three most
dominant emotions shown as tag clouds and emojis;
as a colored vertical bar (not to be confused with
timelines) ordered bottom-up by emotions’ %; and a
bar in one average color (a weighted average of the
dominant emotions). We chose the top 3 emotions to
display, reflecting some diversity but not too much,
like in a podium, and inspired by Miller’s research on
Figure 4: Movie Search by Trajectory: Search Queries: a1) with free drawing, b1) with discrete points; Search Results: a2)
with free drawing, b2) with discrete points; a3) Individual movie trajectory representation on wheel; a4) Highlighted movie
selected on wheel; b3)Movie trajectory replay; c1) search by title query; c2) and results list; c3) movie visualization.
Happy or Sad, Smiling or Drawing: Multimodal Search and Visualisation of Movies Based on Emotions Along Time
89
cognitive load (Miller, 1956), that suggests 7+-2
items (also taking into account that we have 3
different ways to present the same emotion (word,
color and emoji)).
We then noticed that besides podiums, three is a
number adopted e other selections, like the number of
reactions highlighted for posts and comments e.g. on
Facebook; so this choice appeals to familiarity).
When there are more than 3 emotions, the bars
display a gray section at the top for the remainder %.
The user can also click on one of these bars to display
a more complete emotional information about the
movie (Fig.3 b2). When the search is made by wheel,
the input is displayed along with another wheel
containing all the dominant emotions of the results in
the current page (Fig.3 d2); and below is displayed a
list with the respective results (10 per page) with a
smaller wheel representing the movie dominant
emotion, instead of the words and emojis.
The trajectory search results are displayed in a
similar way as the method described for the wheel:
the user input is displayed along with another wheel
that has all resulting trajectories (in the page) together
(Fig.4 a2,b2), and below in the list, each movie has
the correspondent trajectory. In the trajectory results
view, the user can also click on the results wheel to
replay each movie trajectory individually (Fig.4
a3,b3) and then click on one of them to scroll down
to the respective movie (Fig.4 a4). The movie
trajectory in each movie result can also be clicked to
animate the way its trajectory progresses,
segment by
segment (Fig.4 b3).
The user can also do a search by movie title, in
the top search bar (Fig.4 c1). In all results displayed,
regardless of the search method, the user can click on
the movie poster or title (Fig.4 c2) to proceed to its
visualization (Fig.4 c3), as described in section 3.3.
Multimodal Search: To support more natural
interaction and serendipitous moments, users may
search by drawing emotional highlights (as dominant
emotions) and trajectories (as emotional stories); and
by the user emotional expressions detected with a
camera (described above). And we are also exploring
the search by music being played, to access the music
detected, the movies featuring this music and those
with similar emotional impact (Caldeira et al., 2022).
3.3 Visualizing Movie Emotional
Impact Along Time
In the Movie Visualization page, the movie plays on
the left, side by side with the Emotional Views on the
right (selectable by the tabs above): the Emotional
Wheel in Fig.4 c3), and the other views in close-ups
in the next figures. In this case, Back to the Future is
playing, and the user just clicked on a circle
representing a sad emotion on the wheel and was
directed to the corresponding scene where this sad
emotion was felt: when Marty McFly, back in 1985,
thinks that Doc has died... If you haven’t watched the
movie, we won’t spoil it for you. But we will present
the visualizations.
In previous work, we visualized emotions with tag
clouds, charts and colors for categorical emotions;
colored circles and painted trajectories on the VA
wheel; and video timelines painted with colors
mapped from the wheel (that could be shown in
synchrony with the wheel (often on the side) when the
movie was playing, or inspected on hover) (Nunes et
al., 2022). But a couple of challenges remained for:
#1) the timing of emotional trajectories on the wheel:
they represent visited emotions, but how to represent
the time direction and speed?; #2) stationary or
overlapping spots: how to distinguish when the same
emotions are felt for a long time or again at different
times?
Figure 5: a) Wheel for the 8 central emotions in the Plutchik
Model; b) Emotion wheel; c) Cumulative Dominant
Emotions wheel; d) Emotion Wheel with transparent
overlaps; e) and f) changing transparency on hover.
The Emotion Wheel (Fig.5b) is used to represent
the emotions on the wheel in their VA positions (as
captured, for accuracy), with the circles adopting a
color in accordance to their position and identified as
the closest categorical emotion. Observe the total
number of circles of an emotion and their size and it
is possible to realize that the emotion Joy (although
with neighbour circles at different VA values) is the
dominant one. This can be confirmed in the
Cumulative Dominant Emotions Wheel (Fig.5c),
where each sector represents the frequency and how
much time (in %) the user felt each emotion,
addressing challenge #2. Challenge #1 only in play
mode, when it animates the evolution. The visible
HUCAPP 2023 - 7th International Conference on Human Computer Interaction Theory and Applications
90
colors are the ones that were felt; another option
would be all in the current model (for a more
complete contextualization), using transparency for
absent ones (in a way closer to Plutchik’s in
(Semeraro et al., 2021).
To address challenge #2 of overlapping emotions,
another view was created with the circles made more
transparent in relation to the normal wheel, to make
the overlaps noticeable. When hovering the circles,
they loose transparency, helping to check these
overlaps as the circles stand out (Fig.5e-f).
To help identify how time goes by (challenge #1),
when telling the user's emotional stories about
watching a movie by the represented paths on the
wheel: the emotional views may be watched in
realtime, in sync with the video being played (Nunes
et al., 2022); they can be Replayed a posteriori, e.g.
redrawing the circles, at a faster pace; and the final
representation on its own may also provide some
help.
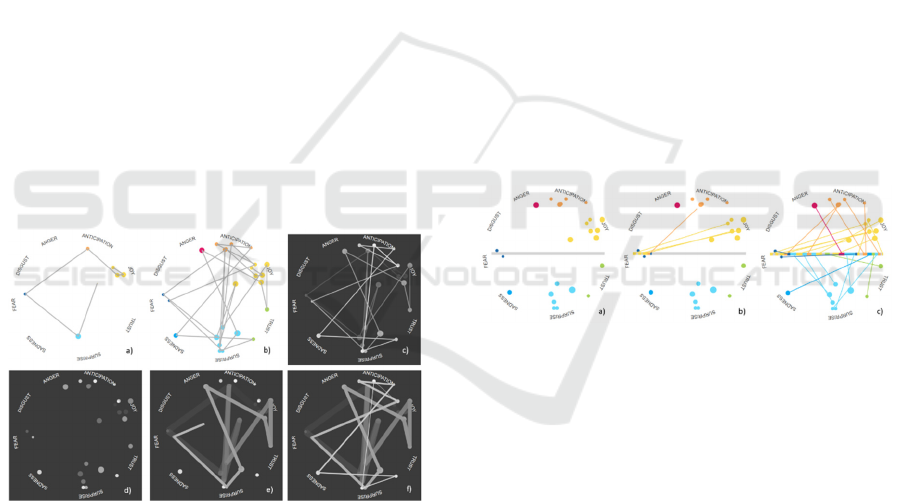
In the Emotion Wheel (Fig.6a-b), besides the
drawing of the emotion circles, a trajectory can be
represented by lines between circles, to reflect how
the emotions were felt along the movie. But it does
not address all the challenges inherent in #1 (e.g.
where it starts or how long spent) when in animation.
For stronger solutions, we adopted a couple of
metaphors in our design, depicted in Fig.6-7.
Figure 6: Emotional Trajectories: in Emotional Wheel: a)
trajectory in progress; b) final state; in X-Ray view: c) lines
d) circles; in Contrail view: e) in progress f) final state.
The X-Ray metaphor was adopted as a solution,
where the evolution is presented through the fading
of a single color on the path (whiter to darker gray),
that is, we ignore the colors of the wheel and focus on
the “skeleton”, highlighting the more recent (for
challenge #1). Transitions between discrete emotions
are represented by lines, and emotions by circles
(Fig.6c-d). In crossovers, when returning to a
previous emotion, the new circle on top will adopt the
most recent color. On the other hand, the circle size
(and the speed in the replay along time, in all the
views) reflects the amount of time the user has felt
that emotion. In this view, there is still the possibility
for the user to see the emotional evolution only
through circles (Fig.6d).
The Contrail metaphor (Fig.6e-f), refers to the
trail of condensation an airplane leaves behind when
it flies, due to differences in temperature, making it
possible to observe the recent path it took to where it
is. The trail is narrower close to the plane and is wider
and more disperse at more distant points, and this is
what is represented in Fig.6f from the oldest to the
newest emotion, reinforced with the color becoming
whiter and less transparent and the lines narrower,
making possible to visualize this passage of time. For
example, in Fig.6e the “plane” (the current time) is
located close to the middle of the wheel, and the line
there is the whiter, more opaque and narrower so far.
The Emotion TimeWheel addresses challenges:
#1 by mapping the emotions on the wheel onto the
timeline; and #2 by the size of the circles (influenced
by the total time that emotion was felt) and the length
of each segment on the timeline (the same emotion
possibly mapped more than once at different times),
making it possible to verify which emotions were felt
for the longest time and in what order.
Figure 7: TimeWheel: a) initial state in Replay; b) mid-way
representing timeline, identifying emotions; c) final state.
In Fig.7a) the visualization is in its initial state,
with only the circles and the empty timeline. In
Fig.7b), the animation is in progress and it can be
noticed that the sectors are being formed as a line
links each sector to the corresponding circle. In
Fig.7c), the animation is in its final state making it
possible to see the full emotional story of the movie.
4 USER EVALUATION
A user evaluation was conducted to assess perceived
usefulness, usability and user experience in the search
and interactive visualization features to access
movies based on emotions in As Movies Go By.
Happy or Sad, Smiling or Drawing: Multimodal Search and Visualisation of Movies Based on Emotions Along Time
91

4.1 Methodology
A task-oriented evaluation was conducted, with semi-
structured Interviews and Observation while the users
performed the tasks with the different features and
visualizations, after explaining the purpose of the
evaluation, asking some demographic questions and
briefing the subjects about the application. For each
task, we observed and annotated success and speed of
completion, errors, hesitations, and their qualitative
feedback through comments and suggestions. An
evaluation based on USE (Lund, 2001) for the tasks
was adopted, rating perceived Utility, Satisfaction in
user experience and Ease of use on a 5-point scale.
At the end, users were asked: to provide a global
appreciation of the application, through a USE rating;
to highlight the features or properties they appreciated
the most, and suggestions for what they would like to
see improved or added in the future; and to
characterize the application with most relevant
perceived ergonomic, hedonic and appeal quality
aspects, by selecting pre-defined terms (Hassenzahl
et al., 2000) that reflect aspects of fun and pleasure,
user satisfaction and preferences.
4.2 Participants
This study had 10 participants, 6 male, 3 female and
1 non-binary, 22-55 years old (Mean 33.4, StdDev
13.8); all of them have college education (3MSc,
7BSc), coming from diverse backgrounds (5
Computer Engineering, 1 Arts, 1 Mathematics, 1
Medicine/Radiology, 1 Administration and 1 Special
Education); all having moderate to high acquaintance
with computer applications, and this one being their
first contact with this application, allowing to
discover most usability problems and to perceive a
tendency in user satisfaction.
Participants watch movies weekly (5), monthly
(2), occasionally (2) or daily (1); using mostly
streaming platforms such as Netflix (9): weekly (4)
and daily (2); and television (9): weekly (4) and daily
(1); and cinema (9): occasionally (7) and monthly (2);
open access websites (5): occasionally (3), monthly
(1) and daily (1). Most of them search for information
about movies monthly (4) or occasionally (4), others
weekly (2), daily (0) and never (0). The criteria they
take into account to choose a movie: genre (9), actors
(7), directors (5), and most popular at the moment (5).
Almost everyone completely agreed (7) that viewers
can feel emotions by watching movies; and they
sometimes (4), never (3), a few times (2), and a lot of
times (1) use movies to change their emotional state.
When participants were asked to associate movie
genres with the emotions they represented, there was
a concensus (90%) associating comedy with joy, and
horror with fear.
Participants were also asked if they ever used any
movie or related application based on emotional
states. One computer engineer said he had used
Happify, aimed at wellbeing, encouraging users to
connect with their thoughts and feelings using
cognitive behavioral therapy skills (like savoring,
thank, aspire, give, empathize and revive) and
positive psychology; and Daylio, a diary and mood
tracking app based on mood (in 5 levels: rad, good,
meh, bad, awful), employing startegies like reminders
and achievements. These are somehow related, but
not using emotions per se or movies in a very explicit
way. The majority of participants never used one such
application, but would like to use, giving some insight
of what they would like to find, such as movie search
or recommendation according to users emotional
states, and automatic emotion recognition (something
that we are already exploring here and in other parts
of our work).
Table 1: USE evaluation of As Movies Go By.
Task U S E
T# Feature
M SD M SD M SD
1 Home: random movie
4.3 1.3 4.2 1.1 5.0 0.0
2 Search and Results (mean)
3.7 1.0 3.8 0.8 3.9 0.
7
2.1 by Emotions in Words
4.2 1.1 4.3 0.8 4.4 0.7
Results
4.1 1.3 4.1 1.1 3.9 0.9
2.2 by Emojis and Camera
3.9 1.2 4.6 0.7 3.7 0.7
Results
3.2 0.8 3.5 0.5 3.8 0.6
2.3 by Colors in Wheel
3.3 1.2 3.2 0.6 3.3 0.7
Results
3.5 1.4 3.5 1.2 4.4 0.7
2.4 by Trajectory Free Drawing
2.8 0.9 3.0 0.9 3.4 0.8
Results
3.2 0.9 3.2 1.1 2.7 0.8
2.5 by
Trajectory Discrete Points
4.3 0.8 4.3 0.9 4.7 0.5
Results
3.5 1.0 3.5 1.0 3.5 0.7
2.6 Search by Title
4.8 0.6 4.7 0.5 4.9 0.3
3 Movie Visualization (mean) 3.7 1.1 3.7 0.7 3.7 0.6
3.1 Wheel View
3.6 1.0 3.5 0.7 3.2 0.6
3.1.1 Overlays
3.8 1.4 3.4 0.7 3.4 0.7
3.1.2 Time and Trajectory
3.6 1.3 3.9 0.9 4.1 0.7
3.2 Dominant Emotions View
4.0 1.3 4.2 0.8 4.5 0.7
3.3 X-ray View
2.9 0.9 2.9 0.3 3.0 0.5
3.4 Contrail View
3.4 0.7 3.6 0.7 3.8 0.6
3.5 TimeWheel View
4.4 0.8 4.1 0.7 4.0 0.5
Global Evaluation
3.7 0.7 3.9 0.6 3.8 0.4
Total per Task (mean)
3.9 1.1 3.9 0.9 4.2 0.4
(Scale:1-5: lowest-highest); M=Mean; SD=Std. Deviation)
HUCAPP 2023 - 7th International Conference on Human Computer Interaction Theory and Applications
92

4.3 Results
The users finished almost all the tasks quickly and
without many hesitations, and generally enjoyed the
experience with the application. The results are
presented in tables 2 and 3 and explained in the text,
along with the comments made by the users.
Homepage. At this page, we asked the subjects ‘to
change the random movie and watch its trailer and
information’ to evaluate this interactive feature. We
had quite positive results for USE (U:4.3; S:4.2; E:5),
also presented on table 1. Users found the feature
“very good to suggest movies” and “a good way to
choose movies when you’re not sure what to watch”.
Another user said it could be interesting to have a
movie randomizer filtered by dominant emotion,
since this emotional information is presented.
Search and Results. For this part of the application,
we created tasks for the 6 methods of searching
movies and their respective results.
In T 2.1, users were asked ‘to search movies by
dominant emotions in words with the input of Joy
(79%) and Sadness (21%)’. Their response was very
good with majority completing the task quickly. Most
of the users found this search method “easy to execute
and useful” with a couple saying that “percentages
were too specific”, i.e. no need to be so accurate,
though recognizing that it is important to specify
dominance and this is a good way to do that; or that
the interface could “have more emotions to choose
from”, which is aligned with what we are doing,
making the emotion model customizable (section
3.1). Overall, the opinion on this task was quite
positive (U:4.2; S:4.3; E:4.4). Regarding its results,
users were asked ‘to name the most and least
dominant emotions in the first result presented’. They
found the way the results were presented “interesting,
especially the emotional information”, and concluded
very quickly what was the most dominant emotion.
When trying to find the least dominant emotion, the
users struggled a bit at first, as they did not know they
had to click the dominant emotions’ bar (having more
than 3 dominant emotions, as indicated by the gray
bar on top); then it was ok, and the rating was (U:4.1;
S:4.1; E:3.9).
In T2.2, the users had to ‘turn on the camera and
express the emotions of Joy and Surprise in their
faces’; and ‘change the values to 84% and 16%
respectively’ in the emojis (and these could also be
selected without the camera). The reaction was very
positive with comments like: “very interactive with
the user”, and “loved this functionality, would like to
see in future apps”. The only downside was that
“some emotions are difficult to represent with facial
expressions”, especially when thinking about a
broader set (in the ones used, 6 are from Ekman,
corresponding to emotions that are easily recognized
in facial expressions, even across cultures; Trust and
Anticipation (added by Plutchik) being more
challenging to express). But overall was a “very good
experience” (U:3.9; S:4.6; E:3.7). The results were
presented in a similar way as the previous search
method, but here the participants were asked to ‘say
which emoji corresponds to each emotion and to
interpret the Average Emotion bar’. Most of them
could identify the emotion of each emoji with ease,
but several failed when interpreting the average
emotion (something that they were not familiar with),
then deeming it “not very useful”. Though one person
thought that “it’s useful to know which type of movie
it’ll be”. These results got (U:3.2; S:3.5; E:3.8).
Task T 2.3 was the last task to search for
Dominant emotions, this time by Colored circles in a
Wheel. The users were asked to ‘draw two circles on
the wheel (presented to them in an image), by clicking
on the wheel, one around the Joy emotion area and
another around the Trust area’ (color would be
automatically assigned based on the position), and
then ‘adjust the percentages to 78% and 22%
respectively’. Generally, the participants thought that
“the previous methods were more intuitive than this
one” because “when using it for the first time, it’s not
easy to know how it works” (U:3.3; S:3.2; E:3.3). In
the results, the users had ‘to identify the dominant
emotion in the wheel’, and they found it “easy to
understand” but “the results wheel, on itself, makes it
more difficult if movies have emotions in overlapping
positions”, something we are already dealing with
and testing in other views. (U:3.5; S:3.5; E:4.4).
In the first Trajectory Search method, by Free
Drawing in T 2.4, the users were prompted with an
image with a continuous line representing ‘an
emotional trajectory, within a movie, that they had to
draw’. Overall, the participants found it reasonably
satisfactory and easy to use (S:3.0; E:3.4); but not so
useful (U:2.8), a few saying: “it’s not common or
mainstream”; “it’s not relevant to draw the trajectory
this way”. It was easier for them to think of the
individual emotions, even when in sequence (next
task), although it may be something they get to
appreciate more as they use it. In the results view,
they had to ‘observe each trajectory individually in
the results wheel (at the top) and choose one, then
replay the trajectory of the chosen movie’. The
participants struggled to understand how it worked,
hence the E score (U:3.2; S:3.2; E:2.7), because
“there is no indication that the wheels can be clicked
Happy or Sad, Smiling or Drawing: Multimodal Search and Visualisation of Movies Based on Emotions Along Time
93

to replay the trajectories”; and “it’s not useful to have
all trajectories mixed up”; the users also pointed that
“each movie wheel in the list should have the emotion
labels, as presented in the search and results wheels”,
not presented to make the list lighter. But they liked
trajectories shown in sequence, and the list of results.
In the second trajectory search method, by
Discrete Points in task T 2.5, users had to do a similar
search as before but with a different image prompt
(with circles for each emotion in the trajectory) they
drew by clicking. They found it more “appealing and
simple” and “more intuitive and satisfying than the
free drawing method”; “it’s the best way to represent
emotions on a wheel [separately]” (U:4.3; S:4.3;
E:4.7). In the results, users had to do the same as in
the previous view, and the feedback was very similar,
but “[emotions] individually are much easier to
understand than the free drawing”, one said, as he was
“used to thinking of emotions separate from each
other”, getting higher scores (U:3.5; S:3.5; E:3.5).
In the last search, T 2.6, users had to ‘search for
the movie Back to the Future and proceed to its
visualization’. This was the quickest and easiest task
because it is the
usual way to search for something in
most applications (U:4.8; S:4.7; E:4.9). The only
suggestion was to include “an auto complete”,
something common in most applications, although
not our focus in this work.
Movie Visualization. In T 3.1, users were asked to
‘describe what they see in the Emotion Wheel
visualization, namely the emotions that were felt; say
if they were mostly more positive or negative, and
more intense or calm’, and finally, they were asked to
‘choose an emotion and visualize the corresponding
movie scene’ (U:3.6; S:3.5; E:3.2). In general, users
completed the task in the expected time, only
hesitating a bit when accessing the movie scene, as
they were not familiar with the visualization and were
not sure if they should click them; then finding this
feature very interesting and useful.
In task 3.2, users were to ‘identify the dominant
emotion on the Emotion Wheel’, and then to do the
same, to compare, in the cumulative Dominant
Emotions Wheel; where they found it easier to do.
Here, they also had to ‘identify which emotion was
absent and which ones had the same level of
occurrence’. Overall opinion was quite positive
(U:4.0; S:4.2; E:4.5), with some users considering
the visualization visually appealing and easy to
understand.
Back to the Emotion Wheel view, in task 3.1.1,
users had to ‘identify overlapping emotions (with
similar VA felt more than once); which emotion was
felt the longest; and which one was felt more often”.
The overlaps were well identified in a reasonable
time, but some users did not find it obvious at first
that they could interact with overlapping circles (that
would change transparency level on hovering) to
inspect these emotions; although the transparency
hinted where the overlaps were. So, satisfaction and
ease of use were scored below its usefulnessl (U:3.8;
S :3.4; E:3.4). Still on this view, in task 3.1.2, the
emotional path of the film is presented, or replayed,
through an animation with lines forming between
circles from the first emotion to the last. It was asked
to ‘watch and identify emotions in this path’, which
was quite easy paying attention to the animation, but
not so easy at the end to know the direction time goes
by, the first and last one. In general, they considered
it a good feature (U:3.6; S:3.9; E:4.1), highlighting:
“To Replay this animation is very helpful”.
In task 3.3, the emotional path is represented using
the metaphor of the X-Ray, and the users are asked
‘which is the dominant emotion; the one felt for the
longest time; and again which ones are the first and
last emotion’. This visualization did not please users
so much (U:2.9; S :2.9; E:3.0), lacking the emotion
colors and due to the confusion caused by the
overlapping lines that are more visible here; they
would prefer the circles only, that already have a
color hinting the order (in grayscale, as they
discovered), and the replay animation to show from
the oldest to the most recent emotion. One user
mentioned not liking this view for being so
monochromatic; and interestingly, the radiologist
doctor was the participant who understood and
appreciated this view better; which has a purpose to
temporarily highlight the emotional evolution along
time, not to be used instead of the colored view. Like
x-rays are not used instead of pictures, but to visualize
otherwise hidden properties.
On the other hand, in task 3.4, the visualization
using the metaphor of the Contrail of an airplane in
the sky pleased the users much more (U:3.4; S:3.6;
E:3.8). They found it “very interesting”, “out of the
box”, “easier to understand”, even if the colors are
quite similar to the X-Ray, changing width, color and
transparency of the lines along time (narrower and
less transparent in the most recent emotions). The
users were again asked to ‘identify the dominant
emotion; the one felt for the longest time; which ones
are the first and last emotion, using replay if
necessary’; and some comments included: “I liked the
color change along with the change in width”;
“Pleasant viewing”; “Replay is a nice feature”; and
suggesting that the older lines did not need to be so
transparent to be better noticed.
HUCAPP 2023 - 7th International Conference on Human Computer Interaction Theory and Applications
94

In task 3.5, on the Emotion TimeWheel View, the
emotional path or story of the film is presented with
all emotions related to a timeline. The users were
asked to ‘identify the dominant emotion; which one
was felt for the longest time; which one was felt more
often; in which part of the film there was a greater
concentration of the emotion joy; and which was the
first and last emotion to be felt’. Overall, this was
considered by many “the best view to answer all the
questions asked in the Movie Visualization task list”,
and especially the ones dealing with temporal aspects
(U:4.4; S:4.1; E:4.0). Other comments included: “the
best way to demonstrate the emotional path”;
“aesthetic and very easy to understand”. Suggestions:
"The timeline could fill in automatically as we watch
the movie”; “It could allow to go to the movie scenes
at those times”, which we already have in other
features (Nunes et al., 2022) not evaluated here,
synchronizing and indexing all the views with the
movie being played.
Global Evaluation. Overall, users found the
application and the evaluated features quite
interesting, innovative and visually appealing.
Although there were some difficulties at first in some
of the most unusual visualizations, for the participants
less familiar with this kind of representations, ease of
use was also mentioned, and was even rated higher in
the mean USE values of all the features. The global
USE classification (U:3.7; S:3.9; E:3.8), rated in
separate by the users, is close to the mean value
calculated from the features’ ratings (U:3.9; S:3.9;
E:4.2), reflecting that in general users found it useful,
easy, and quite satisfactory to use these interactive
features; and had a good experience. When explicitly
asked to refer to the features that they appreciated the
most, they mentioned: the random movie display; the
TimeWheel; the search by facial expressions using
the camera (the one they mentioned the most), but
also by emojis, word percentages, and by discrete
points; the view of the dominant emotions; the
contrail; and the connection of the circles to the
scenes of the movie (alowing to navigate to the video
scenes taking the emotions into account). For global
suggestions, they repeated a couple that were already
mentioned in the tasks, described above.
To summarize this appreciation, users classified
the application with most relevant (as many as they
found appropriate) perceived ergonomic (8 positive +
8 negative (opposite)), hedonic (7+7) and appeal
(8+8) quality aspects in (Hassenzahl et al., 2000).
Interesting was the most chosen term.
Comprehensible, Pleasant, Clear, Trustworthy
Original and Innovative were also chosen by half or
more
subjects. Just one negative term was chosen:
Table 2: Quality terms users chose for As Movies Go By.
Terms type #
Terms t
yp
e #
Interesting E 10 Controllable E 3
Comprehensible H 8 Exciting H 3
Pleasant A 8 Exclusive H 3
Clear E 6 Impressive H 3
Trustworthy E 6 Aesthetic A 3
Innovative H 5 Attractive A 3
Original H 5 Complex E 3
Good A 4 Simple E 2
Motivating A 4 Inviting A 2
Sympathetic A 4 Desirable A 2
Inviting A 3 Familiar A 1
H:Hedonic; E: Ergonomic; A: Appeal;
note that: Simple (+) vs Complex (-)
Complex (3 times), very close to the opposite positive
term: Simple (2 times). Complex is also associated
with being rich in terms of the features that are
provided, and these were perceived as
Comprehensible and Clear. The chosen terms are well
distributed among the (H)edonic, (E)rgonomic and
(A)ppeal qualities; with more H and E terms in the
top positions, but more A terms overall. These results
confirm and complement the feedback from the other
evaluation aspects and user comments.
5 CONCLUSIONS AND
PERSPECTIVES
The proposed interactive mechanisms to search and
visualize movies based on dominant and emotional
impact along the movie, with different models and
modalities, extended previous features and addressed
challenges and open issues in promising ways.
Most users found the application and the
evaluated features quite interesting, comprehensible
and pleasant, and also clear, trustworthy, innovative
and original. The USE ratings reflected that in general
users found the interactive features useful, easy, and
quite satisfactory to use; in spite of the initial
difficulties and lower scores in some of the most
unusual visualizations. Different features excel in
different situations, and some have a more supporting
role than others; e.g. views to highlight emotions
overlapping, or the order when they were felt, at the
expense of the emotion color; suggest they could
cohexist and be used with a purpose, in complement.
Other examples: the TimeWheel was considered
the best view to deal with the temporal aspects,
although it uses some space in the wheel that is
important to represent the emotions (the Emotion
Wheel being better for that); the search by facial
Happy or Sad, Smiling or Drawing: Multimodal Search and Visualisation of Movies Based on Emotions Along Time
95

expressions using the camera was the most
highlighted feature, for the modality and the
automatic detection, but it is limited in the variety of
expressions recognized (6 by Ekman at the moment),
whereas emojis can represent a much larger set, and
the users did also mention they would like to have
more emotions; the X-Ray metaphor has an
interesting potential, but was superseded by the
Contrail that in a way extends the same concept with
a stronger representation.
The pragmatism, clarity and beauty of the
summarization in the dominant emotion view was
also very much appreciated, the top for this purpose;
and they enjoyed drawing trajectories with discrete
points. They also liked the connection of the circles
to the movie scenes, alowing to access them based on
emotions, and to increase emotional awareness; and
the replay feature, to animate the emotion
visualizations and watch in a short time how the
emotional impact evolved. Actually these two
features exist in most views, but were tested once or
twice in the context of other features, so they did not
get and explicit score, that would for sure be quite
high. Finally, from the start, users really enjoyed the
random movie display as they enter the homepage,
adding to the flavour of surprise and serendipity.
Future work includes refining, based on the
evaluation and user feedback, and further extending
the interactive visualization and search features, to
provide useful and interesting ways to perceive and
find movies that we value and can enrich our
experience, increase our emotional awareness, and
ability to even regulate our emotional states. Search
based on current emotions using other sensors and
VA can also be explored to suggest how to reinforce
or balance into desired states. Recommendation
techniques based on affective states and impact,
preferences and access patterns can help in this
direction (Tkalcic, 2011). Scale is also an important
aspect to keep in mind, either in the amount of
movies, and the amount of emotions detected or
annotated in each movie; although filtering most
relevant and e.g. listing by pages, highlighting top 3
emotions and aggregating dominant properties, can
already help. Other media and modalities (Ramalho
& Chambel, 2013; Serra et al., 2014) can also be
explored for accessibility and to increase awareness
even when not relying on the visual dimension, e.g.
when listening to a talk or a song, or just focusing the
visual attention on the movie, for a more immersive
experience.
ACKNOWLEDGEMENTS
This work was partially supported by FCT through
funding of the AWESOME project, ref. PTDC/CCI/
29234/2017, and LASIGE Research Unit, ref. UIDB
/00408/2020 and ref. UIDP /00408/2020.
REFERENCES
Aigner, W, , Miksch, S., Schumann, H., Tominski, C.
(2011). Visualization of time-oriented data (Vol. 4).
London: Springer.
Arriaga, P., Alexandre, J., Postolache, O., Fonseca, M. J.,
Langlois, T., Chambel, T. (2019). Why Do We Watch?
The Role of Emotion Gratifications and Individual
Differences in Predicting Rewatchability and Movie
Recommendation. Behavioral Sciences, 10(1), 8.
Aurier, P., Guintcheva, G. (2015). The Dynamics of
Emotions in Movie Consumption: A Spectator-Centred
Approach. Int. Journal of Arts Management 17 (2).
Bader, N., Mokryn, O., Lanir, J. (2017). Exploring
emotions in online movie reviews for online browsing.
In 22nd international conference on intelligent user
interfaces companion. 35–38.
Cabanac, M. (2002). What is emotion?. Behavioural
processes, 60(2), 69-83.
Caldeira, F., Lourenço, J., Tavares Silva, N., & Chambel,
T. (2022). Towards Multimodal Search and
Visualization of Movies Based on Emotions. In ACM
International Conference on Interactive Media
Experiences (IMX 2022), 349-356.
Card, S. K., Mackinlay, J. D., Shneiderman, B. (1999).
Information visualization. Readings in information
visualization: using vision to think, 1–34.
Chambel, T., Langlois, T., Martins, P., Gil, N., Silva, N.,
Duarte, E. (2013). Content-based search overviews and
exploratory browsing of movies with MovieClouds.
International journal of advanced media and
communication 5, 1 (2013), 58–79.
Chen, Y-X. (2010). Exploratory browsing: enhancing the
browsing experience with media collections. Ph. D.
Dissertation. Citeseer.
Cohen-Kalaf, M., Lanir, J., Bak, P., Mokryn, O. (2021).
Movie emotion map: an interactive tool for exploring
movies according to their emotional signature.
Multimedia Tools and Applications, 81(11), 14663-84.
Cowie, R., Douglas-Cowie, E., Savvidou, S., McMahon, E.,
Sawey, M., and Schroder, M. (2000). “'FEELTRACE':
An instrument for recording perceived emotion in real
time”. In ISCA tutorial and research workshop (ITRW)
on speech and emotion.
Cruz, P., Machado, P. (2016). Pulsing blood vessels: A
figurative approach to traffic visualization. IEEE
Computer Graphics and Applications, 36(2), 16-21.
Damásio, A. (2021). Feeling & Knowing: Making Minds
Conscious, Pantheon.
HUCAPP 2023 - 7th International Conference on Human Computer Interaction Theory and Applications
96

Dodge, S., Weibel, R., Lautenschütz, A-K. (2008). Towards
a Taxonomy of Movement Patterns. Information
Visualization, 7(3–4), 240–252.
Ekman, P. (1992). An argument for basic emotions.
Cognition & Emotion 6, 3-4, 169–200.
Fischer, B., Herbert, C. (2021). Emoji as Affective
Symbols: Affective Judgments of Emoji, Emoticons,
and Human Faces Varying in Emotional Content,
Front. Psychol., 20 April.
Hassenzahl, M., Platz, A., Burmester, M, Lehner, K.
(2000). Hedonic and Ergonomic Quality Aspects
Determine a Software’s Appeal. ACM CHI 2000.
pp.201-208.
Jorge, A., Serra, S., Chambel, T. (2014). Interactive
Visualizations of Video Tours in Space and Time.
In 28th Int. BCS Human Computer Interaction
Conference (HCI 2014), pp. 329-334.
Kleinginna, P. R., Kleinginna, A. M. (1981). A categorized
list of emotion definitions, with suggestions for a
consensual definition. Motivation and emotion, 5(4),
345–379.
Knautz, K., Siebenlist, T., Stock, W. G. (2010). Memose:
search engine for emotions in multimedia documents.
In ACM SIGIR. 791–792.
Lund, A. M. (2001). Measuring usability with the USE
questionnaire. Usability and User Experience, 8(2).
Martinho, J., Chambel, T. (2009). ColorsInMotion:
interactive visualization and exploration of video
spaces. In 13th International MindTrek Conference:
Everyday Life in the Ubiquitous Era. 190–197.
Miller, G. A. (1956). The magical number seven, plus or
minus two: Some limits on our capacity for processing
information. The Psychological Review, 63, 81-97.
Moreira, A., Chambel, T. (2018). As Music Goes By in
versions and movies along time. In ACM International
Conference on Interactive Experiences for TV and
Online Video (TVX 2018), pp. 239-244.
Moreira, A., Chambel, T. (2019). This Music Reminds Me
of a Movie, or Is It an Old Song? An Interactive
Audiovisual Journey to Find out, Explore and Play. In
VISIGRAPP (1: GRAPP). 145–158.
Nefkens, M.W. (2017). MovieWall: A Novel Interface
Concept for Visual Exploration of Large Movie
Collections. Master’s thesis.
Nunes, L., Ribeiro, C., Chambel, T. (2022). Emotional and
Engaging Movie Annotation with Gamifica-
tion. VISIGRAPP (2: HUCAPP) 2022: 262-272.
Oliveira, E., Martins, P., Chambel, T. (2011). Ifelt:
accessing movies through our emotions. In 9th
European Conference on Interactive TV and Video.
105–114.
Plutchik, R. (1980). A general psychoevolutionary theory
of emotion. In Theories of emotion. Elsevier, 3-33.
Plutchik, R. (2001). The nature of emotions: Human
emotions have deep evolutionary roots, a fact that may
explain their complexity and provide tools for clinical
practice. American scientist 89(4), 344–350.
Ramalho, J., Chambel, T. (2013). Immersive 360 mobile
video with an emotional perspective. 2013 ACM
international workshop on Immersive Media
Experiences.
Russell, J. A. (1980). A circumplex model of affect.
Journal
of personality and social psychology, 39(6), 1161–
1178.
Sacharin, V., Schlegel, K., Scherer, K. R. (2012). Geneva
emotion wheel rating study, Archive ouverte UNIGE.
Scherer, K. R. (2009). The dynamic architecture of
emotion: Evidence for the component process model.
Cognition and emotion, 23(7), 1307-1351.
Semeraro, A., Vilella, S., Ruffo, G. (2021). PyPlutchik:
Visualizing and Comparing Emotion-Annotated
Corpora, Plos one, 16(9), e0256503.
Serra, S., Jorge, A., Chambel, T. (2014). Multimodal
Access to Georeferenced Mobile Video through Shape,
Speed and Time. In 28th Int. BCS Human Computer
Interaction Conference (HCI 2014). 347–352.
Serra, V., Chambel, T. (2020). Quote Surfing in Music and
Movies with an Emotional Flavor. In VISIGRAPP (2:
HUCAPP). 75–85.
Shah MBE DL,V. 2011. The Role of Film in Society, Thou-
ghtEconomics, 19.6.2011. https://thoughteconomics
.com/the-role-of-film-in-society/
Tkalcic, M., Kosir, A., Tasic, J. (2011). Affective
recommender systems: the role of emotions in
recommender systems. In The RecSys 2011 Workshop
on Human Decision Making in Recommender Systems.
Citeseer, 9–13.
Tominski, C., Abello, J., Schumann, H.. (2004). Axes-
based visualizations with radial layouts. In 2004 ACM
symposium on Applied Computing, 242-1247.
Tufte, E. (1983). The visual display of quantitative
information. Graphics Press LLC.
Uhrig, S. C. (2005). Cinema is good for you: the effects of
cinema attendance on self reported anxiety or
depression and 'happiness' (No. 2005-14). ISER
Working Paper Series.
Zhang, S., Tian, Q., Huang, Q., Gao, W., Li, S. (2009).
Utilizing affective analysis for efficient movie
browsing. In 16th IEEE International Conference on
Image Processing (ICIP). IEEE, 1853–1856.
Happy or Sad, Smiling or Drawing: Multimodal Search and Visualisation of Movies Based on Emotions Along Time
97
