
CopAS: A Big Data Forensic Analytics System
Martin Macak
1
, Tomas Rebok
2
, Matus Stovcik
1
, Mouzhi Ge
3
, Bruno Rossi
1
and Barbora Buhnova
1
1
Faculty of Informatics, Masaryk University, Brno, Czech Republic
2
Institute of Computer Science, Brno, Czech Republic
3
Deggendorf Institute of Technology, Deggendorf, Germany
buhnova@mail.muni.cz
Keywords:
Network Security, Network Traffic Analysis, Forensics Analysis, Big Data, Insider Attack Detection.
Abstract:
With the advancing digitization of our society, network security has become one of the critical concerns for
most organizations. In this paper, we present CopAS, a system targeted at Big Data forensics analysis, allowing
network operators to comfortably analyze and correlate large amounts of network data to get insights about
potentially malicious and suspicious events. We demonstrate the practical usage of CopAS for insider attack
detection on a publicly available PCAP dataset and show how the system can be used to detect insiders hiding
their malicious activity in the large amounts of data streams generated during the operations of an organization
within the network.
1 INTRODUCTION
Insider attacks are one of the most significant cyberse-
curity issues in organizations (Homoliak et al., 2019;
Salem and Stolfo, 2011). Their impacts include finan-
cial loss, disruption to the organization, loss of repu-
tation, and long-term impacts on organizational cul-
ture (Probst et al., 2010), which makes them impor-
tant to study. Since insiders are authorized employ-
ees with access to the organization’s resources and the
knowledge of its internal processes, their attacks are
significantly more challenging to detect than external
ones (Macak et al., 2022; Hong et al., 2009).
Existing solutions for detecting insider attacks
show that Big Data involved in the analysis is a ma-
jor challenge (Gheyas and Abdallah, 2016; Liu et al.,
2018). It often relies on analyzing large volumes
of data (e.g., network traffic) over a long time span,
making the analysis very time-consuming and chal-
lenging. This is especially true when network traffic
data captured in PCAP files are analyzed on a per-
packet basis using tools like Wireshark or similar ap-
plications. An alternative to these per-packet analy-
ses is an analysis at the level of individual network
flows. Here, the set of packets belonging to a single
network connection is described by a single network
flow record with appropriate descriptive information
(e.g., source and destination IP address, source and
destination port, protocols used, amount of data trans-
ferred, and timestamps). Analyzing entire network
flows based on their descriptive information is thus
much more comfortable from the forensic analyst’s
point of view, allowing them to gain so-called situa-
tional awareness more easily.
Since the extraction of network flows from PCAP
files requires some preprocessing (e.g., correcting any
problems in the PCAP files, merging for connections
captured in multiple files, appropriate flow extrac-
tion and description, and indexing in an appropriate
database), this paper presents the CopAS system that
we have developed intending to ameliorate and sim-
plify this process for effective support of police in-
vestigation. CopAS combines a set of existing tools
with several handy features and a user-friendly graph-
ical interface, allowing the analyst to focus on the data
analysis itself rather than on the preparation and con-
figuration of the infrastructure and preprocessing con-
figuration, making it a unique tool for complex, more
effective and straightforward network captures analy-
sis.
In this paper, we present CopAS architecture and
features and demonstrate its usefulness for detecting
insider cyberattacks in an organization’s network. We
also examine where to draw the line between the au-
tomated preparation of the analysis and the analysis
that the investigator wants better control over.
We provide the following main contributions in
this paper:
150
Macak, M., Rebok, T., Stovcik, M., Ge, M., Rossi, B. and Buhnova, B.
CopAS: A Big Data Forensic Analytics System.
DOI: 10.5220/0011929000003482
In Proceedings of the 8th International Conference on Internet of Things, Big Data and Security (IoTBDS 2023), pages 150-161
ISBN: 978-989-758-643-9; ISSN: 2184-4976
Copyright
c
2023 by SCITEPRESS – Science and Technology Publications, Lda. Under CC license (CC BY-NC-ND 4.0)

Table 1: Platforms for digital forensics analysis.
Year Platform Focus
2017 N/A (Marciani et al., 2017) Big Data link analysis investigations
2013 N/A (Kumar and Hanumanthappa, 2013) Suspicious network traffic analysis
2012 XplicoAlerts (Gacimartın et al., 2010) Crime investigation of network traffic
2010 N/A (Lee et al., 2010) Suspicious network traffic analysis
2007 CrimeLink Analysis Explorer (Schroeder
et al., 2007)
Link analysis investigations
2005 CrimeNet Explorer (Xu and Chen, 2005) Criminal Network Analysis and visualization
1. The provision of the CopAS platform for the sup-
port of digital forensic analysis integrating and
combining several tools for Big Data network
analysis. The platform is free to use for any in-
terested party
1
;
2. Demonstration of the application of CopAS
to support forensic analysis for insider at-
tack detection by using the CSE-CIC-IDS2018
dataset (Sharafaldin et al., 2018);
The remainder of the paper is structured as fol-
lows. Section 2 provides an overview of work on in-
sider attack detection and related Big Data platforms.
In Section 3, our CopAS platform is introduced and
described. Section 4 demonstrates CopAS in detect-
ing the insider attack, followed by the discussion in
Section 5. Section 6 concludes the paper.
2 RELATED WORK
Two main directions that are relevant to our work
are network-based insider attack detection approaches
and platforms for digital forensic analysis.
Approaches that use a network-based detection
of insider attacks are Lv et al. (Lv et al., 2019)
and Kholidy et al. (Kholidy, 2020), which reuse a
dataset proposed in previous research in Kholidy et
al. (Kholidy and Baiardi, 2012). Other approaches
use host-based analysis, for example, MS Word com-
mands (El Masri et al., 2014), OS activities (Salem
et al., 2008), audit logs (Macak et al., 2020), and
UNIX commands (Yu and Graham, 2006; Kim and
Cha, 2005). However, the practical usage of network
traffic Big Data for insider attack detection remains an
unexplored challenge (Gheyas and Abdallah, 2016;
Liu et al., 2018).
1
Publicly available at https://gitlab.ics.muni.cz/bigdata/
CopAS
Over time, many platforms for digital forensic
analysis (Table 1) emerged to provide support for Big
Data Analysis and provide ways to integrate and link
knowledge to support police investigation and secu-
rity events (Marciani et al., 2017; Schroeder et al.,
2007). The needs of such platforms are mainly to
integrate a plethora of tools/systems available (such
as Pig, Hadoop, Cassandra, Zookeeper, Lucene, and
Mahout) and different types of analysis required for
big digital forensics analysis, such as link analysis to
connect knowledge from different sources (e.g., (Mar-
ciani et al., 2017; Schroeder et al., 2007)) or text/-
data mining approaches supported by machine learn-
ing (Pramanik et al., 2017).
CrimeLink Analysis Explorer (Schroeder et al.,
2007) is a platform that provides support for link anal-
ysis investigations, supporting co-occurrence analy-
sis, the shortest path algorithm, and a heuristic to
identify the importance of associations. The platform
was developed as an ad-hoc solution based on a man-
agement system supported by a database connection
and modules for co-occurrence weights, a heuristic
module, an association path module, and a graphical
user interface. However, it was not meant to scale
over Big Data but rather to look into the benefits of
having a platform for knowledge integration.
Another platform for digital forensics analysis
was proposed by (Marciani et al., 2017). It is a
data stream processing platform based on the Apache
Flink Big Data framework, Apache Kafka for event
processing, and Neo4J for data storage and visual-
ization. The experimental evaluation has shown that
the platform was effective for criminal link analy-
sis, reaching an accuracy of 82% in linking different
sources.
CrimeNet Explorer (Xu and Chen, 2005) is
a framework for automated criminal network analysis
and visualization. It allows to build, analyze, and vi-
sualize crime networks based on communication be-
CopAS: A Big Data Forensic Analytics System
151

tween involved entities. The platform is based on so-
cial network creation from crime databases, cluster-
ing of nodes, structural analysis, and visualization of
network partitions.
Other platforms for packet inspections were de-
veloped on top of existing forensics network analy-
sis tools. One example is XplicoAlerts (Gacimartın
et al., 2010), built on top of the Xplico tool (Costa
and De Franceschi, 2012), combining packet inspec-
tion and browsing to filter and detect potential attacks.
The idea behind XplicoAlerts is to support the analy-
sis by automatic alerts when the network traffic con-
tains suspicious communications worth further inves-
tigation. XplicoAlerts provides an interface to ana-
lyze and annotate suspicious events, allowing a user
to get an aggregated view for large-scale analysis of
network data events.
The platforms proposed by (Kumar and Hanu-
manthappa, 2013) and (Lee et al., 2010) are exam-
ples of platforms based on Hadoop and MapReduce to
provide scalable intrusion detection platforms. Such
platforms are based on network traffic log parsers,
storage, and analysis in Hadoop/MapReduce, with an-
alyzed logs provided for further analysis/filtering of
suspicious communications.
As different from these existing platforms, the
CopAS platform proposed in this paper can address
the specific detection needs by means of support of
network traffic analysis with the integration of well-
known frameworks (e.g., ElasticSearch, Kibana), al-
lowing the person involved in forensic analysis to
have a single platform, in which all the data analysis
is integrated. Compared to the discussed platforms,
containerization supports high flexibility as well as
large-scale data analysis, allowing the analyzer to ad-
just the needs based on the amount of data avail-
able. This is especially relevant for network traffic
data analysis since the data to be analyzed can grow
exponentially based on the number of users involved.
Additionally, further extensibility of the platform can
be developed by the integration of other frameworks
depending on the needs for data analysis that arise.
3 CopAS SYSTEM
This section introduces the CopAS platform
2
with
a detailed overview of its essential context, require-
ments, architecture, and implementation.
2
Publicly available at https://gitlab.ics.muni.cz/bigdata/
CopAS
3.1 Application Context
When dealing with cyberattacks and (digital) crime
investigations, network traffic captures are highly-
valued data allowing the analyst to understand the
situation faced. However, an analysis of network
traffic captures – usually encapsulated in packet cap-
tures (PCAP format) – is a very exhaustive and time-
consuming process since it is very complicated for a
data analyst to build awareness of the captured situa-
tion on the level of individual IP packets. Moreover,
this process becomes even more complicated and of-
ten even impossible when dealing with large amounts
of such captures. Thus, it is highly beneficial to pre-
process such packet captures and extract higher-level
information, such as compound information about all
the individual network flows, which is more easily un-
derstandable by humans and keeps all the necessary
information required by network data analysts. How-
ever, such a transformation is not the only preprocess-
ing step required to be done in order to index network
captures in a powerful analysis system. During the
pre-analysis phase, it is often required to enrich these
data in various manners (like resolved DNS names,
geographic information related to IP addresses, etc.)
as well as to maintain various unpredictable states in
order to make the transformation successful (like fix-
ing various errors that may occur in packet captures).
To make the depicted complex process of pre-
processing network traffic captures and their analy-
sis more effective and straightforward, we proposed
and developed a solution that employs the Elastic
framework (Gormley and Tong, 2015) and facilitates
this process in a user-friendly manner. The solution,
called CopAS (the acronym stands for Cop’s Analyt-
ical System), combines a set of existing tools with
a user-friendly graphical interface, allowing the net-
work data analysts to focus just on the data analysis
itself, not on the technical process of packet captures’
preprocessing and indexing.
Regarding the CopAS analytical features, we pre-
cisely selected a set of integrated analytical tools so
that the CopAS can be used for an analysis of var-
ious cybersecurity attacks/incidents. The insider at-
tack detection, which we analyze later in this paper,
requires the analytical tools to provide the analyst
with a list of all the captured network data flows en-
riched with information like IP addresses and/or DNS
resolved names of communicating parties, port num-
bers, and amounts of data transmitted – and all of
these enriched with timestamps, making the detection
of the sequence of the attack events possible. More-
over, the flow description should be enriched with
the detected network protocols and their header in-
IoTBDS 2023 - 8th International Conference on Internet of Things, Big Data and Security
152

formation, including the data payloads transmitted in
open form. The structure of these data nicely fits into
the model of document-oriented databases (like Elas-
ticSearch, MongoDB, and others), allowing the an-
alysts to query them using complex queries. These
queries help to identify insider attacks, which are of-
ten complex and complicated. However, since such
complex attacks can be hard to read by a human ana-
lyst, a robust visualization framework such as Kibana
or Arkime/Moloch is also necessary to better under-
stand the query results and gain awareness about the
captured situation. We thus decided to integrate these
tools into the CopAS to provide the analysts with suf-
ficient flexibility and high analytical features.
3.2 System Requirements
When designing CopAS, we have taken the following
major requirements into account:
• Data Analysis Features – besides streamlining
the whole preprocessing phase for network traffic
analysis, the tool has to be extensible for differ-
ent data formats (like JSONs or CSVs) as well as
for different analysis tools (like Arkime, formerly
known as Moloch), allowing to get different views
on the analyzed situation.
• User-Friendliness – as already mentioned, usabil-
ity is the crucial aspect of the CopAS solution.
Since the depicted process of network captures
analysis requires several steps to be performed,
and that requires an adequate level of IT knowl-
edge, we want the tool to make the whole process
easier, allowing the analysts to focus just on the
data analysis itself, not on the technical details.
• Performance – since the amount of network cap-
tures can be very large, the tool has to provide a
sufficient level of performance, effectively using
the hardware infrastructure that it is deployed on.
Thus, it has to fine-tune all the individual tools as
well as the employed data workflow and introduce
as low additional overhead as necessary. More-
over, scalability is an important factor that has to
be addressed as well.
• Flexibility – despite hiding unnecessary techni-
cal details behind a user-friendly interface, Co-
pAS has to allow flexible process modifications
(individual steps configuration) during the prepro-
cessing phase. Moreover, on the hardware re-
sources level, the solution has to allow its users
to use available hardware resources flexibly: e.g.,
smaller network captures could be analyzed on
less powerful personal computers, and once the
amount of data or analyses rises, it should allow
its users to migrate the analysis to more powerful
servers and continue their analysis.
• Automation – since the preprocessing and index-
ing tasks are often repeatable – for example, new
network captures are preprocessed and analyzed
in the same way and with the same process config-
uration as the previous ones – the tool has to sup-
port automation of such repeatable tasks as much
as possible.
• Data and System Isolation – usually, there is a
need to analyze data from multiple cases, some-
times with the need to adapt the configuration of
integrated tools or even extend them. We decided
to isolate the entire stack of analytical tools in
each container to support these use cases, also fea-
turing the possibility of renewing a fresh container
state once the configuration becomes misbehav-
ing.
• Ease of Deployment – even though being part of
user-friendliness, we explicitly wanted the tool
to be easy and user-friendly to deploy, no matter
what hardware resources or operating system it is
deployed on.
• Ease of Analysis – to further support the ease of its
practical deployment and use, CopAS should sup-
port the integration/import of pre-made user ana-
lytical dashboards (e.g., sets of graphs/tables for
analysis of known attacks or statistical informa-
tion). Such dashboards will allow the data analyst
to quickly obtain basic information about the cap-
tured situation or, for example, will enable her to
identify known attacks more quickly.
3.3 CopAS Architecture
To address all the primary requirements, we de-
cided to build the CopAS from individual widely-
used components, suitably integrated into a unified
complex solution. While the required data analysis
features are provided by the set of integrated tools
(currently Elastic framework and Arkime), the user-
friendliness of data preprocessing/indexing and au-
tomation is achieved by a web-based interface we de-
veloped. Once used by a user, the interface properly
configures (for the sake of performance) and starts all
the underlying tools necessary to provide the required
processing, gather their outputs, and adapt its further
stages to them. To support flexibility and ease of de-
ployment features, we decided to employ containers
– lightweight virtual machines that allow us to make
the CopAS independent of the underlying operating
system and provide features for the flexible creation
and migration of various analytical projects.
CopAS: A Big Data Forensic Analytics System
153
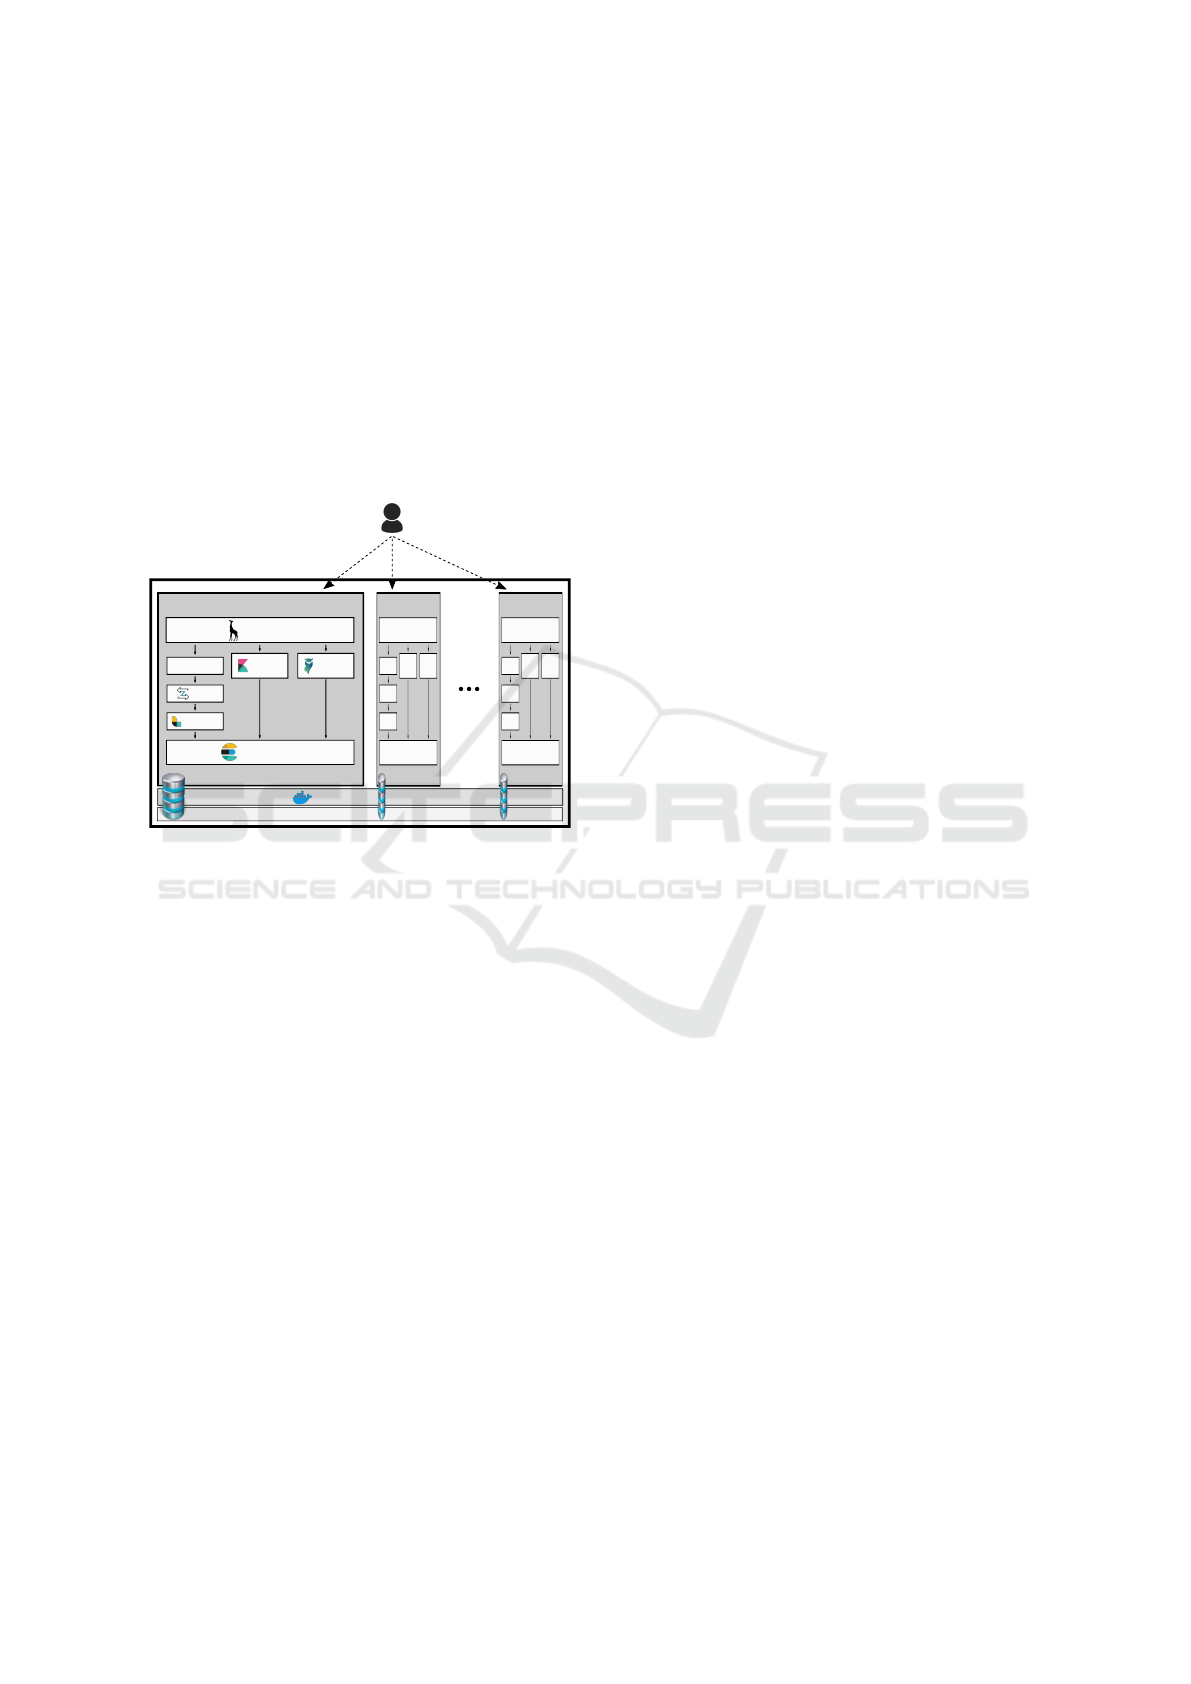
As the CopAS architecture depicted in Figure 1
shows, all the necessary preprocessing and analysis
tools are encapsulated in containers, which are then
individually managed on the host(s). This architec-
ture allows users to perform various data analysis
projects simultaneously – each encapsulated in a par-
ticular container – and flexibly switch among them.
Moreover, the individual containers (individual ana-
lytical projects) can be created or destroyed, started
or stopped, backed up or restored, or even flexibly
moved/migrated across various CopAS host instances
(e.g., from less powerful hardware to more powerful
ones).
Lin/Win/Mac
Docker
Neck (GUI)
/
data-shared
/opt/CopAS/datastore/XXX
Kibana
Pcapfix
Logstash
Arkime
ElasticSearch
Zeek
container1
containerN
container2
Figure 1: CopAS architecture schema, illustrating a set of
containers with integrated analytical tools and provided user
interface.
The current CopAS implementation employs
Docker (Nickoloff, 2016) as the container manage-
ment engine, controlled by a shell script allowing
to perform various operations on the container level.
Inside each CopAS container, there is a full stack
of analytical tools required for performing analyses
of network captures or other input data, including
the graphical user interface, which allows configur-
ing and running all the preprocessing phases and ana-
lytical tools in a user-friendly fashion. Currently, the
CopAS containers employ the following essential set
of tools:
• Neck – a web-based graphical interface we de-
veloped to make the process of data preprocess-
ing and analysis easier. Neck is a web-based so-
lution that allows CopAS users to manage local
files stored in the container/host (upload, down-
load, move, delete, etc.), choose the ones for fur-
ther analysis, and perform the whole data prepro-
cessing phase in a user-friendly fashion. During
several steps, users can adapt the default config-
urations (if required), as well as store frequently
used configurations of the whole preprocessing
phase for further use. Finally, based on the in-
put data format, Neck instructs and starts the nec-
essary tools to prepare chosen data for uploading
into the ElasticSearch database (or alternative in-
tegrated tools, like Arkime) for further analysis.
• ElasticSearch – an open-source NoSQL search
engine developed by Elastic NV company. Elas-
ticSearch is the essential part and heart of CopAS,
allowing it to index all the analyzed data and pro-
vide an interface for querying them in (near) real-
time for interactive analyses in Kibana.
• Kibana – an open-source analytical interface, also
developed by Elastic NV company. Kibana pro-
vides the primary interface for data analysts, al-
lowing them to specify data queries (in the back-
ground sent to ElasticSearch), visualize their re-
sults, and thus iteratively and interactively build
their awareness about the situation captured inside
the analyzed dataset.
• LogStash – an open-source tool employed from
the toolset developed by Elastic NV company.
LogStash serves CopAS for conversion and trans-
formation of input data files, enhancing them
(e.g., DNS resolving), and finally uploading them
into the ElasticSearch database.
• Zeek (previously known as Bro) – an open-source
network monitoring and analysis framework that
processes IP packets captured in PCAP format.
CopAS uses Zeek to process input packet captures
and transforms them into network flows described
by several attributes (like originator and respon-
der IP addresses, timestamp of connection estab-
lishment, amount of data sent, and network pro-
tocols used), which are further forwarded to Elas-
ticSearch and indexed.
• Arkime (formerly known as Moloch) – an open-
source, large-scale engine for indexing and
searching network packet captures, serving as an
alternative approach to ElasticSearch/Kibana data
analyses, demonstrating the extensibility of Co-
pAS. While ElasticSearch/Kibana data analysis
could be considered more generic, Arkime is a
highly-specialized tool for network security ana-
lysts, providing a set of specific features that can
make their analysis more efficient.
• pcapfix – as its name suggests, pcapfix is an open-
source tool able to check for and repair various
errors inside (corrupted) network traffic captures
in PCAP format. Even though those captures are
usually without errors, CopAS uses pcapfix for
safety reasons so that the processed data can be
considered consistent and error-free.
IoTBDS 2023 - 8th International Conference on Internet of Things, Big Data and Security
154

In addition to the graphical user interface stream-
lining the preprocessing phase performed by the de-
scribed fine-tuned and properly configured toolset,
CopAS implements various additional handy features
that make its practical use more comfortable and ef-
ficient for data analysts. Those features incorporate,
for example:
• established shared directories between each con-
tainer and its hosting system, that make transfers
of data files between the host system and particu-
lar containers easier,
• possibility of indexing and further analysis of in-
put data in various formats (currently supported
formats are Packet Captures – PCAP, JavaScript
Object Notation – JSON, and Comma-Separated
Values – CSV), which makes CopAS a generic
data indexing and analysis tool (not only special-
ized on network captures),
• ability to directly work with various data com-
pression archives (currently ZIP and TGZ), which
does not require the data analysts to extract them
on their own,
• availability of so-called CopAS WatchDogs,
which periodically look over specified directories
for new data files and automatically index them
using user-defined configuration,
• ability to interconnect several CopAS containers
into a single distributed system, allowing to in-
dex and analyse huge datasets on a set of physical
computers/servers,
• possibility to enter each container from command
line, allowing the user to adapt its (system) con-
figuration and/or integrated tools,
• the ability to export/import created analytical
dashboards from Kibana so that the data analyst
can re-use them in another analysis to gain the sit-
uation awareness faster,
• (running implementation) graph model-based
analyses of (network) data, which will allow the
analysts to perform more efficient analyses of var-
ious complex relationships among individual en-
tities and their communication. The implementa-
tion is based on the Dgraph graph database,
• (running implementation) support for drive image
captures (in the IMG file format), allowing foren-
sic analysts to index and analyze filesystem struc-
ture and files’ timestamps of hard drives.
3.4 Implementation
As mentioned previously in the paper, CopAS is im-
plemented as a set of suitably selected tools together
with their integration and automation of some aspects
– a web-based graphical interface that guides the user
through all the necessary steps to properly index re-
quired data. Once the CopAS is installed, the user is
given a command-line utility that allows manipulat-
ing data-analytic containers. The utility can create a
new container, start and stop it, backup or load (i.e.,
migrate), enter into its command line, or even destroy
it. Besides these container functions, the utility also
provides a set of functions for showing relevant in-
formation about running containers, monitoring their
resources, updating the base container image, or pro-
viding necessary debugging information.
The creation and the complete start of a newly
created container usually takes a few seconds (tens
of seconds at most): once started, the user is pro-
vided with an URL address with its port number and
thus unique for each created container, where the con-
tainer’s web-based user interface listens behind. The
CopAS main user interface then provides the user
with a set of functions that are usually performed in
the following order:
• File Manager – a simple web-based file manager
that allows the user to upload, manipulate and de-
stroy data inside the analytical container. While
this provides a simple and intuitive way of prepar-
ing the data necessary to analyze, an alternative
approach of uploading through a hosting system
and a unique directory shared between the host
and the container, which is useful, especially for
large datasets, is also provided.
• Import – a step-by-step import function that in-
dexes the chosen data and prepares them for fur-
ther analysis. While the function tries to choose
the proper setting for the detected data automati-
cally (e.g., PCAPs vs. CSVs), it also allows the
user to variously adapt the setting of all the indi-
vidual steps (e.g., Logstash service configuration)
in a user-friendly way. During the indexing con-
figuration, the user can choose a set of directo-
ries that will be monitored for new data uploads
(for their automatic import) and choose whether
to upload the data into the Elastic framework or
the Arkime/Moloch (or both).
• Kibana and Arkime/Moloch – functionality that
forwards the user to the graphical interfaces of
these integrated tools.
• History – a list of performed analyses showing the
list of indexed directories and the particular con-
figurations.
• Elastic Status, ElasticSearch Cleanup, and
Arkime/Moloch Cleanup – a set of service func-
tions that are useful for checking the status of the
CopAS: A Big Data Forensic Analytics System
155
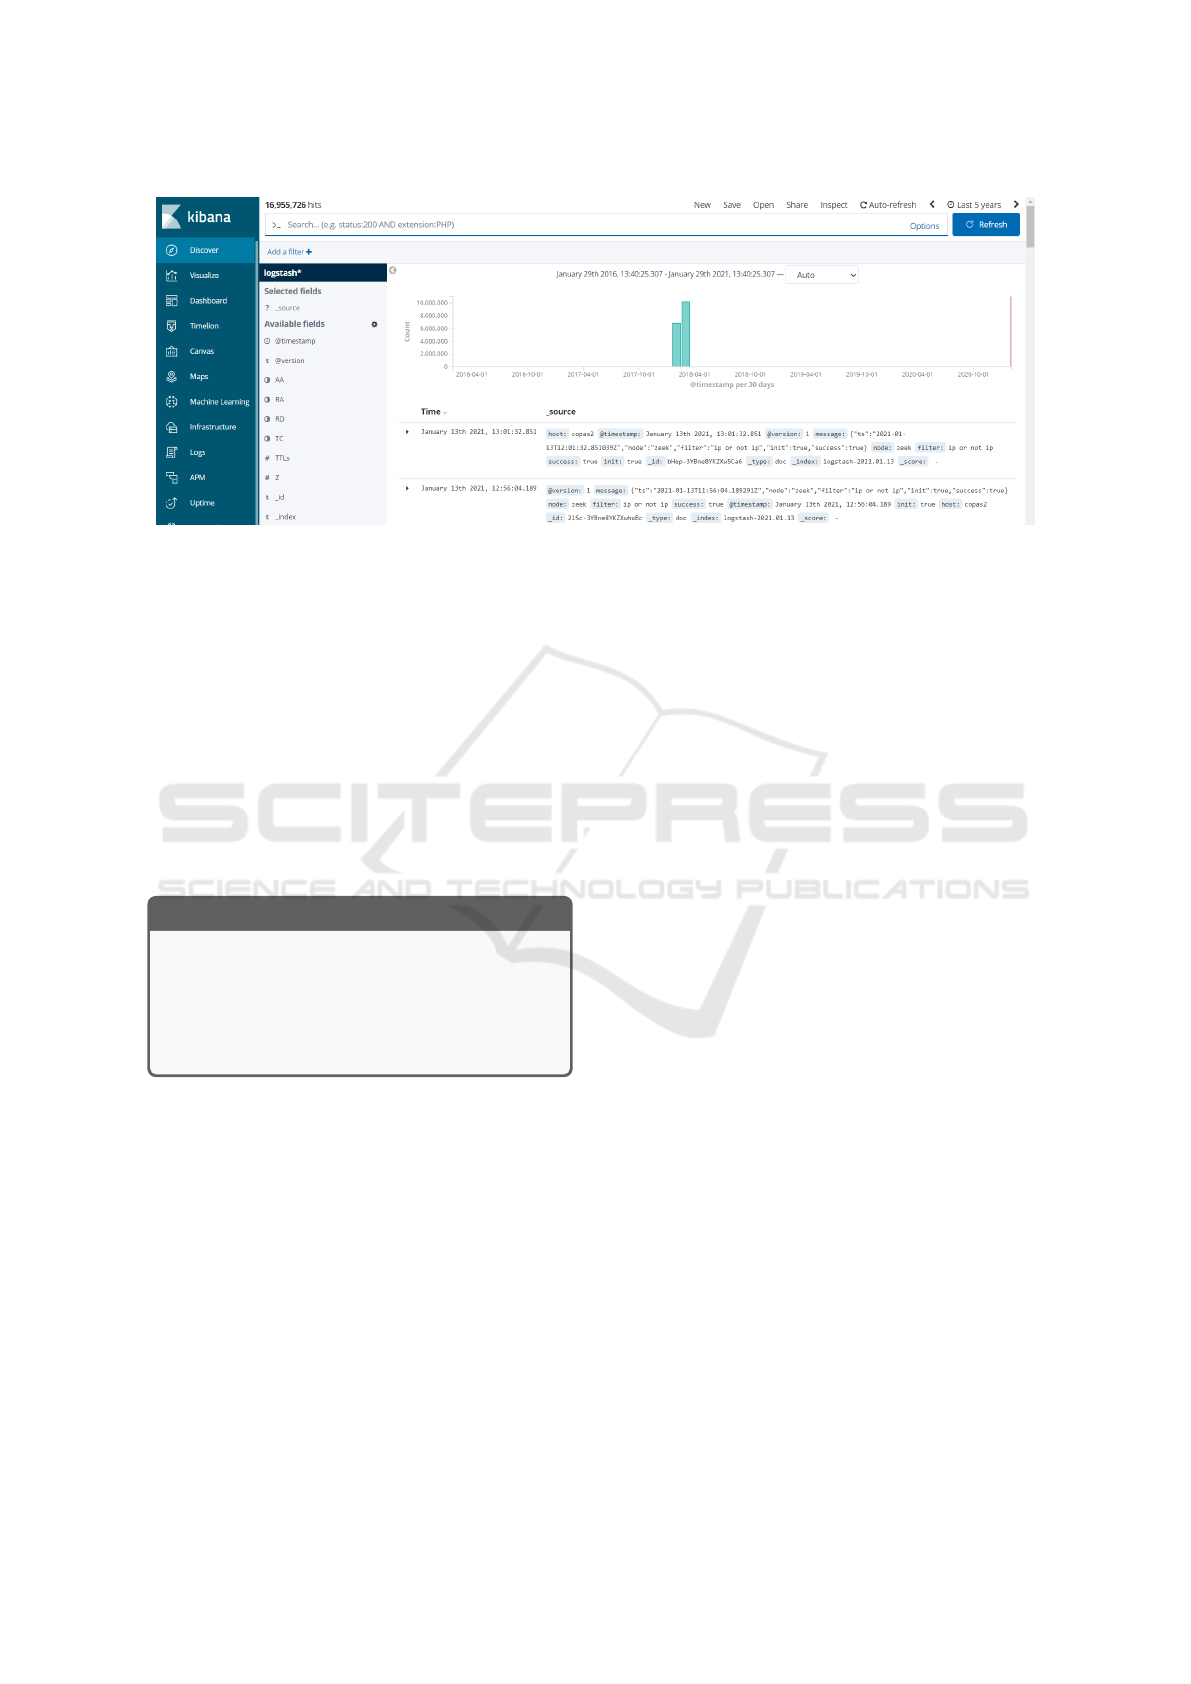
Figure 2: CopAS Kibana Dashboard Integration.
Elastic database subsystem (used for both Kibana
and Arkime/Moloch), as well as for the Elastic-
Search and Arkime/Moloch cleanup.
The implementation and configuration of all the
tools are realized for maximum performance and op-
timum resource usage (automatically detected and
adapted based on the host system’s resources). For
example, besides proper configuration of the individ-
ual tools, the web-based interface transparently to the
user combines the detected flows of multiple input
files into a single large data stream, thus minimizing
the overhead of starting all the individual analytical
tools, shortening the time necessary for data import.
CopAS Main Highlights
CopAS is containerized platform that allows
the scalability of digital forensic analysis
based on network traffic by supporting all the
phases of data analysis: from data preprocess-
ing and data cleaning to data visualization.
3.5 Analysis Features
Once the data are properly indexed, the processes of
mining and crime/incident discovery will take place.
While the CopAS primarily focuses on simplifying
and shortening the processes of toolset configuration
and proper dataset preparation and indexation, its ana-
lytical features are intentionally provided by the inte-
grated and widely-used analytical toolset. Currently,
CopAS integrates two tools available to the analyst
for data analysis:
• Kibana – a widely used analytical tool that pro-
vides a generic query language and various visual-
ization possibilities, allowing the user to visualize
and analyze responses to the provided analytical
queries interactively. In the CopAS, the Kibana
serves both for the analysis of network traffic cap-
tures as well as for interactive analysis and visual-
ization of various datasets (indexed as large CSV
files). Its dashboard is shown in Figure 2.
• Arkime/Moloch – a highly specialized tool for dig-
ital forensics, providing a set of features focused
on the analysis of network traffic captures. Even
though not being as generic as Kibana is, the
Arkime/Moloch enriches the CopAS features with
a fine-tuned analytical interface, e.g., for digital
forensics analysis and connection/communication
graphs. Its dashboard is shown in Figure 3.
In the case of indexing the network traffic cap-
tures, all the individual packet captures are automat-
ically transformed into an indexed set of detected
network flows. All these flows are described by a
set of their attributes – like initiator’s/responder’s IP
addresses and port numbers, (optionally) their DNS
names and geographical locations, flow timestamps
and duration, amount of data and packets transferred,
and detected protocols – that are available for their
filtering, aggregations, and visualizations, supporting
the process of building situation awareness.
4 EXPERIMENT WITH CopAS
In this section, we demonstrate the capabilities of Co-
pAS in supporting forensic analysis for insider detec-
tion. CopAS provides features that are useful for data
analysis on large datasets, such as the deployment and
indexing of datasets with custom parameters that can
be overridden. By using the analytical tool provided
within this system, we emphasize the importance of
CopAS in the context of the PCAP dataset analysis.
IoTBDS 2023 - 8th International Conference on Internet of Things, Big Data and Security
156
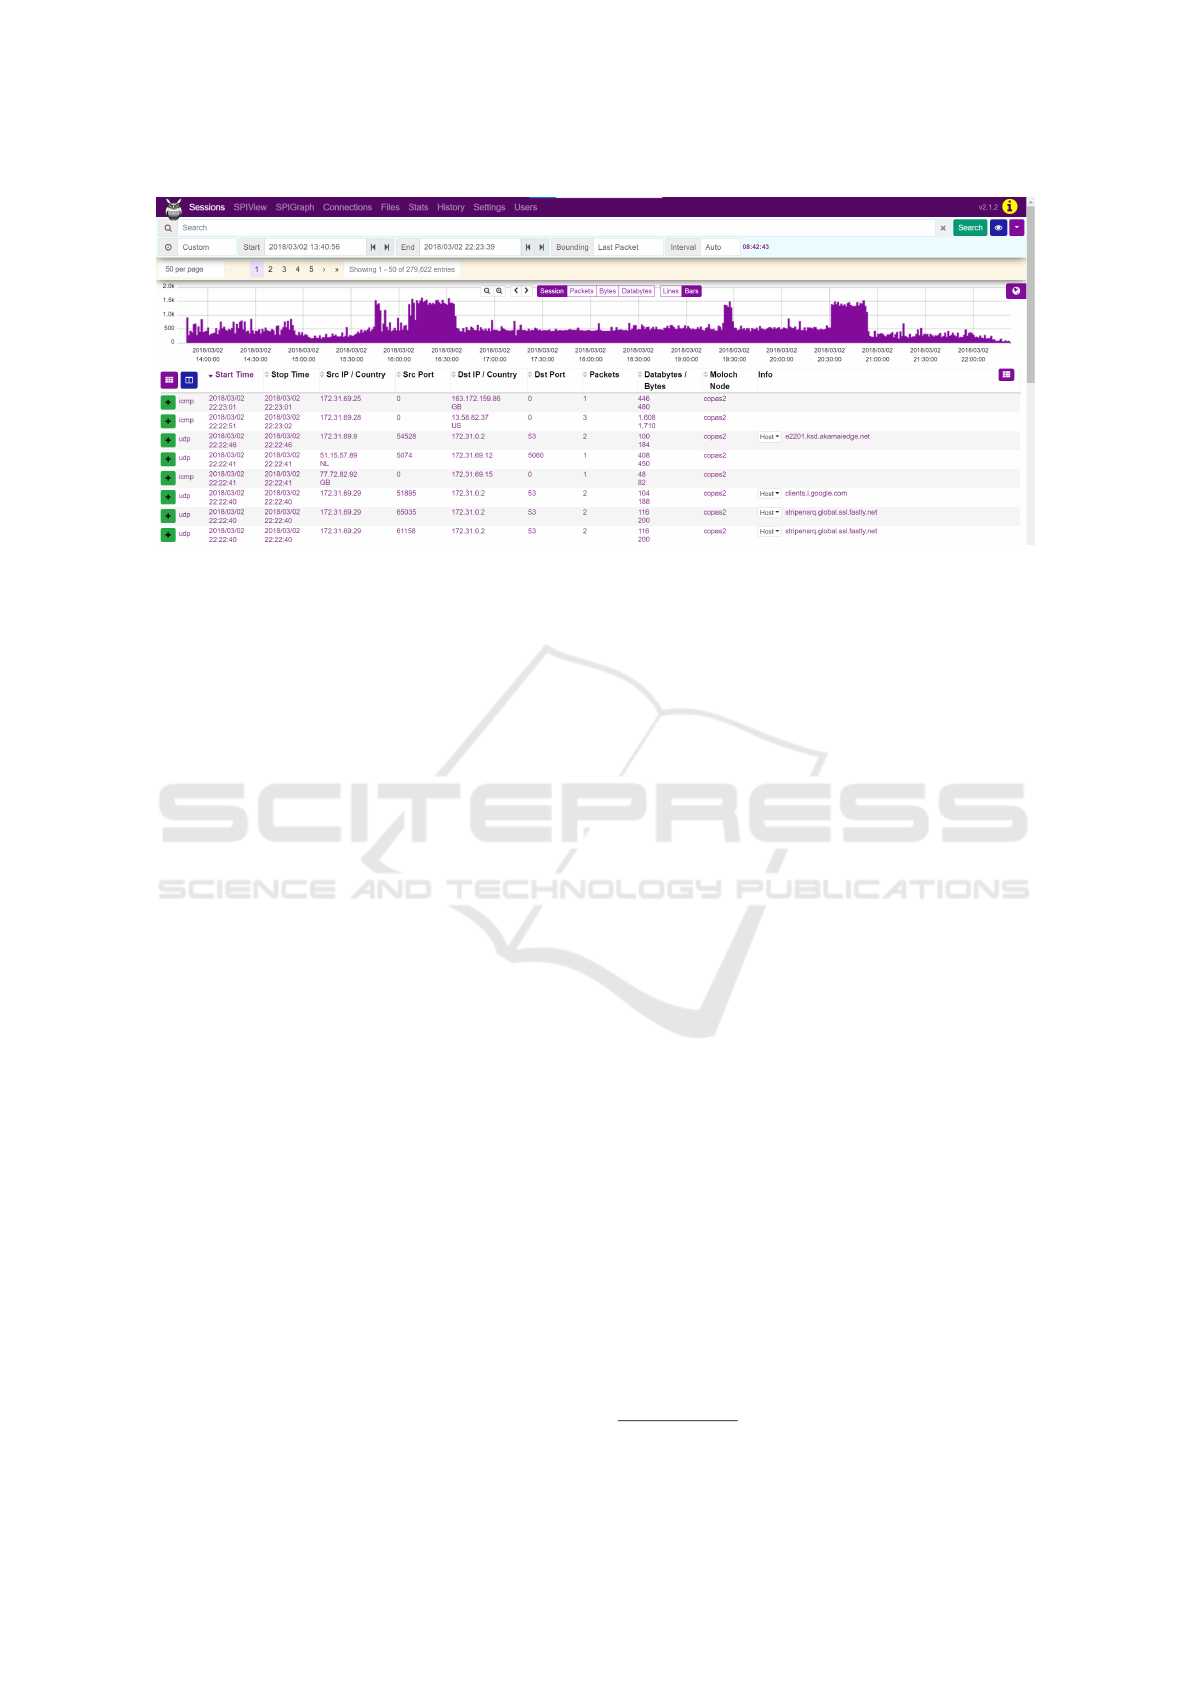
Figure 3: CopAS Arkime/Moloch Dashboard Integration.
To demonstrate its capabilities, we focus on a port
scan attack as a result of an intrusion exploit by using
a publicly available dataset (Sharafaldin et al., 2018).
In this case, the external attacker gains access to the
organization’s network and afterward begins the in-
sider attack, masquerading as their victim inside the
organization.
4.1 Goal
The goal of the CopAS demonstration is to search
for suspicious behavior of network participants; more
closely, we look for insider port scan attacks. Unusual
or abnormal load on ports between participants in the
network can be an indicator of a serious attack. In reg-
ular case scenarios, participants use a relatively small
number of ports between each other. Having a record
and detailed information about abnormal port usage
can be a significant help in the detection of insider at-
tacks. A port scan is an attack that scans a network
for vulnerabilities. These vulnerabilities may lead to
exploiting a known vulnerability of that service (Lee
et al., 2003). By detecting this attack, we can pre-
vent unauthorized access to the devices in an organi-
zation. In the demonstration, we are interested in de-
tecting which devices in the private network behave
with malevolent intent, utilizing unusual amounts of
unique ports.
4.2 Experimental Setting
In order to thoroughly examine the chosen dataset,
we use the proposed CopAS tool. CopAS Docker is
hosted on a machine with Ubuntu 20.04.1 LTS (Fo-
cal Fossa) operating system. Our hosting machine is
based on an Intel Core i7-4790K and 16 GiB memory.
However, CopAS is not limited in any way to the us-
age of resources; it can scale to operate on the largest
set of resources we can offer.
We are using the CSE-CIC-IDS2018 (Sharafaldin
et al., 2018) dataset on AWS
3
. This dataset consists
of different attacks executed on the implemented in-
frastructure. For each day, there is a specific attack.
We index all days in the dataset. The whole dataset
has around 17 million records and 66,741 unique IP
addresses participating in the network. To showcase
the usage of CopAS, we sampled the whole dataset
with two days of port scan attacks occurring on two
days: 28.2. and 1.3. As described by the authors
of the dataset (Sharafaldin et al., 2018), we consider
three subjects within an attack. The first subject, an
attacker, attacked the network by sending a malicious
program or exploiting a known backdoor. The second
subject, an insider, which is the victim of an outside
attacker, was infected by the mentioned malicious
content and unwillingly forced to perform an attack
on a private network, in our case, a port scan attack.
The third subject, a victim within a private network,
was affected by being the victim of a port scan attack
performed by an insider (Sharafaldin et al., 2018).
4.3 Description of Analysis
We first used the CopAS platform for indexing our
PCAP dataset. For analysis of indexed data, we use
a built-in tool within CopAS, Kibana. Kibana offers
different ways to approach this problem. We can use
visualizations, for example. A visualization in Kibana
is relatively easy to use — with the ability to aggre-
gate the data by giving visual feedback to the user. In
our demonstration, we use the Kibana console, a tool
3
https://registry.opendata.aws/cse-cic-ids2018/
CopAS: A Big Data Forensic Analytics System
157
offering enhanced functionality. The aim is to flag in-
filtrated or infected devices within a private network.
Results from the analysis would lead to the physical
checking of flagged devices.
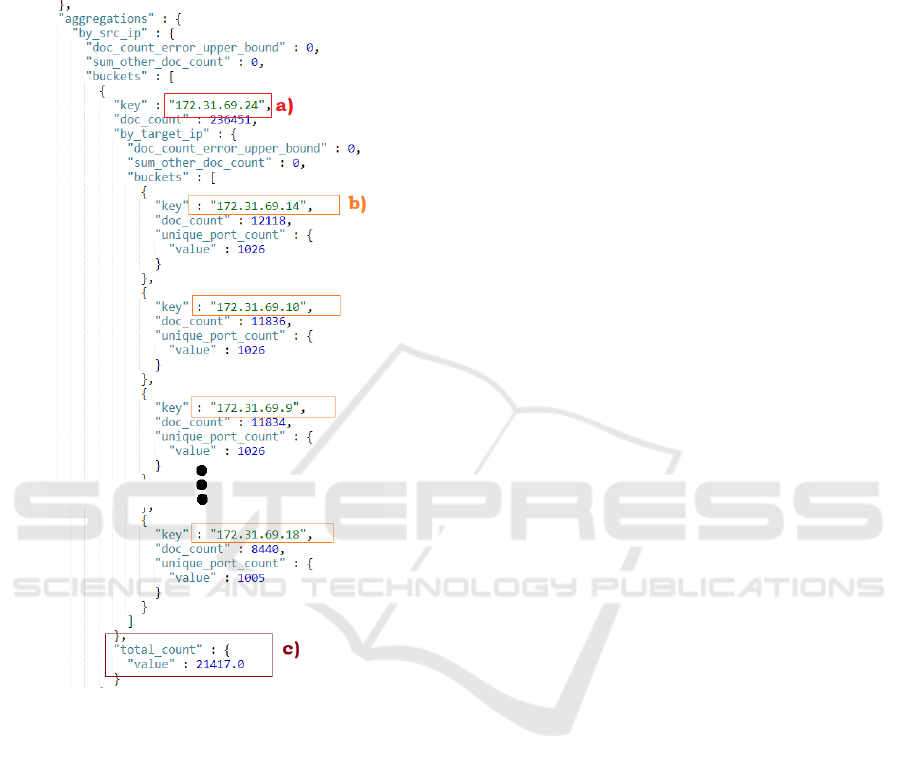
Figure 4: Query result example.
We implemented a solution that returns a result in
JSON format (Figure 4), from which we can say re-
port which IP addresses had performed a port scan
attack. The result consists of buckets; each bucket is
defined by one IP address – shown in the figure as a).
Within this bucket, there is a list of every IP address –
shown in the figure as b) with a count of unique ports
as "value"; we consider only values higher than ten.
There is a considerable number of frequently used
ports higher than ten. We set this threshold based on
the inspection of the dataset; however, such a thresh-
old can be customized, taking into account the prop-
erties of the dataset analyzed by considering the sta-
tistical distribution of historical data collected. Each
value represents how many unique ports were used
by IP defining the bucket. Last but not least, we have
"total_count" – shown in the figure as c); this number
represents the sum of before mentioned values. Only
IP addresses with a total count higher than 500 are
included in the results. Also, in this case, we based
the selection of this threshold on the data distribu-
tion. Based on the total of these counts for every IP,
we can deduce the threshold from which behavior is
considered suspicious and may be malevolent. For
the demonstration, we have to increase the number of
max buckets within our system. The default value of
10 000 is not enough to correctly compute the results.
For our purpose, we use filters, sorting, and ag-
gregation functions. Our main metric is the number
of unique ports used between each pair of IPs within
our dataset. The query is designed to create buckets.
For each IP in the dataset, we have one bucket. This
upper-level bucket consists of other lower-level buck-
ets representing every IP that received packets from
an upper-level bucket. The lower-level bucket stores
the unique count of used ports. We sum up a unique
count of used ports for each upper-level bucket and
store this value in the variable total_count. We in-
troduce some filters to sieve our data of IP with an
irrelevant number of used ports for getting more pre-
cise results. In order to obtain the top results, we use
the bucket sort functions within Kibana to sort in de-
scending order.
This aggregated setup consists of a list of all possi-
bly infiltrated IPs, ordered by the sum of all the unique
ports that the device used. Based on the results, we
deduce which IPs in a network are infected by ob-
serving a significant difference in port usage between
IPs.
4.4 Experimental Results
In this section, we present our results in the form
of various charts. The results are filtered on thresh-
olds determined within the analysis and given in the
queries presented before. Therefore some columns in
the chart are rounded to zero.
We first provide a description of our query and in-
troduce our method to filter unrelated outcomes. We
only consider those pairs of IP addresses in which
more than ten ports are used. Then we proceed even
further by limiting our results. For each IP address,
we have the sum of its used unique ports. We fil-
ter this sum on conditions higher than five hundred.
Based on this approach, we got the results shown in
Figure 5.
In Figure 5, we can see that having the sum
of used unique ports around 1000 is common and
found in six cases. The graph shows two abnormal
values produced by IP addresses 172.31.69.24 and
172.31.69.13. Those two addresses were considered
IoTBDS 2023 - 8th International Conference on Internet of Things, Big Data and Security
158
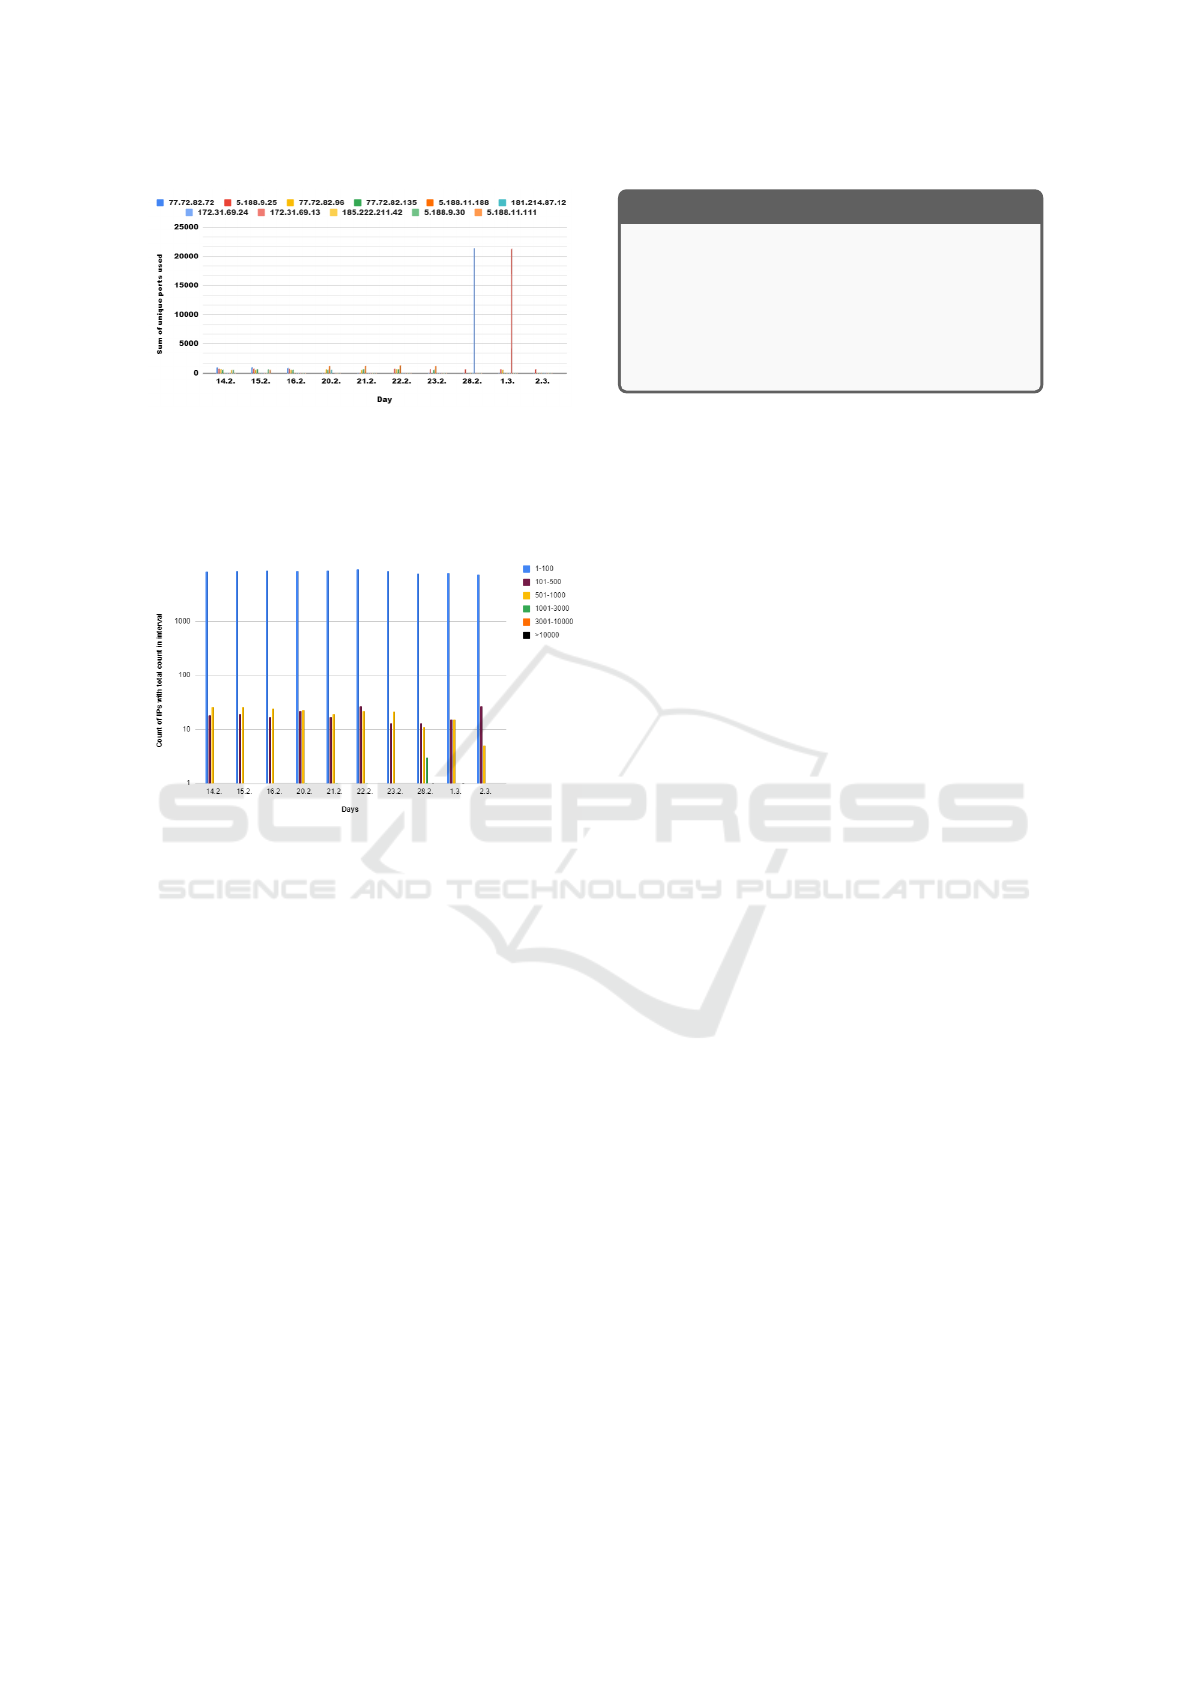
Figure 5: The sum of unique ports used per a sender IP
address for each day.
performing the port scan attack by the authors of the
dataset and were identified by the analysis with Co-
pAS.
Figure 6: The count of IP addresses with total count in in-
tervals per day (logarithmic ratio).
Figure 6 is based on a slightly modified query
from what is seen previously in Figure 5. In this case,
we consider those pairs of IP addresses in which at
least one port is used. Instead of looking for IP ad-
dresses with an abnormal amount of unique ports used
in sending packets, we look at how many IP addresses
have this amount within given intervals. Results show
that most IP addresses use at most 100 ports per day,
with some exceptions when this number rises to 3000.
The graph also captured the abnormal values of IP ad-
dresses performing port scan attacks, as detected by
CopAS.
This demonstration serves as an example of what
CopAS is capable of. The demonstration is based on
the presumption that in the private network of an or-
ganization, entities are not expected to perform any
malicious behavior towards each other as they are one
unit. Therefore by discovering malicious behavior be-
tween respective entities within the company, we can
say there is a possibility of an insider attack. Based
on the presented results and method of discovering
malicious behavior (port scan attack) within an orga-
nization, analysts can infer the problem and confirm
the possibility of such an attack.
CopAS Experimentation
The application of CopAS for network insider
attack detection has shown how the platform’s
integration with several tools allows for easy
data inspection by operators, pinpointing po-
tentially malicious events and permitting the
operators to perform additional inspections.
5 DISCUSSIONS
While the captured network data can be analyzed us-
ing Wireshark or similar tools, we present a solution
that supports the analysis at the level of individual
network flows. Here, the set of packets belonging to
a single network connection is described by a single
network flow record with appropriate descriptive in-
formation used for the analysis. Analyzing entire net-
work flows is thus much more comfortable from the
forensic analyst’s point of view, allowing her to gain
so-called situational awareness more easily.
CopAS is not a yet-another analytical tool; in-
stead, it introduces and implements a uniform and
easy-to-use analytical environment integrating exist-
ing, highly specialized, and properly selected analyt-
ical tools to streamline this process. It thus serves
as a ’glue’ of these analytical tools, making the in-
frastructure setup, data import, and necessary data
pre-processing tasks faster and more comfortable. As
its features are inspired by the feedback gained from
real-life investigations of police data analytics, it inte-
grates a set of other handy features – like the ability to
integrate user analytical dashboards, isolation of dif-
ferent investigated cases, support for analysis of other
file types, etc.
To demonstrate its usefulness and readiness for
real-life analytical scenarios, we have used the Co-
pAS platform for insider attack detection, looking at
insider port scan attacks. In particular, we used Co-
pAS support for network traffic analysis with the inte-
gration of ElasticSearch and Kibana. After indexing
the sample PCAP dataset, we used visualizations in
Kibana by aggregating and filtering data to look into
unique port scans to cluster potentially infiltrated de-
vices based on unique ports used. We defined thresh-
olds based on the historical distribution of the data to
identify suspicious devices. Utilizing CopAS archi-
tecture based on containers, we could take a snapshot
of the situation on the days considered for the demon-
stration. More instances of analysis could have been
started in parallel to get more insights into the dataset.
The sum of daily scanned unique ports is an im-
CopAS: A Big Data Forensic Analytics System
159

portant indicator for attack detection. It can be seen
that there will be a normal number of daily scanned
unique ports in one network. Given no significant
infrastructure changes, this normal number of daily
scanned unique ports is usually stable across the
whole network. For example, in our data analysis, this
network has an observed number of 1000. However,
when an attack occurs on certain days, the number of
daily scanned unique ports can significantly increase.
In our analysis, this number increases to 20 000, given
66 741 IP addresses in the network. Thus, we pro-
posed to use a threshold-based approach in CopAS to
consider a suspicious number of daily scanned unique
ports.
It is important to scale the attack indicator based
on the normal number of daily scanned unique ports.
That means that when the number of daily scanned
unique ports deviates from the normal value, the ex-
tent of the deviation can be leveled to a different at-
tack indication stage. For our analysis, it is easy to
identify the abnormal behavior as an outlier number
when around 20 times more than normal scans. How-
ever, we believe that in certain networks, the scan in-
crease can also be caused by other events, such as in-
stalling new software or the scans that can be caused
by the security software. Therefore, scaling the devia-
tions from the normal number of daily scanned unique
ports is an important step in approaching attack detec-
tion, such as insider attack detection.
For each IP, there is a normal number of daily port
scans. Therefore, ideally, all the IPs in the networks
should maintain the normal level of daily port scans.
When the number of daily port scans for one IP is
significantly increased, there will be a possibility that
this IP is launching an attack. Thus, this number can
be tracked for each IP and can contribute to real-time
attack detection. In our analysis, most IPs have 100
port scans each day. However, when the number is in-
creased to 3000, there is a high possibility of an attack
involving this IP. In a real-time setting, once the daily
threshold of port scan is passed, the network may fo-
cus on monitoring the further behavior of this IP.
6 CONCLUSION
In this paper, we have introduced a forensic Big Data
analytics platform called CopAS, a comprehensive
and practically-usable solution for analyzing captured
network traffic data at the level of individual network
flows. Using a well-designed architecture and unique
accompanying features, CopAS combines a suite of
existing data analytics tools into a user-friendly envi-
ronment that allows the data analyst to focus solely
on the analysis itself rather than on building the nec-
essary infrastructure and configuring the tools used.
As CopAS development and features are primarily
inspired by its usability for real-world police inves-
tigators and their infrastructures, we employ its fea-
tures based on their feedback. CopAS proves that it is
a highly beneficial tool for day-to-day analyses, espe-
cially for smaller network captures analyzed on inves-
tigators’ workstations, saving the centralized servers’
resources. Besides this primary application, real-life
CopAS usage has shown another suitable use case
by serving as an easy-to-use training tool for new or
inexperienced police data analysts, allowing them to
familiarize themselves with the integrated analytical
tools and examinations of various types of attacks be-
fore dealing with real-life datasets.
Beyond introducing CopAS architecture, this pa-
per has demonstrated its usability in the case of de-
tecting network-based insider attacks. We have em-
ployed the CopAS platform with real-world settings
and experimented with a real-like PCAP dataset. The
experimental results have identified the intrusions in
the PCAP network captures. Further, we have exam-
ined that the CopAS system can be easily deployed
in a cloud computing environment and deal with dif-
ferent data structures with reasonable run time. Thus,
it can indicate which days the possible attacks might
have occurred, help network administrators trace the
possible IP(s) that launched the attacks, and monitor
the port scan behaviors.
ACKNOWLEDGEMENTS
This research was supported by ERDF "CyberSecu-
rity, CyberCrime and Critical Information Infrastruc-
tures Center of Excellence" (No. CZ.02.1.01/0.0/0.0/
16_019/0000822).
REFERENCES
Costa, G. and De Franceschi, A. (2012). Xplico internet
traffic decoder-network forensics analysis tool.
El Masri, A., Wechsler, H., Likarish, P., and Kang, B. B.-
H. (2014). Identifying users with application-specific
command streams. In 2014 Twelfth Annual Inter-
national Conference on Privacy, Security and Trust,
pages 232–238. IEEE.
Gacimartın, C., Hernández, J. A., Uruena, M., and
Larrabeiti, D. (2010). On detecting internet-based
criminal threats with xplicoalerts: Current design and
next steps. In 3rd International Conference on Multi-
media Communications, Services and Security (MCSS
2010).
IoTBDS 2023 - 8th International Conference on Internet of Things, Big Data and Security
160

Gheyas, I. A. and Abdallah, A. E. (2016). Detection and
prediction of insider threats to cyber security: a sys-
tematic literature review and meta-analysis. Big Data
Analytics, 1(1):6.
Gormley, C. and Tong, Z. (2015). Elasticsearch: the defini-
tive guide: a distributed real-time search and analyt-
ics engine. " O’Reilly Media, Inc.".
Homoliak, I., Toffalini, F., Guarnizo, J., Elovici, Y., and
Ochoa, M. (2019). Insight into insiders and it: A sur-
vey of insider threat taxonomies, analysis, modeling,
and countermeasures. ACM Comput. Surv., 52(2).
Hong, J., Kim, J., and Cho, J. (2009). The trend of the se-
curity research for the insider cyber threat. In
´
Sl˛ezak,
D., Kim, T.-h., Fang, W.-C., and Arnett, K. P., editors,
Security Technology, pages 100–107, Berlin, Heidel-
berg. Springer Berlin Heidelberg.
Kholidy, H. A. (2020). Correlation-based sequence align-
ment models for detecting masquerades in cloud com-
puting. IET Information Security, 14(1):39–50.
Kholidy, H. A. and Baiardi, F. (2012). Cidd: A cloud intru-
sion detection dataset for cloud computing and mas-
querade attacks. In 2012 Ninth International Confer-
ence on Information Technology - New Generations,
pages 397–402.
Kim, H.-S. and Cha, S.-D. (2005). Empirical evaluation
of svm-based masquerade detection using unix com-
mands. Computers& Security, 24(2):160 – 168.
Kumar, M. and Hanumanthappa, M. (2013). Scalable intru-
sion detection systems log analysis using cloud com-
puting infrastructure. In 2013 IEEE International
Conference on Computational Intelligence and Com-
puting Research, pages 1–4. IEEE.
Lee, C. B., Roedel, C., and Silenok, E. (2003). Detection
and characterization of port scan attacks. Univeristy
of California, Department of Computer Science and
Engineering.
Lee, Y., Kang, W., and Son, H. (2010). An internet traf-
fic analysis method with mapreduce. In 2010 IEEE/I-
FIP Network Operations and Management Sympo-
sium Workshops, pages 357–361. IEEE.
Liu, L., De Vel, O., Han, Q.-L., Zhang, J., and Xiang,
Y. (2018). Detecting and preventing cyber insider
threats: A survey. IEEE Communications Surveys &
Tutorials, 20(2):1397–1417.
Lv, Z., Zhao, Y., and Li, H. (2019). Modeling user net-
work behavior based on network packet sketches for
masquerade detection. In 2019 IEEE Symposium on
Computers and Communications (ISCC), pages 1–8.
IEEE.
Macak, M., Vaclavek, R., Kusnirakova, D., Matulevi
ˇ
cius,
R., and Buhnova, B. (2022). Scenarios for process-
aware insider attack detection in manufacturing. In
Proceedings of the 17th International Conference on
Availability, Reliability and Security, ARES ’22, New
York, NY, USA. Association for Computing Machin-
ery.
Macak, M., Vanát, I., Merjavý, M., Jevo
ˇ
cin, T., and Buh-
nova, B. (2020). Towards process mining utilization
in insider threat detection from audit logs. In 2020
Seventh International Conference on Social Networks
Analysis, Management and Security (SNAMS), pages
1–6.
Marciani, G., Porretta, M., Nardelli, M., and Italiano, G. F.
(2017). A data streaming approach to link mining in
criminal networks. In 2017 5th International Confer-
ence on Future Internet of Things and Cloud Work-
shops (FiCloudW), pages 138–143.
Nickoloff, J. (2016). Docker in action. Manning Publica-
tions Co.
Pramanik, M. I., Lau, R. Y., Yue, W. T., Ye, Y., and Li, C.
(2017). Big data analytics for security and criminal
investigations. Wiley Interdisciplinary Reviews: Data
Mining and Knowledge Discovery, 7(4):e1208.
Probst, C. W., Hunker, J., Gollmann, D., and Bishop, M.
(2010). Aspects of Insider Threats. Springer US,
Boston, MA.
Salem, M. B., Hershkop, S., and Stolfo, S. J. (2008). A
survey of insider attack detection research. In Stolfo,
S. J., Bellovin, S. M., Keromytis, A. D., Hershkop, S.,
Smith, S. W., and Sinclair, S., editors, Insider Attack
and Cyber Security: Beyond the Hacker, pages 69–90.
Springer US, Boston, MA.
Salem, M. B. and Stolfo, S. J. (2011). Modeling user
search behavior for masquerade detection. In Som-
mer, R., Balzarotti, D., and Maier, G., editors, Re-
cent Advances in Intrusion Detection, pages 181–200,
Berlin, Heidelberg. Springer Berlin Heidelberg.
Schroeder, J., Xu, J., Chen, H., and Chau, M. (2007). Auto-
mated criminal link analysis based on domain knowl-
edge. Journal of the American society for information
science and technology, 58(6):842–855.
Sharafaldin, I., Lashkari, A. H., and Ghorbani, A. A.
(2018). Toward generating a new intrusion detec-
tion dataset and intrusion traffic characterization. In
ICISSP, pages 108–116.
Xu, J. J. and Chen, H. (2005). Crimenet explorer: A frame-
work for criminal network knowledge discovery. ACM
Trans. Inf. Syst., 23(2):201–226.
Yu, Y. and Graham, J. H. (2006). Anomaly instruction de-
tection of masqueraders and threat evaluation using
fuzzy logic. In 2006 IEEE International Conference
on Systems, Man and Cybernetics, volume 3, pages
2309–2314. IEEE.
CopAS: A Big Data Forensic Analytics System
161
