
Emotion Based Music Visualization with Fractal Arts
Januka Dharmapriya
1
, Lahiru Dayarathne
1
, Tikiri Diasena
1
, Shiromi Arunathilake
1
, Nihal Kodikara
1
and Primal Wijesekera
2
1
University of Colombo School of Computing, Colombo 07, Sri Lanka
2
University of California, Berkeley, U.S.A.
Keywords:
Emotion Recognition, Fractal Art, Information Processing, Music Emotion, Music Information Retrieval,
Music Visualization, Random Forest Regression.
Abstract:
Emotion based music visualization is an emerging multidisciplinary research concept. Fractal arts are gener-
ated by executing mathematical instructions through computer programs. Therefore in this research, several
multidisciplinary concepts, various subject areas are considered and combined to generate artistic but compu-
tationally created visualizations. The main purpose of this research is to obtain the most suitable emotional
fractal art visualization for a given song segment and evaluate the entertainment value generated through the
above approach. Due to the novice nature of previous findings, limited availability of emotionally annotated
musical databases and fractal art music visualizing tools, obtaining accurate emotional visualization using
fractal arts is a computationally challenging task. In this study, Russell’s Circumplex Emotional Model was
used to obtain emotional categories. Emotions were predicted using machine learning models trained with Me-
diaEval Database for Emotional Analysis of Music. A regression approach was used with the WEKA machine
learning tool for emotion prediction. Effectiveness of the results compared with several regression models
available in WEKA. According to the above comparison, the random forest regression approach provided the
most reliable results compared to other models (accuracy of 81% for arousal and 61% for valence). Relevant
colour for the emotion was obtained using Itten’s circular colour model and it was mapped with a fractal art
generated using the JWildfire Fractal Art Generating tool. Then fractal art was animated according to the song
variations. After adding enhanced features to the above approach, the evaluation was conducted considering
151 participants. Final Evaluation unveiled that Emotion Based Music Visualizations with Fractal Arts can
be used to visualize songs considering emotions and most of the visualizations can exceed the entertainment
value generated by currently available music visualization patterns.
1 INTRODUCTION
Art, both performing and visual, is an integral part
of human expression. Music, a subform of perform-
ing art, combines vocal or instrumental sounds to ex-
press human thoughts and emotions. To fully appreci-
ate music, one must understand concepts like vocals,
pitch, tone, rhythm patterns, harmonies, and timbres.
Music constantly evolves over time, creating unique
and intense experiences for listeners. Listeners often
create mental models of the music they hear to rep-
resent their emotions, and if these models can be vi-
sually represented, it would be a remarkable achieve-
ment with many potential applications.
Existing music visualization options use various
visual art forms to represent music, but they often
have limitations such as focusing on only one as-
pect, like emotional expression or a few music fea-
tures. As a result, their ability to accurately express
the music’s emotional expression is questionable and
requires further consideration. For example, at a live
musical show, the audience experiences varying lev-
els of emotional intensity and creates imaginative vi-
suals in their minds in response to the music. Mu-
sic artists invest time and money in creating suitable
background visuals using music visualization meth-
ods to enhance the show’s entertainment value. How-
ever, these visuals often fail to accurately convey the
music’s emotional expression. Additionally, deaf in-
dividuals may not have emotive or sensorial experi-
ences during the show. A new method that accurately
represents these imaginative mental models and the
true emotional expression of a music track through a
visual art form would be a remarkable addition to the
Dharmapriya, J., Dayarathne, L., Diasena, T., Arunathilake, S., Kodikara, N. and Wijesekera, P.
Emotion Based Music Visualization with Fractal Arts.
DOI: 10.5220/0011929100003497
In Proceedings of the 3rd International Conference on Image Processing and Vision Engineering (IMPROVE 2023), pages 111-120
ISBN: 978-989-758-642-2; ISSN: 2795-4943
Copyright
c
2023 by SCITEPRESS – Science and Technology Publications, Lda. Under CC license (CC BY-NC-ND 4.0)
111

currently available music visualization methods.
The best way to do this is to explore and study the
commonalities between music and the visual arts. In
studying those factors, we came across a lot of past
research done to find the connection between mu-
sical components and mathematics. Most of these
studies have confirmed (Chen et al., 2008), (Lartillot
and Toiviainen, 2007), (Santos Luiz et al., 2015) that
music and mathematics are more closely related to
each other than they are commonly perceived to be.
Also, when considering the visual arts category, we
can find some images and graphics based on math-
ematical methods and algorithmic calculations. The
best example for this is fractal arts. Fractal arts are
mathematical-based algorithmic art type that is cre-
ated to present calculation results of fractal objects as
still images, animation, and/or media.
Studying multi-disciplinary areas of performing
and visual arts reveals the interference of mathematics
in both fields. Mathematics can be used as a bridge
to combine divided visual and performing art forms
for the same emotional expression in music visualiza-
tion. In this research, we experimented to find a bet-
ter mapping method between a given segment of mu-
sic and one specific mathematical art form to achieve
the same emotional connection between the two art
forms. Fractal art was selected as the main visual art
form in this research. At the abstract level, this study
can be pointed out as an attempt which taken to build
a relationship between multidimensional performing
arts and two-dimensional visual arts (Dharmapriya
et al., 2021). These kinds of musical and visual ex-
plorations expand the boundaries of computer science
to generate a content creation tool to elevate the com-
puter as a visual instrument. Music artists can then
easily execute that method to generate graphic ani-
mations to express the real emotional value of their
songs.
2 RELATED WORKS
When looking at the existing literature in this field,
we first looked at music visualizations. Music visual-
ization is a visual representation of specific sound fea-
tures that enable users to visualize music in an under-
standable, meaningful, and entertaining way. Previ-
ous works show that music can be visualized by map-
ping music’s low-level features like the size of sound,
beat, and frequency spectrum to correlate with the
shapes, colours, etc. of images (Ciuha et al., 2010),
(Lee and Fathia, 2016). Lee and Fathia present an
interactive theme-based design of a music player us-
ing Processing. Colours and player control functions
are used to interact with the contents by changing the
brightness of the colours to distinguish the music’s
different moods. Ciuha, Klemenc, and Solina propose
a method to map colours to concurrent music tones.
Both of these music visualization methods use a lim-
ited amount of music features and graphical features.
Another possible approach for music visualization is
combining a music track with a series of photos based
on the emotions expressed in the music track (Chen
et al., 2008). By considering emotions, Chen et al.
have trained two machine learning models separately
for music and image features and then mapped them
together to show a slideshow of photos for each music
track.
Similar to music visualization, emotion visualiza-
tion is also a research area that uses mapping be-
tween emotions and graphical features such as colours
as a basis (Whiteford et al., 2018), (Bialoskorski
et al., 2009a). Bialoskorski, Westerink, and Broek
introduce an affective interactive art system, Mood
Swings, which interprets and visualizes emotions ex-
pressed by a person using colours.
A potential benefit of music visualization is that
the deaf, deafened, and hard of hearing community
can also enjoy music through the visualization (Four-
ney and Fels, 2009). Fourney and Fels present a study
that has used visualizations created from three differ-
ent visualization tools, and then evaluated by deaf,
deafened, and hard-of-hearing participants in a focus
group setting.
Some previous studies focus on the reverse pro-
cess of music visualization, which is image musical-
ization. Margounakis and Politis present some fun-
damental concepts of composing a musical piece’s
melody by analyzing an image’s colour values (chro-
matic synthesis) (Margounakis and Politis, 2006).
Zhao et al. use Principles-of-art-based emotion fea-
tures (PAEF), which are the unified combination of
representation features derived from different princi-
ples, including balance, emphasis, harmony, variety,
gradation, and movement as a basis for image musi-
calization (Zhao et al., 2014a), (Zhao et al., 2014b).
As most of these music visualizations use
emotion-based mappings, we also looked at the rela-
tionship between music and emotions. Music emotion
recognition is a well-researched area that includes
many frameworks for detecting emotions in mu-
sic, the most noted being Russell’s two-dimensional
Valence-Arousal (V-A) model (Russell, 1980). There
are many other emotion models such as categorical
and dimensional psychometric models which can be
effectively used for analyzing the emotions expressed
by a piece of music (Kim et al., 2010), (Li and Ogi-
hara, 2003), (Sorussa et al., 2020a), (Fagerberg et al.,
IMPROVE 2023 - 3rd International Conference on Image Processing and Vision Engineering
112

2004), (Yang and Chen, 2012), (Yang et al., 2008b).
Most of these researches have used a few music fea-
tures such as timbre, tonality, rhythm, etc.. They have
classified songs or music clips according to the emo-
tion they evoked using different emotion models.
We also reviewed the literature regarding fractal
arts and found that it is a limited research area. Even
though there are studies that show how useful frac-
tal arts can be for reducing stress and anxiety (Taylor,
2006), (Averchenko et al., 2017), there could not find
researches which have used fractal arts for music vi-
sualization purposes.
3 MUSIC EMOTION DETECTION
3.1 Emotion Model Selection
In music psychology, we cannot find specific details
and a standard music mood taxonomy system about
the basic emotions that music can convey to listeners.
However, there are several fundamental psychological
studies that have focused on different emotions that
humans can perceive (Russell, 1980), (Thayer, 1989).
Those studies’ proposed emotional models can be cat-
egorized into two main approaches: categorical and
dimensional psychometric.
Categorical psychometrics consider the disrupted
perception of emotions. This approach can be used
to cluster emotions into more classes or clusters.
Hevner’s adjective checklist (Hevner, 1935) is one of
the main emotional models categorized under this ap-
proach. This emotional model consists of 67 adjec-
tives organized under eight clusters circularly. Eight
clusters are formulated by grouping similar adjectives
into a related emotional group by depicting the high
inter-cluster similarity. When compared to the dimen-
sional psychometric, the categorical schematics can
be easily understood. However, the problem is that
some emotional adjectives differ from one language
to another while having different meanings. This am-
biguity will be problematic if we adopt this approach
as a main emotional categorization approach since
there are confirmed facts on past research that had
problems in finding definitive ways to discriminate
adjectives that have closer meaning (Yang and Chen,
2012), (Yang et al., 2008a).
Dimensional psychometrics considers multi-
dimensional space to plot the fundamental emotions
rather than clustering them into several uni-polar
conditions or clusters. The circumplex model of
affect proposed by Russell (Russell, 1980) consists
of the two bipolar dimensions that affect mood re-
sponses: arousal and valence. These two dimensions
are represented as a valence-arousal (VA) plan where
the X-axis shows the negative valence to positive
valence (also known as negative to positive pleasant)
and the Y-axis shows the negative to positive arousal.
Furthermore, Russell’s model comprising of a list of
28 adjectives that are located in eight categories of
VA plan, as shown in Fig. 1.
Figure 1: Illustration of Russell’s circumplex model of af-
fect with the eight emotional categories (Russell, 1980).
The main advantage of adopting Russell’s dimen-
sional psychometric is reducing several mood patterns
in the categorical psychometric into the two dimen-
sions. It will be of great importance when coming to
the computational categorization of music emotions
in our research. Because of that, Russell’s circum-
plex model of affects is adopted as the basis music
emotional model of our research. Furthermore, the
VA plane was divided into eight emotional categories
while following the logic proposed by Sorussa, Chok-
suriwong, and Karnjanadecha (Sorussa et al., 2020b),
as shown in Table. 1.
3.2 Music Database Selection
There are many music-related databases, but very few
musical databases relevant to Computer Science and
Information Processing studies. Especially if the ma-
chine learning model is to be used considering emo-
tional annotations. We recognized three main data
sources (1000 Songs Emotional Database (Soleymani
et al., 2013), MER500 (MakarandVelankar, 2020),
The MediaEval Database for Emotional Analysis of
Music (DEAM) [(Alajanki et al., 2016) & (Eyben
et al., 2013)]) relevant to our study. However, due
to the results showed in previous studies [(Sorussa
et al., 2020c) & (Aljanaki et al., 2017)] we selected
the DEAM data set.
Emotion Based Music Visualization with Fractal Arts
113

Table 1: Basic logic for the eight emotional classes of VA
Plan.
Category VA logic range Emotions
Category
1
High Arousal
& Positive Valence
(Valence) ≤ (Arousal)
Aroused,
Astonished,
Excited
Category
2
High Arousal
& Positive Valence
(Valence) > (Arousal)
Delighted,
Happy
Category
3
Low Arousal
& Positive Valence
(Valence) ≥ (|Arousal|)
Pleased,
Glad,
Serene,
Content,
At Ease,
Satisfied,
Relaxed
Category
4
Low Arousal
& Positive Valence
(Valence) < (|Arousal|)
Calm,
Sleepy
Category
5
Low Arousal
& Negative Valence
(
|
Valence
|
) ≤ (
|
Arousal
|
)
Tired,
Droopy,
Bored
Category
6
Low Arousal
& Negative Valence
(
|
Valence
|
) > (
|
Arousal
|
)
Depressed,
Gloomy,
Sad,
Miserable
Category
7
High Arousal
& Negative Valence
(
|
Valence
|
) ≥ (Arousal)
Frustrated,
Distressed
Category
8
High Arousal
& Negative Valence
(
|
Valence
|
) < (Arousal)
Annoyed,
Afraid,
Angry,
Tense,
Alarmed
In this study, only 45s song segments were con-
sidered. Then dynamic annotations (Arousal, Va-
lence) related to those songs were summarized to
mean value. Arousal/ valence value is then combined
as the target label with the extracted music features
relevant to the song.
3.3 Feature Extraction
Similar to music databases, a limited number of
tools are available to extract music features compu-
tationally. MARSYAS, MatLab MIR toolbox, and
JAudio (McEnnis et al., 2005) are currently avail-
able software tools. According to a previous study,
(Abeysinghe, 2016) all default features marked in
JAudio (as shown in table 2) are used to extract mu-
sic features. Each feature is extracted for the average
value and standard deviation value. There were 72
features in total (14 features, 32 dimensions on aver-
age, and standard deviation).
After extracting music features, they were pre-
Table 2: Extracted Music Features from the DEAM Data
set.
Feature Name Dimension
Spectral Centroid 1
Spectral Rolloff Point 1
Spectral Flux 1
Compactness 1
Spectral Variability 1
Root Mean Square 1
Fraction of Low Energy Windows 1
Zero Crossings 1
Strongest Beat 1
Beat Sum 1
Strength of Strongest Beat 1
LPC 10
Method of Moments 5
Area Method of Moments of MFCCs 10
possessed using Waikato Environment for Knowledge
Analysis software (WEKA). Firstly, extracted fea-
tures were normalized and then standardized. An au-
tomatic feature selection filter was used to extract the
most suitable features. For Arousal, there were 13
features, and there were 09 features for valence.
3.4 Classification Approaches
As mentioned previously, after prepossessing the ex-
tract music features, we conducted 07 subsequent ex-
periments separately for both emotional dimensions
using the WEKA tool. To show more detailed clas-
sification results of those experiments, Table. 3 and
4 show the results of Correlation coefficient (R),
Mean absolute error (MAE), Root mean squared error
(RSE), Relative absolute error (RAE) and, Root rela-
tive squared error (RRSE) among the different classi-
fiers, where Table. 3 corresponds to the regression of
arousal Table. 4 regression of valence.
From Table. 3, the highest correlation coefficient
of 0.817 was delivered when using the “Random For-
est” classifier, and the lowest correlation coefficient of
0.580 was obtained when using the “Decision Stump”
classifier. Overall, these results indicate the “Random
Forest” classifier has good performance in predicting
the arousal values. Also, it has comparatively less
MAE, RSE, RAE, and RRSE values compared with
the other classifiers.
From Table. 4, the highest correlation coefficient
of 0.602 was obtained when using the “Random For-
IMPROVE 2023 - 3rd International Conference on Image Processing and Vision Engineering
114

Table 3: Experimental results of the prediction of Arousal.
R MAE RSE RAE RRSE
Random
Forest
0.817 0.125 0.163 52.224% 57.714%
REP
Tree
0.730 0.149 0.195 62.429% 68.721%
Linear
Regression
0.810 0.126 0.166 52.971% 58.586%
Multi
layer
Perceptron
0.811 0.158 0.199 66.220% 70.182%
Simple
Liner
Regression
0.6138 0.1757 0.224 73.378% 78.942%
Decision
Stump
0.580 0.183 0.231 76.801% 81.473%
Random
Tree
0.678 0.166 0.222 69.628% 78.351%
Table 4: Experimental results of the prediction of Valence.
R MAE RSE RAE RRSE
Random
Forest
0.602 0.15 0.190 75.102% 79.853%
REP
Tree
0.520 0.160 0.205 80.528% 85.841%
Linear
Regression
0.575 0.152 0.195 76.496% 81.804%
Multi
layer
Perceptron
0.558 0.180 0.229 90.184% 95.832%
Simple
Liner
Regression
0.398 0.173 0.219 87.095% 91.844%
Decision
Stump
0.377 0.178 0.221 89.289% 92.625%
Random
Tree
0.381 0.210 0.266 105.225% 111.659%
est” classifier, and the lowest correlation coefficient of
0.377 was obtained when using the “Decision Stump”
classifier. The accuracy of each classifier used for va-
lence prediction is low compared to the same classi-
fiers used to predict arousal values. However, pre-
vious studies have shown that prediction results of
arousal have been always more accurate than the va-
lence prediction (Yang et al., 2008), (Fukayama and
Goto, 2016), (Weninger et al., 2014), (Nguyen et al.,
2017). Therefore, we assumed that this relatively low
correlation coefficient was acceptable for our study.
Overall, these results show that the ”Random for-
est” classifier performs well in predicting arousal and
valence values, and its error values are relatively low
compared to other classifiers. Thus, we used the
“Random Forest” classifier as the main classifier for
our study to obtain arousal and valence values.
4 VISUALIZING MUSIC
EMOTIONS USING FRACTAL
ART BASED ANIMATIONS
The JWildfire software was used in this study as the
main fractal art generation tool. Currently, JWild-
fire software supports generating 50 types of differ-
ent image types including the most commonly used
two fractal art types of “Mandelbrot” and “Julia set
(also known as Julians)”. The “Mandelbrot” and “Ju-
lia Set” fractals are produced using the same formu-
las. But those two forms have different starting val-
ues. Because of that, if we can map one of these frac-
tal arts to the emotional values of a music segment,
it can easily adapt that to other types as well. There-
fore, we have selected “Julia set” as the main focused
fractal art type in the first phase of our research study
with the aim of continuing this for the “Mandelbrot”
fractal as well.
When studying the “Julians” fractal generation file
which was in the source code of the JWildfire applica-
tion, we identified that it consists of main three trans-
formations. These transformations consist of sepa-
rate values for position, colour, weight, and varia-
tions. Furthermore, we found that it is possible to
map colour and positioning values of the fractal art
by considering predicted valence and arousal values
which we received from above mentioned computa-
tional models as described in the below sections.
4.1 Processing of Color Values in
Fractal Art
Colour was chosen as a primary mapping function be-
tween the music segments and visual arts by consider-
ing the arousal and valence values obtained from the
above-mentioned computational process. The reason
for choosing colour as the primary mapping function
is a strong relationship between colours and emotions.
In any art medium, artists are using colours to excite
the emotional values in their audience by considering
the meaning of colours with associated factors such
as personal experiences, cultural factors, and evolu-
tion (L., 2005). Because of that choosing a colour to
demonstrate a specific emotion can be a very subjec-
tive and doubtful topic.
However, there are several fundamental past re-
search works on the relationship between colours and
emotions (St
˚
ahl et al., 2005), (Bialoskorski et al.,
2009b). The EMoto: an emotional text messaging
service developed by St
˚
ahl, Sundstr
¨
om, and H
¨
o
¨
ok
(St
˚
ahl et al., 2005) provides a chance for users to ad-
just the affective background that includes colours,
Emotion Based Music Visualization with Fractal Arts
115

shapes, and animations of a text message to fit the
emotional expression that the user wants to achieve.
In this study, colours and emotions are mapped by
following Itten’s circular colour model (Itten, 1974)
where red colour is used to represent high arousal, and
blue colour is used to represent low arousal. Also, the
mood swing system proposed by Bialoskorski, West-
erink, and Broek, which interprets and visualizes the
affect expressed by a person, has used Itten’s trans-
formed colour circle with six colour combinations to
reflect the emotional state of the user, based on the
user’s movements (Bialoskorski et al., 2009b). In this
study, red and orange colors represent high arousal,
while blue and green colors represent low arousal.
Figure 2: Illustration of mapping of the Itten’s colour sys-
tem (Itten, 1974) to Russell’s circumplex model of af-
fect(Russell, 1980).
In our approach, we also adopted Itten’s circular
colour model as the basis colour model, and then ad-
justed it to fit Russell’s circumplex model of affect,
as is shown in Fig. 2. When the arousal and valence
are neutral, the colours fade to white towards the cir-
cle’s center. To represent high arousal, a combination
of red-orange colours is used, and to represent low
arousal; blue colour is used by following the theories
and studies mentioned above.
As we get two values corresponding to Valence
and Arousal, we first tried fitting them as (x, y) coor-
dinates in the colour wheel given in Fig. 2 and getting
the RGB value of the specific point using Java code.
A downside of directly mapping the coordinates was
that colours we get as output were very light due to
most of the songs having low Valence and Arousal
values. As it is clear from Fig. 2, the colours near
the center of the wheel tend to be lighter. Since we
need distinct colours to clearly depict the difference
in emotions evoked by different songs, we re-scaled
the values of valence and arousal when using them as
input to the Java code. By slightly increasing the in-
put values from this method we managed to get colour
readings as RGB values that are distinct to each emo-
tion. This initially received RGB colour values were
assigned to the 2
nd
transformation in the fractal art.
Color value (light colour related to the predicted
emotional colour) for the transformation 1 assigned
considering
r
3
circle’s perimeter (point A in Fig. 3)
in the colour wheel. Colour value for transforma-
tion 3 (bright colour related to the predicted emotional
colour) was obtained from the perimeter of the color
wheel (point B in Fig. 3). Fig.3 shows the diagram
related to this calculation. Improvements to the pre-
dicted colour were added as the same colour varia-
tions to the original predicted colour. Angle with x-
axis calculated using equation 1.
θ = tan
−1
(
x
y
) (1)
Color coordinates (x”, y”) relevant to the transfor-
mation 1 obtained using equations 2 and 3. (division
by 255 was performed to map the coordinates with the
colour wheel)
x
′′
=
cos(θ) × 85
255
(2)
y
′′
=
sin(θ) × 85
255
(3)
Figure 3: Colour wheel diagram for colour coordinates cal-
culation.
Color coordinates (x”’, y”’) relevant to transfor-
mation 3 were obtained using equations 4 and 5. (di-
vision by 255 was performed to map the coordinates
with the colour wheel)
x
′′′
=
cos(θ) × 255
255
= cos(θ) × 1 (4)
IMPROVE 2023 - 3rd International Conference on Image Processing and Vision Engineering
116
y
′′′
=
sin(θ) × 255
255
= sin(θ) × 1 (5)
4.2 Arranging Positioning Values in
Fractal Art
We set the position values of each transformation
to give a unique starting point for each Julian frac-
tal based on the music clip’s predicted valence and
arousal values. However, there was an issue due to in-
compatibility between JWildfire’s graphic coordinate
system and Russell’s circumplex model. The graphic
coordinate system used in the JWildfire application is
slightly different from the standard geometric carte-
sian coordinate system followed in Russell’s model.
The main difference was the orientation of the y-axis
is upside down on the graphic coordinate system used
in the JWildfire application. Also, the maximum and
minimum values of the circumplex model differ from
the JWildfire application.
Because of that, we followed 2D Transformation
rules for scaling and rotating for coinciding with both
coordinate systems. Scaling factors for each axis of
the JWildfire application were calculated by dividing
the length of the relevant axis in the JWildfire appli-
cation by the length of the relevant axis in the cir-
cumplex model. Assuming the predicted valence and
arousal values as initial coordinates (x, y) and scaling
factors (Sx, Sy), we can derive new coordinates (X’,
Y’) to adjust the positioning point of the JWildfire ap-
plication using the following equations.
X
′
= X × Sx = 3X ;(Sx = 3) (6)
Y
′
= −1(Y × Sy = −2Y ; (Sy = 2) (7)
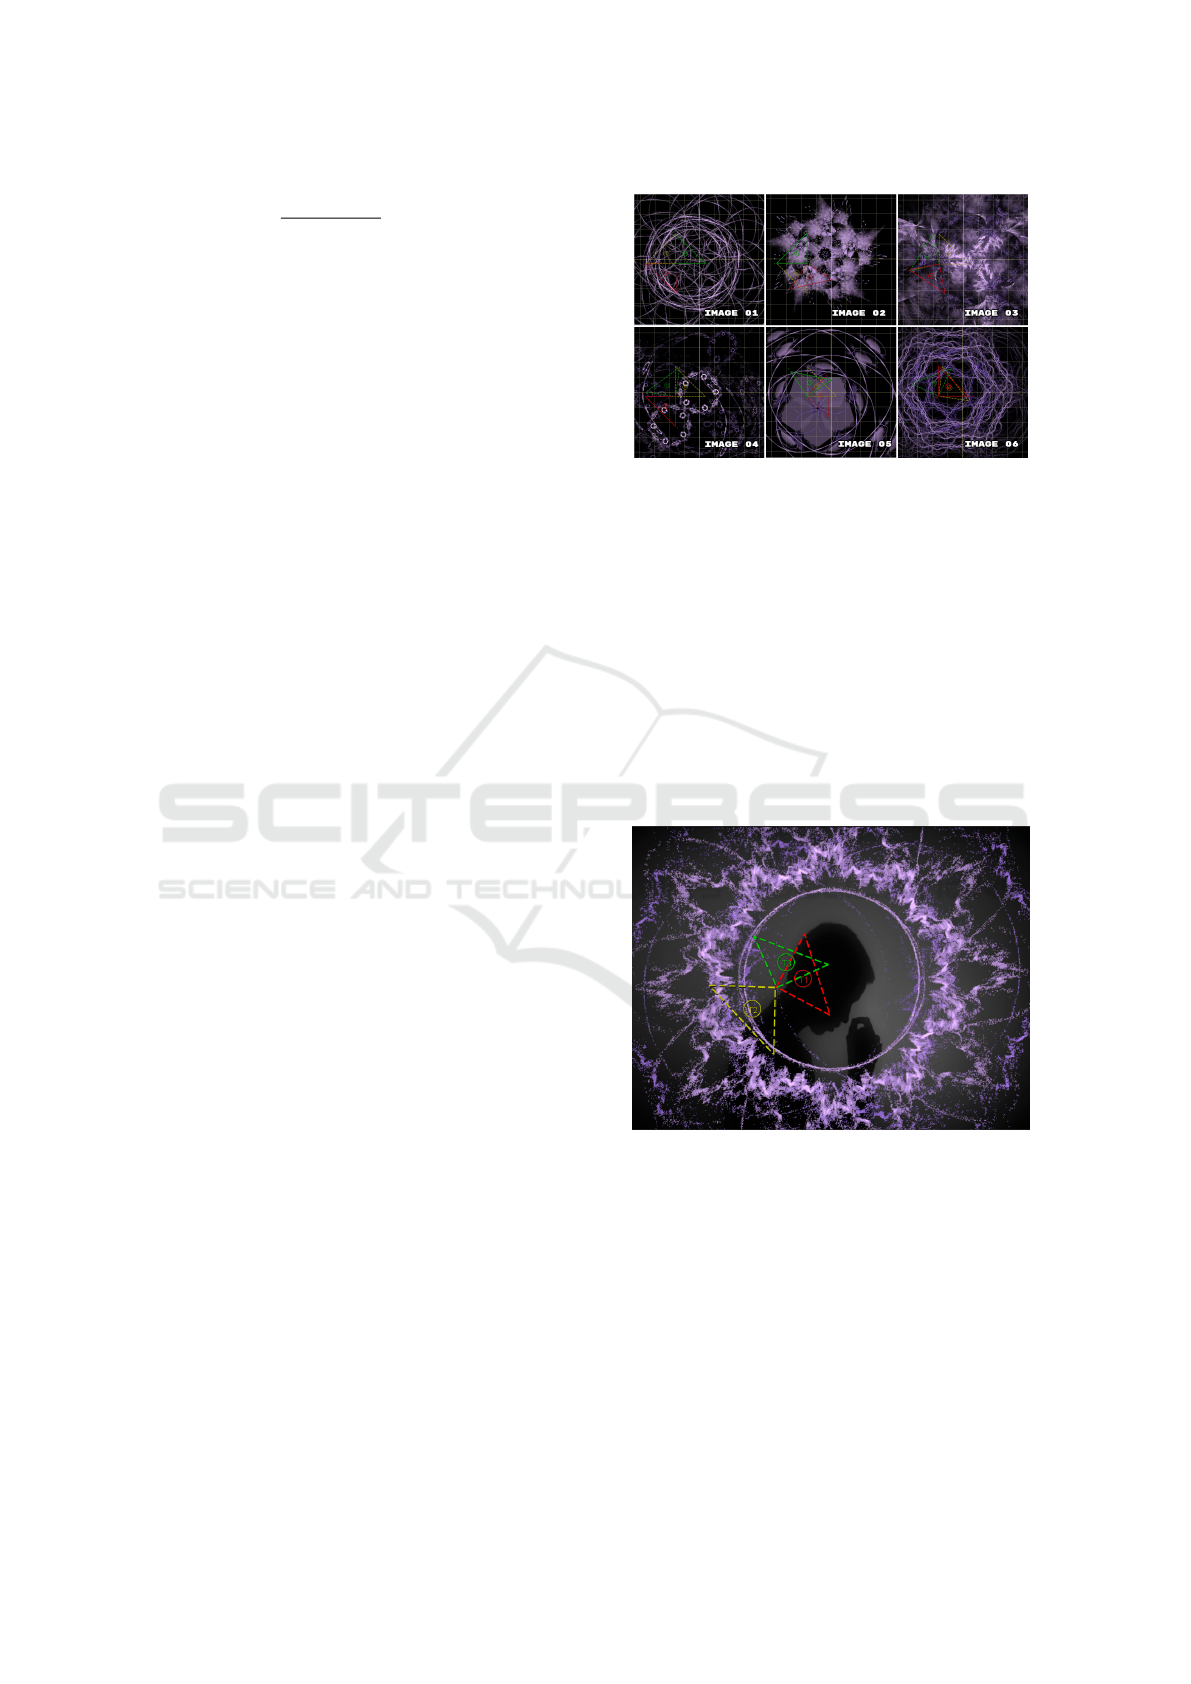
Example 1. If the valence and arousal are predicted
as -0.27 and -0.068 through the built emotional pre-
diction models, the initial RGB value will be calcu-
lated as 202, 166, 225. This initial RGB value is set to
the input colour value of the 2
nd
transformation in the
fractal art. According to the above mentioned colour
mapping, two shade values of the initial RGB value
will be calculated as 196, 157, 228 and 133, 85, 234.
Those RGB colour values are set to the 1
st
and 3
rd
transformations in the fractal art. New coordinates
values will be calculated as the x-axis equal to -0.81
(By using equation number 1) and the y-axis equal to
0.136 (By using equation number 2). From these val-
ues, we can generate different images (accordingly 25
images at once) which have the same colour patterns
and unique coordinates positioning as shown in Fig.4.
Figure 4: Sample images for same valence and arousal val-
ues.
4.3 Fractal Arts with Background
Image
As Fig. 5 shows this is an enhanced feature to high-
light the predicted emotion. In order to improve the
emotional value given by the visualization, a back-
ground image relevant to the emotion used a gray
scale. Gray-scale was used to give more priority
and highlight the emotional colour. The transparency
level of fractal art is also configured to the maximum
level. To achieve this, an external image-providing
API was combined with the JWildfire.
Figure 5: Fractal Art after assigning background image.
4.4 Animating Fractal Art According to
the Song Variations
After creating fractal art according to the process de-
scribed in the above section, the final step is to arrange
fractal art animations. In JWildFire there are Global
Scripts and XForm Scripts to animate a given frac-
tal art. Global scripts animate fractal art as a whole.
XForm Scripts animate fractal art considering trans-
formations. In this study, Rotate roll was selected as
the only global script. Other scripts are more suitable
Emotion Based Music Visualization with Fractal Arts
117

for 3D fractals and some scripts move away the frac-
tal from the screen for a long time period. Due to that
reason, other scripts are not considered in this study.
Table 5: Configurations used to render fractal image series.
Configuration Name Value
Frame rate 12 frames per second
Duration 540 frames
Total video duration
540
12
= 45 seconds
Resolution 800 x 600
Quality very low quality
For the XForm Scripts, Rotate 2ND XForm
(with music variations), Rotate Final XForm,
Rotate Post Full (with music variations), Ro-
tate Post 2ND XForm (with music variations) were
selected. Music variations are assigned to some
selected scripts. As Fig. 6 shows, it synchronizes the
fractal art according to the motion curve related to
the song.
In order to create fractal visualization, fractal im-
ages were generated as a series of PNG images. Table
5 shows the configurations used to render the fractal
image series. After creating image series those were
combined with the relevant song segment consider-
ing the same FPS rate in VirtualDub (free and open-
source software) video processing utility tool.
Figure 6: Motion curve for a XForm script.
5 RESULTS & FINDINGS
The emotional perception of acoustic and visual me-
dia is a very subjective topic. Hence, it is difficult to
evaluate the final research outcomes through an ob-
jective evaluation. Hence, we evaluated our research
outcomes through a subjective user evaluation. The
final evaluation was conducted as an online survey.
For that, 12 song segments (45-second duration) were
selected from languages of English, Sinhala, Tamil,
and Hindi. When selecting songs, at least one song
segment was selected to represent each category of
Rusell’s circumplex emotional model as shown in Ta-
ble 6. For each selected song segment, 03 types of
music visualization options were created. In addition
to the one generated by our research, we generated an-
other random visualization by using the JWildfire ap-
plication without considering emotional perceptions
and mathematical relationships. As a third one, we
used an animation generated using Windows Media
Player. Then the created 03 types of visualizations for
one song segment were combined as one sequence in
a video. All of the combined videos were uploaded
to a YouTube channel and divided into 03 playlists
by attaching a separate questionnaire form for each
playlist.
Table 6: Details of the song segments used in the final eval-
uation.
No Song Duration (s) Lang. Cat.
01
Uptown Funk 0.05 - 0.50 English 1
Naraseeha Gatha 1.49 - 2.34 Sinhala 6
Sunn Raha Hai 1.00 - 1.45 Hindi 7
Muqabla 0.06 - 0.51 Tamil 1
02
Aradhana 1.15 - 2.00 Sinhala 4
Singappenney 0.42 - 1.27 Tamil 2
My Immortal 1.45 - 2.30 English 6
Final Countdown 3.50 - 4.35 English 8
03
Photograph 0.10 - 0.55 English 5
Kasthuri Suwandaki 0.49 - 1.34 Sinhala 1
Yenti Yenti 0.57 - 1.42 Tamil 3
Chand Chhupa 0.30 - 1.15 Hindi 2
We managed to get a total of 604 responses from
151 respondents aged from 18 to 65. Since there were
3 Google forms with each of them having 4 songs, we
managed to get around 50 responses for each song.
Microsoft Excel was used to pre-process, analyze, and
visualize the data gathered from these surveys. We fo-
cused on comparing our visualization with the other 2
based on 4 different criteria. The following questions
were asked to cover those criteria.
• Question 1 (emotion): Which visualization gives
a feeling similar to the emotions of the song?
• Question 2 (colour): Which visualization’s colors
are most relevant to the emotional feeling of the
song?
IMPROVE 2023 - 3rd International Conference on Image Processing and Vision Engineering
118

• Question 3 (synchronization): In which visualiza-
tion is the music most synchronized with the ani-
mation?
• Question 4 (entertainment value): Which visual-
ization is the most suitable as a background visual
in a musical show?
Figure 7: Comparison of different visualizations.
Fig. 7 shows the summary of the evaluation re-
sults under the 4 main evaluation criteria consid-
ered. It is clear from this graph and results analy-
sis that our emotion-based fractal visualization is the
most preferred visualization while Windows Media
Player visualization and random fractal visualization
rank second and third respectively for every category.
Also, by analyzing the correlation between demo-
graphic data gathered and answers to these questions,
it was found that these visualization preferences do
not change much with demographic changes such as
gender, age, language, etc. and they are much more
dependent on personal preference.
6 CONCLUSION
This paper uses fractal art-based animations to vi-
sualize music. The emotional model used is Rus-
sell’s circumplex model of affects, which measures
Arousal and Valence. The approach uses the MediaE-
val DEAM database for acoustic data, with 72 acous-
tic feature values extracted per 45s song segment us-
ing JAudio. Different experiments were conducted
using WEKA to find the best classifier for predict-
ing arousal and valence values. The ”Random For-
est” classifier was found to be the most accurate. This
study focuses on using ”Julia set” fractals generated
by JWildfire to visualize music by mapping colours
and positioning values based on predicted arousal and
valence values. A relevant background image is used
for emotional expression and synchronization with
the music. However, there is room for improvement,
and evaluation was limited due to Covid-19 restric-
tions. The system could potentially be used to reduce
stress and anxiety. This approach is a preliminary at-
tempt to create a suitable music visualization method
and could inspire more research on music visualiza-
tion.
REFERENCES
Abeysinghe, H. (2016). Automatic Genre Classification
for Sri Lankan Music with Machine Learning Ap-
proaches. 1 edition.
Alajanki, A., Yang, Y.-H., and Soleymani, M. (2016).
Benchmarking music emotion recognition systems.
PLOS ONE. under review.
Aljanaki, A., Yang, y.-h., and Soleymani, M. (2017). Devel-
oping a benchmark for emotional analysis of music.
PLOS ONE, 12:e0173392.
Averchenko, A., Korolenko, P., and Mishin, A. Y. (2017).
Optical-physical aspects of fractal art therapy. In 2017
Progress In Electromagnetics Research Symposium-
Spring (PIERS), pages 3418–3421. IEEE.
Bialoskorski, L. S., Westerink, J. H., and van den Broek,
E. L. (2009a). Mood swings: An affective interac-
tive art system. In International conference on intelli-
gent technologies for interactive entertainment, pages
181–186. Springer.
Bialoskorski, L. S. S., Westerink, J. H. D. M., and van den
Broek, E. L. (2009b). Mood swings: design and eval-
uation of affective interactive art. New Review of Hy-
permedia and Multimedia, 15(2):173–191.
Chen, C.-H., Weng, M.-F., Jeng, S.-K., and Chuang, Y.-
Y. (2008). Emotion-based music visualization us-
ing photos. In Proceedings of the 14th Interna-
tional Conference on Advances in Multimedia Mod-
eling, MMM’08, page 358–368, Berlin, Heidelberg.
Springer-Verlag.
Ciuha, P., Klemenc, B., and Solina, F. (2010). Visualization
of concurrent tones in music with colours. In Pro-
ceedings of the 18th ACM International Conference
on Multimedia, MM ’10, page 1677–1680, New York,
NY, USA. Association for Computing Machinery.
Dharmapriya, J., Dayarathne, L., Diasena, T., Arunathilake,
S., Kodikara, N., and Wijesekera, P. (2021). Music
emotion visualization through colour. In 2021 Inter-
national Conference on Electronics, Information, and
Communication (ICEIC), pages 1–6.
Eyben, F., Weninger, F., Gross, F., and Schuller, B. (2013).
Recent developments in opensmile, the munich open-
source multimedia feature extractor. In Proceedings of
the 21st ACM International Conference on Multime-
dia, MM ’13, pages 835–838, New York, NY, USA.
ACM.
Fagerberg, P., St
˚
ahl, A., and H
¨
o
¨
ok, K. (2004). emoto: emo-
tionally engaging interaction. Personal and Ubiqui-
tous Computing, 8(5):377–381.
Fourney, D. W. and Fels, D. I. (2009). Creating access to
music through visualization. In 2009 IEEE Toronto
International Conference Science and Technology for
Humanity (TIC-STH), pages 939–944. IEEE.
Emotion Based Music Visualization with Fractal Arts
119

Fukayama, S. and Goto, M. (2016). Music emotion recogni-
tion with adaptive aggregation of gaussian process re-
gressors. In 2016 IEEE International Conference on
Acoustics, Speech and Signal Processing (ICASSP),
pages 71–75.
Hevner, K. (1935). Expression in music: A discussion of
experimental studies and theories. Psychological Re-
view, 42(2):186–204.
Itten, J. (1974). The art of color: The subjective experience
and objective rationale of color.
Kim, Y. E., Schmidt, E. M., Migneco, R., Morton, B. G.,
Richardson, P., Scott, J., Speck, J. A., and Turnbull,
D. (2010). Music emotion recognition: A state of the
art review. In Proc. ismir, volume 86, pages 937–952.
L., Z. V. (2005). The expressions of colours. In DiGRA
ཁ - Proceedings of the 2005 DiGRA Interna-
tional Conference: Changing Views: Worlds in Play.
Lartillot, O. and Toiviainen, P. (2007). Mir in matlab (ii):
A toolbox for musical feature extraction from audio.
pages 127–130.
Lee, Y. and Fathia, R. N. (2016). Interactive music visu-
alization for music player using processing. In 2016
22nd International Conference on Virtual System &
Multimedia (VSMM), pages 1–4. IEEE.
Li, T. and Ogihara, M. (2003). Detecting emotion in music.
MakarandVelankar (2020). Mer500.
Margounakis, D. and Politis, D. (2006). Converting images
to music using their colour properties. Georgia Insti-
tute of Technology.
McEnnis, D., McKay, C., Fujinaga, I., and Depalle, P.
(2005). jaudio: An feature extraction library. pages
600–603.
Nguyen, V., Kim, D., Ho, V., and Lim, Y. (2017). A new
recognition method for visualizing music emotion. In-
ternational Journal of Electrical and Computer Engi-
neering, 7:1246–1254.
Russell, J. (1980). A circumplex model of affect. Journal
of Personality and Social Psychology, 39:1161–1178.
Santos Luiz, C., M
´
onico, L., Silva, C., and Campelos, S.
(2015). Relationship between mathematics and music:
Systematization of contents according to the programs
of mathematics from 5th to 12th grades of portuguese
education.
Soleymani, M., Caro, M., Schmidt, E., Sha, C.-Y., and
Yang, y.-h. (2013). 1000 songs for emotional analysis
of music. pages 1–6.
Sorussa, K., Choksuriwong, A., and Karnjanadecha, M.
(2020a). Emotion classification system for digital mu-
sic with a cascaded technique. ECTI Transactions on
Computer and Information Technology (ECTI-CIT),
14(1):53–66.
Sorussa, K., Choksuriwong, A., and Karnjanadecha, M.
(2020b). Emotion classification system for digital mu-
sic with a cascaded technique. ECTI Transactions on
Computer and Information Technology (ECTI-CIT),
14:53–66.
Sorussa, K., Choksuriwong, A., and Karnjanadecha, M.
(2020c). Emotion classification system for digital mu-
sic with a cascaded technique. ECTI Transactions on
Computer and Information Technology (ECTI-CIT),
14:53–66.
St
˚
ahl, A., Sundstr
¨
om, P., and H
¨
o
¨
ok, K. (2005). A founda-
tion for emotional expressivity.
Taylor, R. P. (2006). Reduction of physiological stress using
fractal art and architecture. Leonardo, 39(3):245–251.
Thayer, R. E. (1989). The biopsychology of mood and
arousal. Oxford University Press Inc.
Weninger, F., Eyben, F., and Schuller, B. (2014). On-line
continuous-time music mood regression with deep re-
current neural networks. In 2014 IEEE International
Conference on Acoustics, Speech and Signal Process-
ing (ICASSP), pages 5412–5416.
Whiteford, K. L., Schloss, K. B., Helwig, N. E., and Palmer,
S. E. (2018). Color, music, and emotion: Bach to the
blues. i-Perception, 9(6):2041669518808535.
Yang, Y., Lin, Y., Su, Y., and Chen, H. H. (2008). A regres-
sion approach to music emotion recognition. IEEE
Transactions on Audio, Speech, and Language Pro-
cessing, 16(2):448–457.
Yang, Y.-H. and Chen, H. H. (2012). Machine recognition
of music emotion: A review. ACM Transactions on
Intelligent Systems and Technology (TIST), 3(3):1–30.
Yang, y.-h., Lin, Y.-C., Su, Y.-F., and Chen, H. (2008a).
A regression approach to music emotion recogni-
tion. Audio, Speech, and Language Processing, IEEE
Transactions on, 16:448 – 457.
Yang, Y.-H., Lin, Y.-C., Su, Y.-F., and Chen, H. H. (2008b).
A regression approach to music emotion recognition.
IEEE Transactions on audio, speech, and language
processing, 16(2):448–457.
Zhao, S., Gao, Y., Jiang, X., Yao, H., Chua, T.-S., and
Sun, X. (2014a). Exploring principles-of-art features
for image emotion recognition. In Proceedings of the
22nd ACM international conference on Multimedia,
pages 47–56.
Zhao, S., Yao, H., Wang, F., Jiang, X., and Zhang, W.
(2014b). Emotion based image musicalization. In
2014 IEEE International conference on multimedia
and expo workshops (ICMEW), pages 1–6. IEEE.
IMPROVE 2023 - 3rd International Conference on Image Processing and Vision Engineering
120
