
New Challenges in the Implementation and Exploitation of a Low-Cost
Web Map of the Active Deformation Areas Across Europe
Jos
´
e A. Navarro
a
, Danielly Garc
´
ıa
b
and Michele Crosetto
c
Centre Tecnol
`
ogic de Telecomunicacions de Catalunya (CTTC/CERCA), Av. Carl Friedrich Gauss 7,
08860 Castelldefels, Spain
Keywords:
Active Deformation Areas, EGMS, Geoprocessing, Land Subsidence, Open-Source, WebGIS.
Abstract:
The European Ground Motion Service (EGMS) is already offering data on Persistent Scatterers (PS) through-
out Europe, which will aid in analyzing ground deformation on a continental scale. However, to more fully
comprehend ground motion processes, it is preferable to use Active Deformation Areas (ADA) instead of PS.
The CTTC has been using its ADAfinder tool to generate ADAs since 2018. With the new availability of
EGMS PS data for the entire continent, the CTTC is now working on producing ADAs for all of Europe and
making them accessible to the public through a self-developed, in-house hosted, web-based map application.
A former paper describes the initial steps taken to develop it. This work focuses on how the challenge of
processing a huge amount of data has affected the design and implementation of the tools used in the data
production workflow. Additionally, the manner in which the EGMS data is structured, providing data sets that
spatially overlap, has resulted in a new problem: overlapping ADAs. The approach to resolving this issue is
also discussed in this paper. The result is an evolution of the initial concept where not only economic reasons
but also considerations on automation and handling of large volumes of data have guided the design and im-
plementation of the system.
1 INTRODUCTION
The European Ground Motion Service (EGMS) (Eu-
ropean Environment Agency, 2021) has already pro-
vided billions of Point Scatterers (PS) data for the
whole of Europe (Crosetto et al., 2020), which will
be a valuable tool for analyzing ground deformation
processes at a continental level. However, Active De-
formation Areas (ADA) are a more effective means
of understanding these processes as they depict areas
where actual deformation is occurring, which reduces
the amount of information to analyze. Figure 1 illus-
trates an area covered by several ADAs, with colors
indicating up to four levels of certainty of the find-
ings.
(Barra et al., 2017) describe the methodology for
identifying ADAs, which involve creating a poly-
gon that encircles the affected area, and computing
the aforesaid level of certainty. This helps experts
to focus their efforts on areas that actually require
their expertise. The CTTC developed in 2018 a tool,
a
https://orcid.org/0000-0001-7877-1516
b
https://orcid.org/0000-0002-8191-3308
c
https://orcid.org/0000-0001-8545-5490
Figure 1: ADAs and their reliability. The white bullets in-
side the ADAs are the PS used to build them.
ADAfinder, that implements this methodology and
has been in use since. (Tom
´
as et al., 2019; Navarro
et al., 2020) provide more detailed description of
ADAfinder and other related tools.
As part of the SARAI project, funded by the Span-
ish Ministry of Science and Innovation (MCIN), the
CTTC is working on publishing ADAs online for the
entire European continent by creating a web map ap-
plication specifically for this purpose. This section
briefly reviews the technologies used to devise and
implement not only the web map application but also
the several software components targeted at produc-
192
Navarro, J., García, D. and Crosetto, M.
New Challenges in the Implementation and Exploitation of a Low-Cost Web Map of the Active Deformation Areas Across Europe.
DOI: 10.5220/0011964500003473
In Proceedings of the 9th International Conference on Geographical Information Systems Theory, Applications and Management (GISTAM 2023), pages 192-199
ISBN: 978-989-758-649-1; ISSN: 2184-500X
Copyright
c
2023 by SCITEPRESS – Science and Technology Publications, Lda. Under CC license (CC BY-NC-ND 4.0)
ing the data to be published—that is, to transform
the PS delivered by the EGMS into ADAs stored
in a database accessed by the said web application,
namely the data production pipeline and workflow.
This review is provided for the sake of completeness,
since the interested reader may find a much more de-
tailed description in (Navarro et al., 2022). Note,
however, that the web application has evolved since
the publication of the aforementioned paper, so any
relevant changes will be discussed where appropriate.
Why Not the Cloud? The initial problem to be
solved was determining where the information about
ADAs and the web map application would be stored.
The initial plan of using the cloud was rejected due
to the high cost it incurred (thousands of euros per
year). Therefore, an in-house solution was chosen.
An existing server was repurposed to host both the
data and the applications.
Server Hardware. The repurposed server had 32
GB of RAM, an Intel(R) Core(TM) i7-4790 CPU @
3.60GHz / 8 cores processor, and a 7 Tb RAID 1
SATA disk system.
Server Software. Keeping the Cost Low. The
required software modules to set up the web map ap-
plication were chosen from the open-source and free
market. These included:
• PostgreSQL (The PostgreSQL Global Devel-
opment Group, 2021) plus PostGIS (PostGIS
Project Steering Committee, 2021) for storing
geospatial data - the ADAs.
• GeoServer - a web-based tool for publishing
geospatial data, which retrieves information from
a database such as PostgreSQL and makes
it available via standard web-based protocols.
See (OSGEO, 2021).
• Apache (The Apache Software Foundation,
2021b) + Tomcat (The Apache Software Foun-
dation, 2021a) are httpd and Java servers respec-
tively - to run both GeoServer and the web map
application.
• Finally, the web map is a self-developed tool pro-
grammed in JavaScript and HTML. It relies di-
rectly on GeoServer to retrieve the ADA data it
displays.
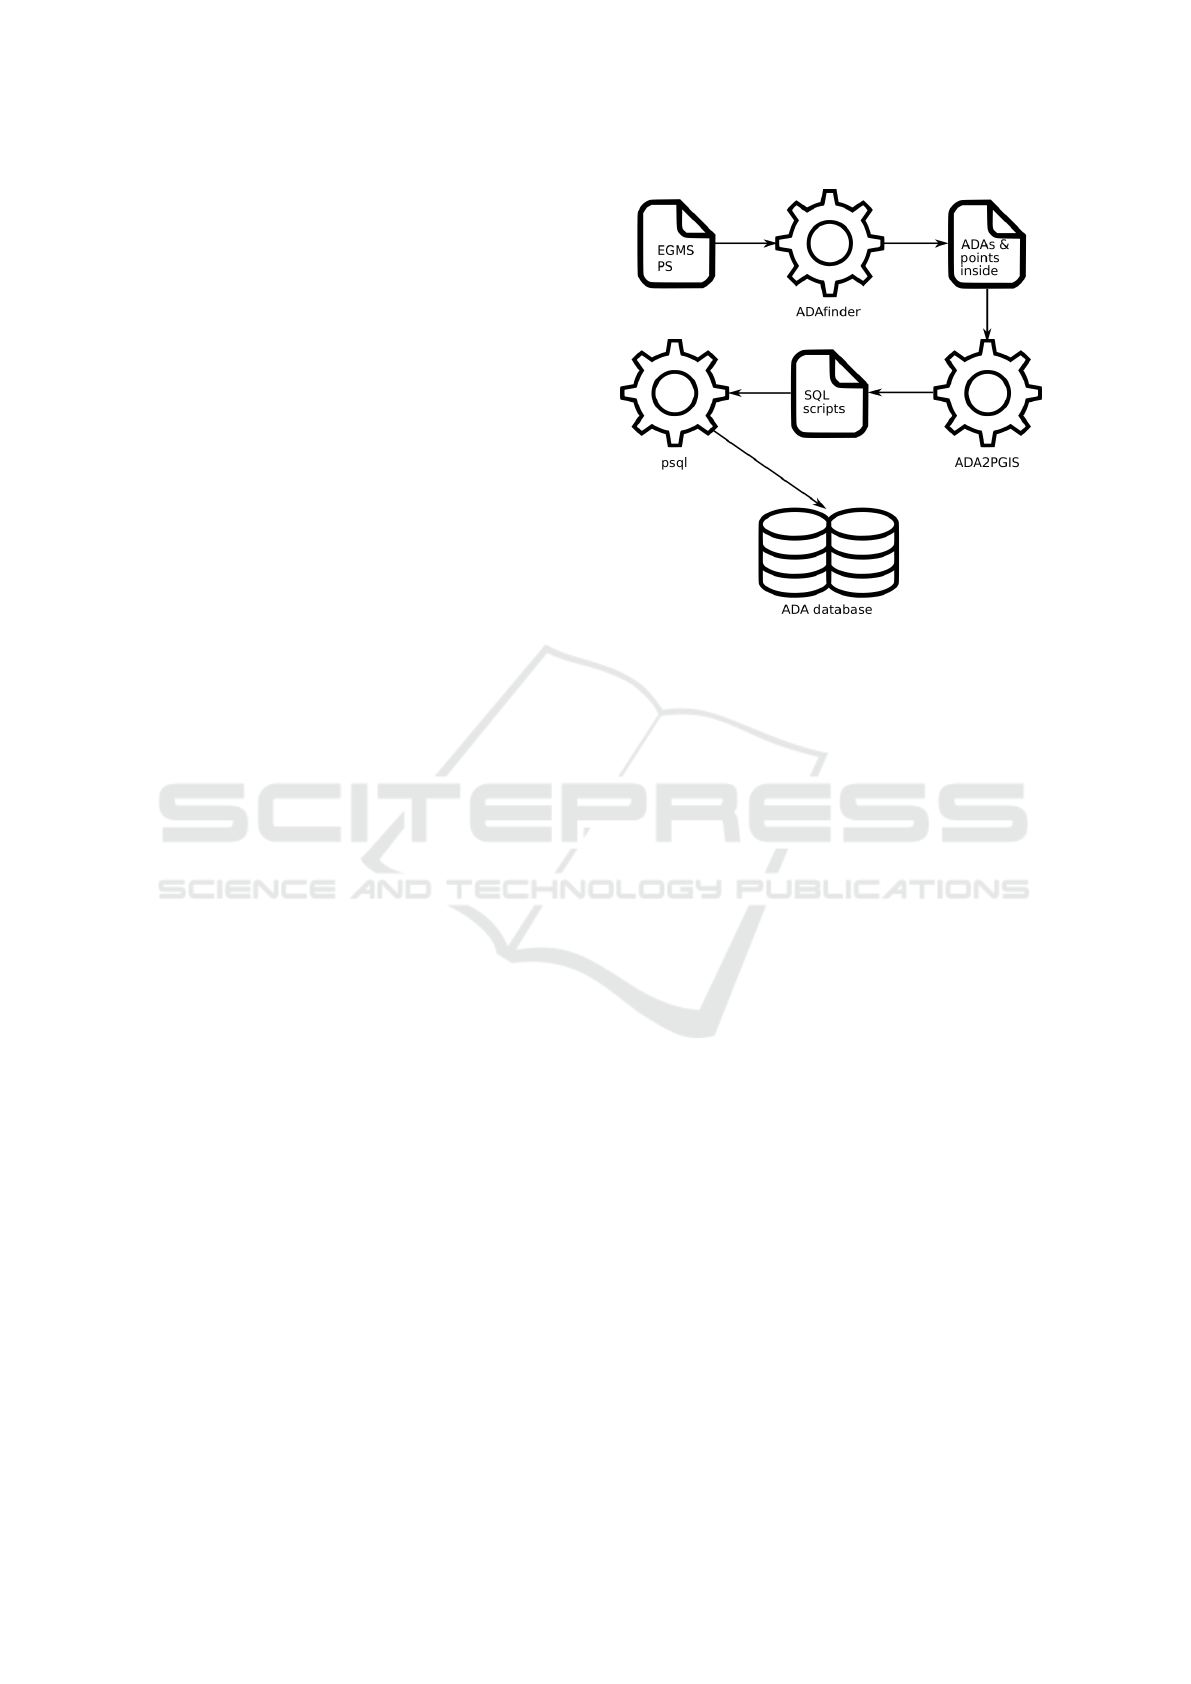
Producing the ADAs. The ADA are generated
through a software pipeline that includes:
• ADAfinder - a self-developed tool that has been
in use since 2018, which takes the PS delivered
by the EGMS as input to produce the ADAs.
• ADA2PGIS - a tool specifically created for this
project, it takes the ADAs created by ADAfinder
and produces a series of SQL-compliant files,
Figure 2: The original data production workflow.
Source: (Navarro et al., 2022).
which include the same information but in a for-
mat that can be used to interact with the database.
• psql - a command-line tool that is included with
PostgreSQL, used to execute the files provided
by ADA2PGIS and insert the ADAs into the
database.
This workflow, oriented at processing a single EGMS
data set at a time, is depicted by Figure 2. Note that
once a data set has been processed as described it is
inserted into the database, which makes it immedi-
ately accessible via the web application.
The Web Map Application. It has been devel-
oped using JavaScript and HTML and it is aimed at
the visualization of the stored ADAs. It may zoom,
pan, and filter data by combining up to three criteria
such as the mean velocity of the ADAs or their quality
assessment value. Different background layers, such
as OpenStreetMaps, Google Satellite, or Google Ter-
rain can be chosen. When an ADA is clicked on, in-
formation about its attributes, including its averaged
deformation time series, is displayed. Figure 3 shows
the web application, depicting an ADA, its attribute
table and time deformation series. The legend, filters
and other controls as well as the attribute data table
are located at the right side of the image, while the
map itself is shown on the left. The original version
of the application showed the time deformation series
as a numeric table; the current one, as seen in the said
figure, already presents an interactive chart. Addition-
ally, the current version may tell apart ADAs originat-
ing from either ascending or descending orbits.
From this point, and once the EGMS data were
available, it became clear that the next goal to accom-
New Challenges in the Implementation and Exploitation of a Low-Cost Web Map of the Active Deformation Areas Across Europe
193

Figure 3: The web map application.
plish was to build a system capable of dealing with the
processing and management of very large volumes of
data.
The rest of this document is organized as follows:
section 2 discusses the new challenges that had to be
faced and the solutions adopted to address them once
that the initial system moved from a preparatory to a
production stage; more specifically, it highlights the
need to automate the production workflow to manage
huge volumes of data as well as the problem of over-
lapping data sets producing repeated ADAs. Finally,
to conclude, section 3 analyzes how the original sys-
tem needed to evolve from a design standpoint where
economical reasons prevailed to a real-life situation
where the volume of data to handle became the actual
driver of the process.
2 THE NEW CHALLENGES
Since this project started long before the EGMS made
the PS data generally available, it was possible to de-
sign and implement both the web application and the
data pipeline tools taking into account not only the
purely algorithmic aspects but also those related to
the volume of information to handle; although there
was no indication about how big the final number of
PS would be, it was quite clear that it would be big
enough as to take it into account as a design and im-
plementation principle for the software to develop.
ADAfinder, the application identifying the ADAs
already existed and had been designed taking the
problem of data volume in mind. In fact, it is usual
to process input files with as many as five million PS
without problems. The same idea was kept in mind
when implementing ADA2PGIS and, of course, the
web application itself. In this last case, two aspects
were considered: (1) the storage required to keep the
high volume of ADAs obtained and (2) the perfor-
mance of the server that should host the web appli-
cation. As stated in section 1, a RAID system was
installed in the server which was big enough to hold
millions of ADA data; to check the performance of
the system, hundreds of thousands of synthetic ADAs
were inserted into the PostGIS database and the web
application was able to display them without prob-
lems.
The preceding paragraphs aim to show that con-
siderations for handling a significant amount of data
were taken into account from the very beginning.
Nonetheless, and once that data from the EGMS be-
came available, it was evident that not all the facets
of the problem had been foreseen. These were mainly
two: (1) the need to take into account the automa-
tion of some processes due to the aforesaid overabun-
dance of data and (2) the problems created by the
way in which said data is organized, creating areas
where information overlaps thus leading to repeated
outputs. The following subsections elaborate on these
new challenges and how they have been addressed.
GISTAM 2023 - 9th International Conference on Geographical Information Systems Theory, Applications and Management
194

2.1 Simplifying the Operational Aspects
The workflow depicted in Figure 2 explains how the
PS delivered by the EGMS are converted into data
stored in the server database. This workflow is fully
operational and produces correct results. However, it
was conceived to process a single data set at once.
A data set, in this context, is the minimum item
that may be downloaded from the EGMS web site.
It defines, consequently, the granularity of the opera-
tions; in other words, since the workflow in Figure 2
is conceived to process one of these data sets, to fin-
ish the project, every single available data set must be
processed.
Considering that there are about 15,000 data sets
and all of them need to be processed to complete the
project, it should be clear that a lot of human inter-
vention is required. Such a situation implies that the
total time needed to process all the data will be signif-
icantly increased compared to a more automated pro-
cedure. Furthermore, the greater the human interven-
tion involved in the process, the greater the probabil-
ity of errors. Therefore, it seemed clear to the devel-
opment team that the already implemented workflow
needed to be improved to simplify the operational as-
pects of the process.
Automation, however, is conditioned by a tough
prerequisite: uniformity. The ADAfinder step, that is,
identifying ADAs using the PS as input, is a task that
requires adjusting a series of parameters that usually
depend on the input data (as, for instance, the size of
the pixel used in the input imagery, see (Barra et al.,
2017)). On the other hand, the ADAs published on
the web, should be obtained using a set of identical
parameters, since, otherwise, the results for differ-
ent geographical areas could not be compared. This
makes it possible to go for a solution where the level
of automation is much higher. The handicap is to find
a reasonable set of suitable set of parameters to run
ADAfinder for all Europe. This is a task currently un-
dergoing.
At any rate, and since automation is not only de-
sirable but possible, a new set of tools have already
been implemented to make it possible. These are:
• A script that makes possible to run ADAfinder for
all the data sets (EGMS data) stored in a single
directory. The same set of parameters will be used
for every data set. All results are stored in the
same output folder.
• A new application, automateADA2PGIS, will run
ADA2PGIS—the step that transforms the output
of ADAfinder into something suitable to be in-
serted in the server’s database—for all the input
files (ADAfinder-compatible ones) found in the
same directory. Again, all its outputs will be
stored in an unique folder.
Each time that ADA2PGIS is run, a set of out-
put files is created; some of them contain SQL (Stan-
dard Query Language) commands and the last one is
a batch (shell) file that will take care of actually per-
forming the process of inserting the ADAs included
in these SQL files into the database. Since auto-
mateADA2PGIS will run ADA2PGIS for all the in-
puts found in some directory, there will be an equiv-
alent number of outputs. This means that if the num-
ber of input data sets is n, also n batch (shell) files
will be created, each of them taking care of inserting
their respective ADAs. This number n is, in fact, the
total number of items that may be downloaded from
the EGMS, which amounts to about 15,000. Conse-
quently, the operator should run, by hand, all these
shell files to complete the process, which is, again, a
lengthy and tedious procedure, prone to human errors.
To avoid this situation, automateADA2PGIS also cre-
ate a so-called ”master batch file” that takes care of
running each of the individual batch files for every
data set. This completes the automation of the pro-
cess.
To summarize, the automation of the data produc-
tion pipeline could be (but it is not, see section 2.3)
the following one:
1. Download the whole EGMS data sets. Store these
in the same directory, namely the EGMS folder.
2. Run the ADAfinder automated script, taking as in-
put all the files stored in the EGMS folder. All
outputs are stored in the same output directory,
namely the ADAfinder folder. This step identifies
the ADAs.
3. Run the automateADA2PGIS tool, taking as in-
put the files stored in the ADAfinder folder. All
outputs are stored in the same output directory,
namely the automateADA2PGIS folder. This
step transforms the whole set of ADAs into a
format that may be used to insert them into a
database (files with SQL commands). A mas-
ter batch file is generated, controlling the execu-
tion of the individual batch files output by each
run of ADA2PGIS—which is executed by auto-
mateADA2PGIS.
4. Run the master batch file. This step will insert the
whole set of ADAs into the server’s database.
Note that the workflow above first downloads all
the data sets from the EGMS (step 1) to process them
later at once (steps 2 to 4) thanks to the high level of
automation achieved with the script to run ADAfinder
and the automateADA2PGIS tool. Of course, it would
New Challenges in the Implementation and Exploitation of a Low-Cost Web Map of the Active Deformation Areas Across Europe
195
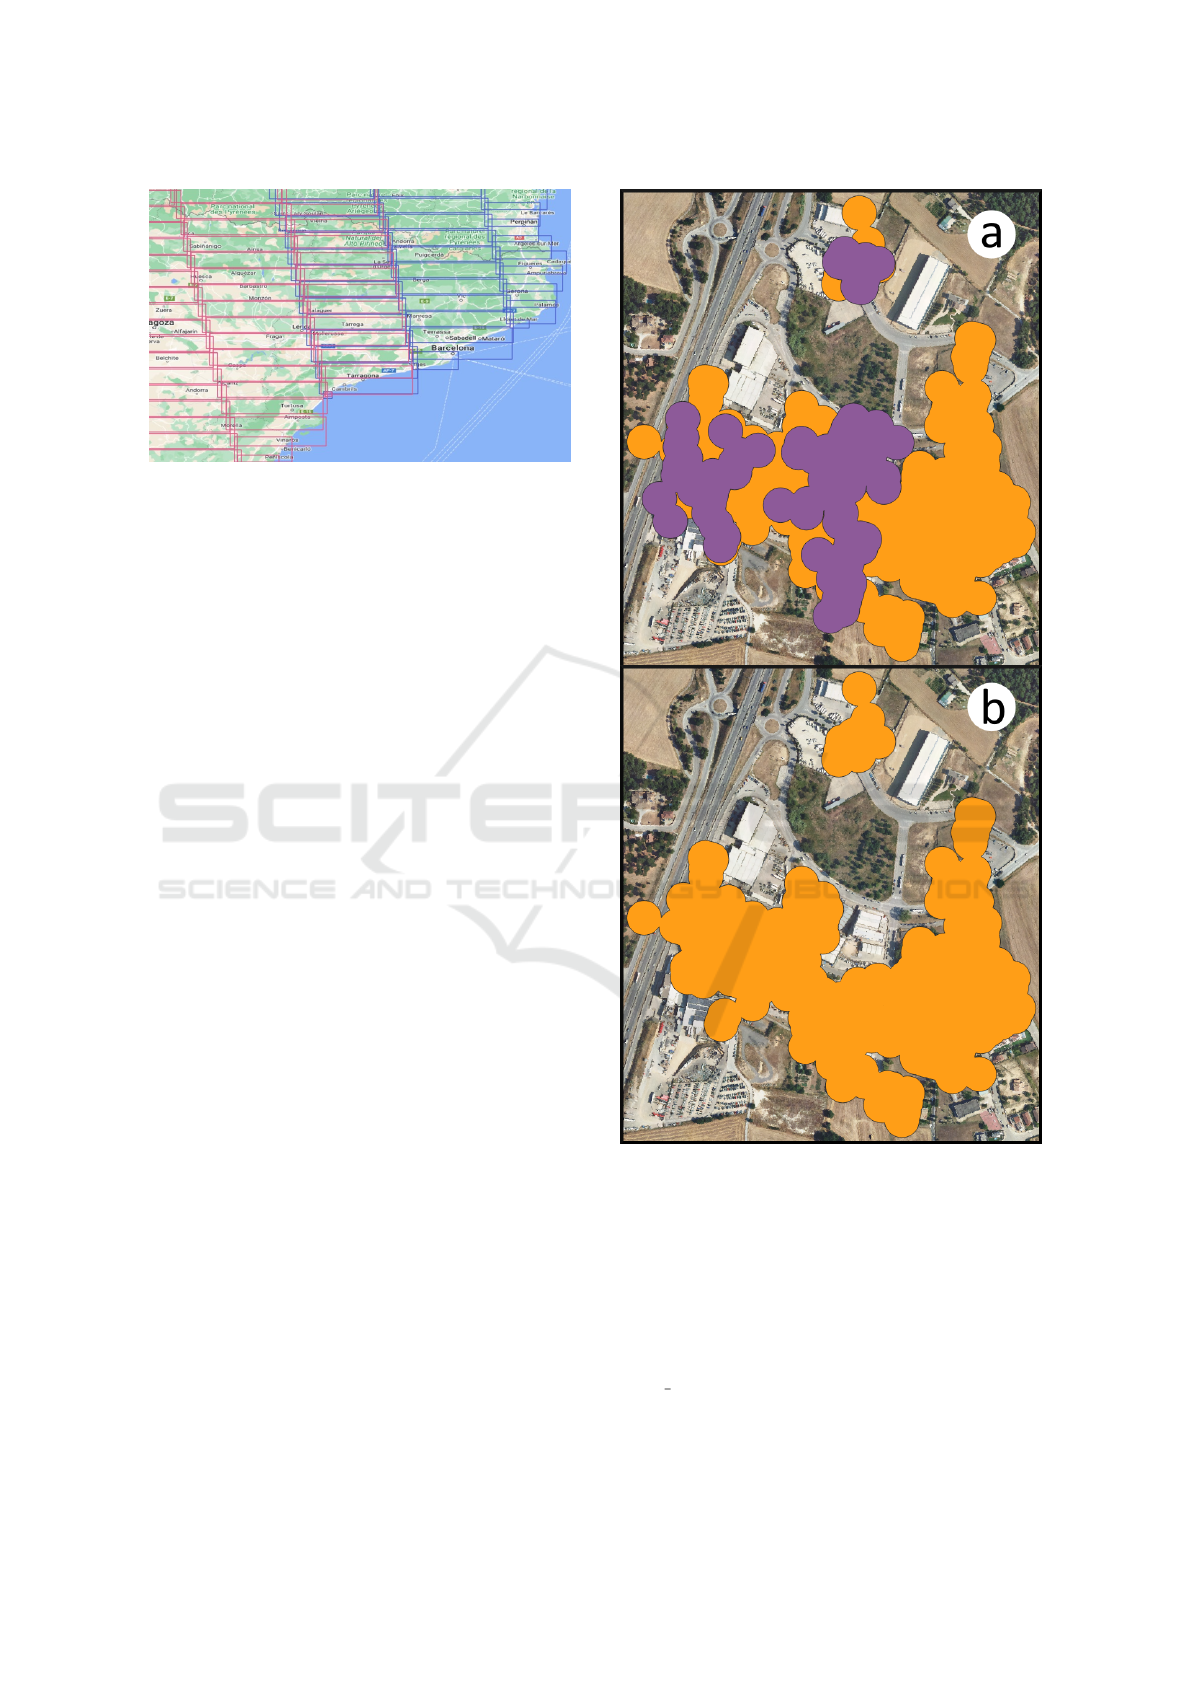
Figure 4: Overlapping EGMS data sets (northeast of Spain).
be possible to proceed downloading smaller groups of
EGMS data sets, fully process them, and start again
until the project is finished. The reason to adopt this
approach (process everything at once at every step) is
due to some restrictions set by a new problem: the
overlapping of ADAs. Section 2.2 describes this is-
sue, how it has been solved and how it affects the
overall production workflow.
2.2 Removing Overlapping ADAs
The EGMS has divided the surface of Europe into
tiles; each of these tiles is the minimum unit of down-
load and, therefore, of processing within the work-
flow. As already mentioned, about 15,000 tiles have
been necessary to cover the entire territory for which
PS data is available.
These tiles overlap with their neighbors. This phe-
nomenon can be observed in Figure 4. This is a prob-
lem from the point of view of data processing, since
duplicate information is generated.
The ADAfinder application is the one affected by
this information overlapping problem. This tool is
used to identify the ADAs of a certain area of the
terrain (the tile) using the PS existing in that area.
When run with some tile as input, it will produce
ADAs located in areas shared with other tiles. When
ADAfinder processes any of these other tiles that are
adjacent to the first one, it is very likely that it will
find new ADAs in the common, overlapped zones.
Some of these new ADAs are not really new,
but the same ones that had been detected previously.
Their shape or extent may vary slightly as the number
of PS included in the overlapping zones of adjacent
tiles may change, but ultimately they are still the same
ADAs.
Figure 5 depicts this problem. More specifically,
Figure 5(a) shows ADAs in an overlapping area that
were created from PS in two different tiles, namely a
and b. Purple ADAs were identified when processing
tile a and the orange ones come from tile b. Here it
Figure 5: Removing overlapping ADAs.
can be seen how the ADAs of tile a overlap with those
that come from the processing of tile b. Their shapes,
as already mentioned, are not identical due to the total
number of points available in each data set, but it is
clear that the ADAs in question represent the same
area and that it does not make sense to store them all
in the server’s database.
This was the reason to develop a new tool,
purge overlaps: removing overlapping ADAs.
This tool had to solve two different problems:
1. Decide, and implement, which are the ADAs to
GISTAM 2023 - 9th International Conference on Geographical Information Systems Theory, Applications and Management
196

remove when overlapping exists and
2. actually remove overlaps for all Europe at once.
Concerning the first problem above, the decision
taken was to remove the smaller ADAs. That is, when
two or more ADAs overlap, only the one whose area
is the largest of all is preserved. With this approxi-
mation, it is intended to keep the ADA that most re-
liably represents how the terrain has been deformed.
Obviously, some information may be lost, as smaller
ADAs whose surface include zones not covered by the
one being retained may be removed. In the example
shown in Figure 5(a) two smaller purple ADAs over-
lap with the bigger orange one, which is the one that
is preserved (see Figure 5(b)). The same is true for
the single smallest purple ADA that overlaps with an-
other orange one at the top of the figure: it is removed
in favor of the one with the largest area.
The criterion used to decide if two ADAs overlap
is the intersection ratio, that is, the area of the inter-
secting zone divided by the area of the ADA itself.
This is a parameter whose value may (and must) be
set by the user. For example, if it is set to x, a couple
of ADAs for which all their overlapping areas have
an intersection percentage lower than x will be con-
sidered as non overlapping, while if this x is exceeded
by any of them the decision is just the opposite: they
overlap.
The second problem, having to remove all the
overlapping ADAs for all Europe at once is due, also,
to the overlapping of the tiles (see again Figure 4).
The reason is that although it would be possible to
check the overlaps stepwise, that is, checking these
for only a couple of tiles at a time, this would signif-
icantly complicate the management of the process. A
tile t overlaps with a number of other tiles, and this is
recursive situation: that is, all the tiles that overlapped
with t also overlaps with other tiles that are not t, and
so on. This means that the number of tile overlaps
to manage is very high. Consequently, purging over-
laps by tile couples would become a long and tedious
process, highly prone to human error due to the large
number of pairs to process and the management over-
head required to ensure no duplicate work is done.
This is, therefore, a clear candidate for task au-
tomation. The new tool purge overlaps has been de-
veloped to solve this problem. It takes the whole set
of outputs of ADAfinder for all Europe as inputs to
perform the purge of overlapping ADAs. The initial
estimate of the total number of ADAs to be processed
places this number below 1,000,000, which is a very
reasonable amount of data to manage by a computer
program, so this should not pose an implementation
problem. On the contrary, the process of finding what
are the couples of ADAs that do intersect, computing
their areas and the intersection between overlapping
candidates might imply a costly computational burden
if an inappropriate algorithm would be used. Fortu-
nately, computer science offers techniques to success-
fully address this problem, techniques that have been
adopted by purge overlaps, so that its performance is
satisfactory.
2.3 The New Workflow
Although purge overlaps solves the problem of the
overlapping ADAs, the use of this program imposes
a restriction on the overall production workflow: it
is not possible to fully process just a subset of tiles
(i.e. going from the download to the insertion of the
ADAs in the server database) and repeat these steps
with some other subsets until all the data from the
EGMS has been processed. This is so due to the need
to purge overlapping ADAs at once, that is, only when
the ADAs for all Europe are finally available.
Taking into account this restriction, the new, final
workflow is as described below:
1. Download the PS from the EGMS.
2. Identify the ADAs using the automated script to
run ADAfinder
The two previous steps may be executed repeat-
edly, combining them to download some data and
then identifying the ADAs for a certain number of
data sets. That is, it is not strictly necessary to wait
until all Europe has been downloaded to proceed to
identify their ADAs at once. At any rate, and no mat-
ter how these two steps are combined, all ADAs must
have been processed before proceeding to step 3 due
to the requirements set by purge overlaps (see sec-
tion 2.2), that is, all ADAs must exist before this tool
is run. Consequently, the conversion of ADAs to SQL
format is performed too in a single automated step
(number 4):
3. Purge the overlapping ADAs for all the data sets
covering Europe at once.
4. Convert all remaining ADAs (those not purged
at the previous step) to SQL format using auto-
mateADA2PGIS. This tool takes care of running
the original ADA2PGIS tool for all the data sets
involved in the process.
5. Run the master batch file created by auto-
mateADA2PGIS, which takes care of performing
the actual insertion of all data into the database.
This step makes the information immediately
available to the web application.
Figure 6 depicts graphically the workflow above.
New Challenges in the Implementation and Exploitation of a Low-Cost Web Map of the Active Deformation Areas Across Europe
197

Figure 6: The new workflow.
3 CONCLUSIONS
In (Navarro et al., 2022) the authors presented a first
attempt to implement a server capable of publishing
the Active Deformation Areas for the whole of Eu-
rope; in that work, the main aspect taken into account
were the economical restrictions that prevented using
the regular solutions available for this kind of prob-
lems, such as hosting both data and software in the
cloud. It is worth noting that the issues related to the
data processing pipeline and the volume of informa-
tion to be handled were already considered; the new
software developed for the project (i.e., ADA2PGIS)
was designed and implemented keeping in mind the
need to automate a production workflow and how
much information needed to be managed; addition-
ally, the web server was configured to be able to store
and display millions of ADAs. The performance of
both the server and the software were tested with syn-
thetic data to ensure that processing and publishing
the ADAs from across Europe was possible using a
low-cost solution. In short, this was the goal of that
work: to show the feasibility of such a system.
It may be said, therefore, that the authors consid-
ered, from the very beginning, not only the technical
aspects of a project of this type but also those issues
related to real-life aspects that only show up when the
actual exploitation of the system begins. The authors,
therefore, felt quite comfortable thinking that every-
thing was ready to start the identification and publish-
ing of ADAs.
Data from the EGMS was finally available by the
beginning of November, 2022. This event was the
trigger to switch from a test environment to a pro-
duction one. As soon as the actual magnitude of the
task (the number of data sets to download and process,
their spatial distribution with overlapping tiles) was fi-
nally known, the problems described in section 2 were
made evident; the development of the scripts to auto-
mate ADAfinder or the automateADA2PGIS tool im-
mediately began, and the new workflow, taking into
account such changes, was designed.
At the moment of writing this paper, the person-
nel responsible for the exploitation of the system is
still downloading the complete data sets of PS from
the EGMS servers—in other words, it has been de-
cided to execute steps 1 and 2 in the workflow de-
scribed in section 2.3 at once: first, everything is
downloaded, then ADAs from across Europe are iden-
tified to then proceed to the remaining steps in the
workflow. Therefore, and since the exploitation of
the system is still at a very early stage, no other is-
sues have arisen yet; the authors consider this possi-
bility as remote, but it cannot, however, be discarded.
Thus, and concerning future work, the foreseen activ-
ities are (1) those strictly related to the pure produc-
tion tasks as described in section 2.3 and Figure 6 so
all the ADAs of all Europe are made available to the
general public; then, (2) to cope with any problems
that the software applications might experience due to
the high volumes of data to process, since, as stated
above, said problems may not be yet discarded and
(3), assuming the success of this project and building
on the experience gained, take a few more steps fur-
ther to create a new web application to show, again
at the continental level and using the same EGMS
data, wide-area differential deformation maps indicat-
ing the gradient of the deformation field—in this case,
the basic software to produce such results is still un-
der development.
To finish, it is worth to state that this paper is tar-
geted at two goals; the first one, describing the low-
GISTAM 2023 - 9th International Conference on Geographical Information Systems Theory, Applications and Management
198

cost system that the CTTC has developed to provide
public ADA data at a continental level; the second,
but no less important aim, is highlighting something
that is generally forgotten or at least overlooked when
systems similar to the one described in (Navarro et al.,
2022) and in this very same work are designed, devel-
oped and put into operation: that not only the algo-
rithms, software or hardware are important, but also
that the operational aspects related with their routine
exploitation or the characteristics of the data to handle
do play a very important role in how these are created
and later on, exploited. Even worse, not considering
aspects such as automation or the reduction of human
intervention may very well increase the risk of failure
for these projects.
The authors foresee that the web map will be made
available to the general public during the first half of
2023.
ACKNOWLEDGEMENTS
This work is part of the Spanish Grant SARAI,
PID2020-116540RB-C21, funded by MCIN/AEI/
10.13039/501100011033.
REFERENCES
Barra, A., Solari, L., B
´
ejar-Pizarro, M., Monserrat, O.,
Bianchini, S., Herrera, G., Crosetto, M., Sarro, R.,
Gonz
´
alez-Alonso, E., Mateos, R. M., Lig
¨
uerzana, S.,
L
´
opez, C., and Moretti, S. (2017). A Methodology to
Detect and Update Active Deformation Areas Based
on Sentinel-1 SAR Images. Remote Sensing,, 9(10).
Crosetto, M., Solari, L., Mr
´
oz, M., Balasis-Levinsen, J.,
Casagli, N., Frei, M., Oyen, A., Moldestadk, D. A.,
Bateson, L., Guerrieri, L., Comerci, V., and Andersen,
H. S. (2020). The Evolution of Wide-Area DInSAR:
From Regional and National Services to the European
Ground Motion Service. Remote Sensing, 12:2043.
European Environment Agency (2021). European Ground
Motion Service – Copernicus Land Monitoring
Service. https://land.copernicus.eu/pan-european/
european-ground-motion-service. Accessed: 2023-
01-11.
OSGEO (2021). GeoServer. http://geoserver.org/. Ac-
cessed: 2023-01-11.
Navarro, J. A., Garc
´
ıa, D., and Crosetto, M. (2022). An
in-house, self-developed low-cost WebGIS relying on
open-source and self-made tools to show the active
deformation areas across europe. In Proceedings of
the 8th International Conference on Geographical In-
formation Systems Theory, Applications and Manage-
ment - Volume 1: GISTAM,, pages 99–106. INSTICC,
SciTePress.
Navarro, J. A., Tom
´
as, R., Barra, A., Pag
´
an, J. I., Reyes-
Carmona, C., Solari, L., Vinielles, J. L., Falco, S., and
Crosetto”, M. (2020). ADAtools: Automatic Detec-
tion and Classification of Active Deformation Areas
from PSI Displacement Maps. ISPRS Int. J. Geo-Inf.,
9:584.
PostGIS Project Steering Committee (2021). PostGIS
— Spatial and Geographic Objects for postgreSQL.
https://postgis.net/. Accessed: 2023-01-11.
The Apache Software Foundation (2021a). Apache
Tomcat
©
– Welcome! http://tomcat.apache.org/. Ac-
cessed: 2023-01-11.
The Apache Software Foundation (2021b). Welcome!
– The Apache HTTP Server Project. https://httpd.
apache.org/. Accessed: 2023-01-11.
The PostgreSQL Global Development Group (2021). Post-
greSQL: The world’s most advanced open source
database. https://www.postgresql.org/. Accessed:
2023-01-11.
Tom
´
as, R., Pag
´
an, J. I., Navarro, J. A., Cano, M., Pastor,
J. L., Riquelme, A., Cuevas-Gonz
´
alez, M., Crosetto,
M., Barra, A., Monserrat, O., L
´
opez-S
´
anchez, J. M.,
Ram
´
on, A., Iborra, S., del Soldato, M., Solari, L.,
Bianchini, S., Raspini, F., Novali, F., Ferreti, A.,
Constantini, M., Trillo, F., Herrera, G., and Casagli,
N. (2019). Semi-Automatic Identification and Pre-
Screening of Geological-Geotechnical Deformational
Processes Using Persistent Scatterer Interferometry
Datasets. Remote Sensing, 11(14).
New Challenges in the Implementation and Exploitation of a Low-Cost Web Map of the Active Deformation Areas Across Europe
199
